
1D K$^{\pm}$K$^{\pm}$ correlation functions (black markers) for four $k_\mathrm{\rm T}$ ranges and for the 0$-$5% centrality class, fitted with Eq. (3) (red bands). The CFs are normalized to unity in $0.1< q< 0.15$ GeV/$c$. Statistical uncertainties are shown as bars and systematic boxes. The width of red bands represents the uncertainties of the Eq. (3) fit. | 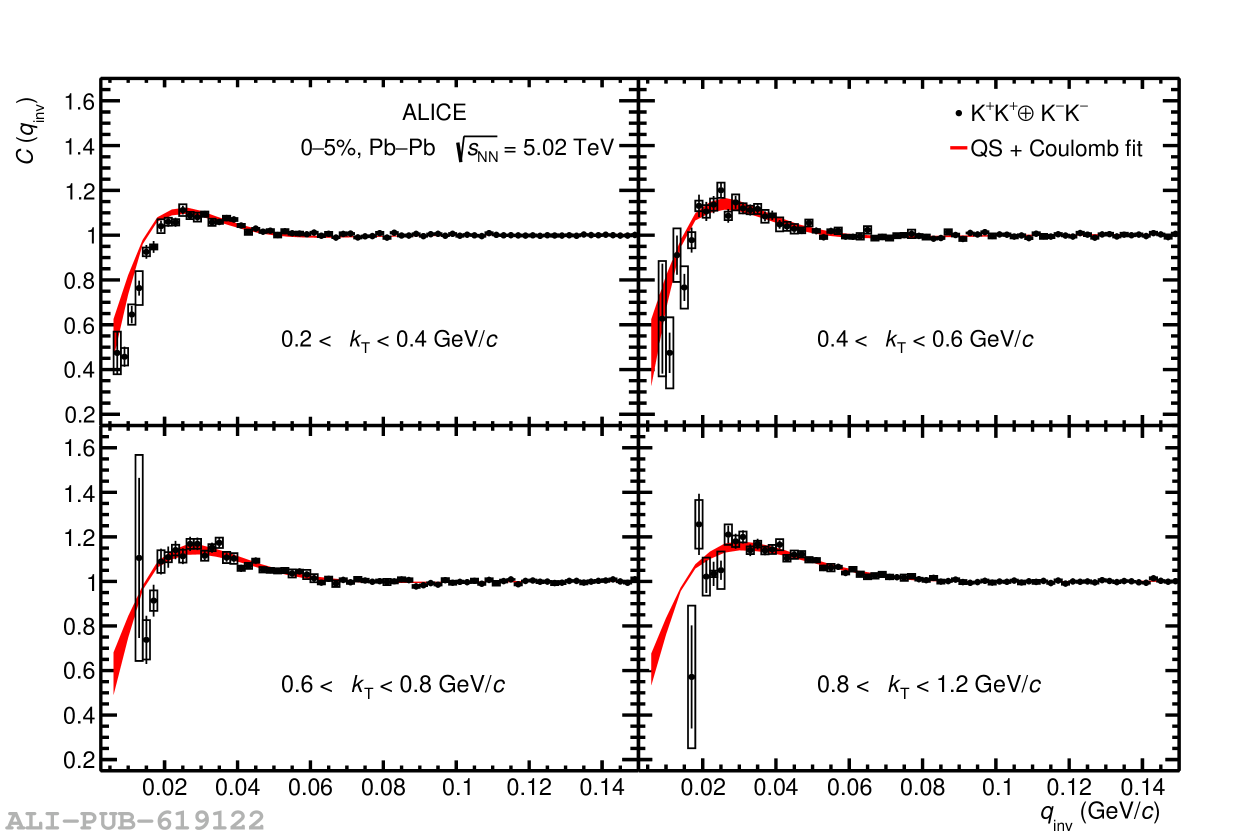 |