
Invariant-mass distribution of $^{3}_{\Lambda}\mathrm{H}$ candidates (left) and $v_{2}$ as a function of the invariant mass (right), in the $5< p_ {\rm T} < 8$ GeV/$c$ transverse-momentum interval and the centrality interval. in left solid red line represents fit with a DSCB function while dotted displays of background second-order polynomial function. total is shown blue line. right described. | 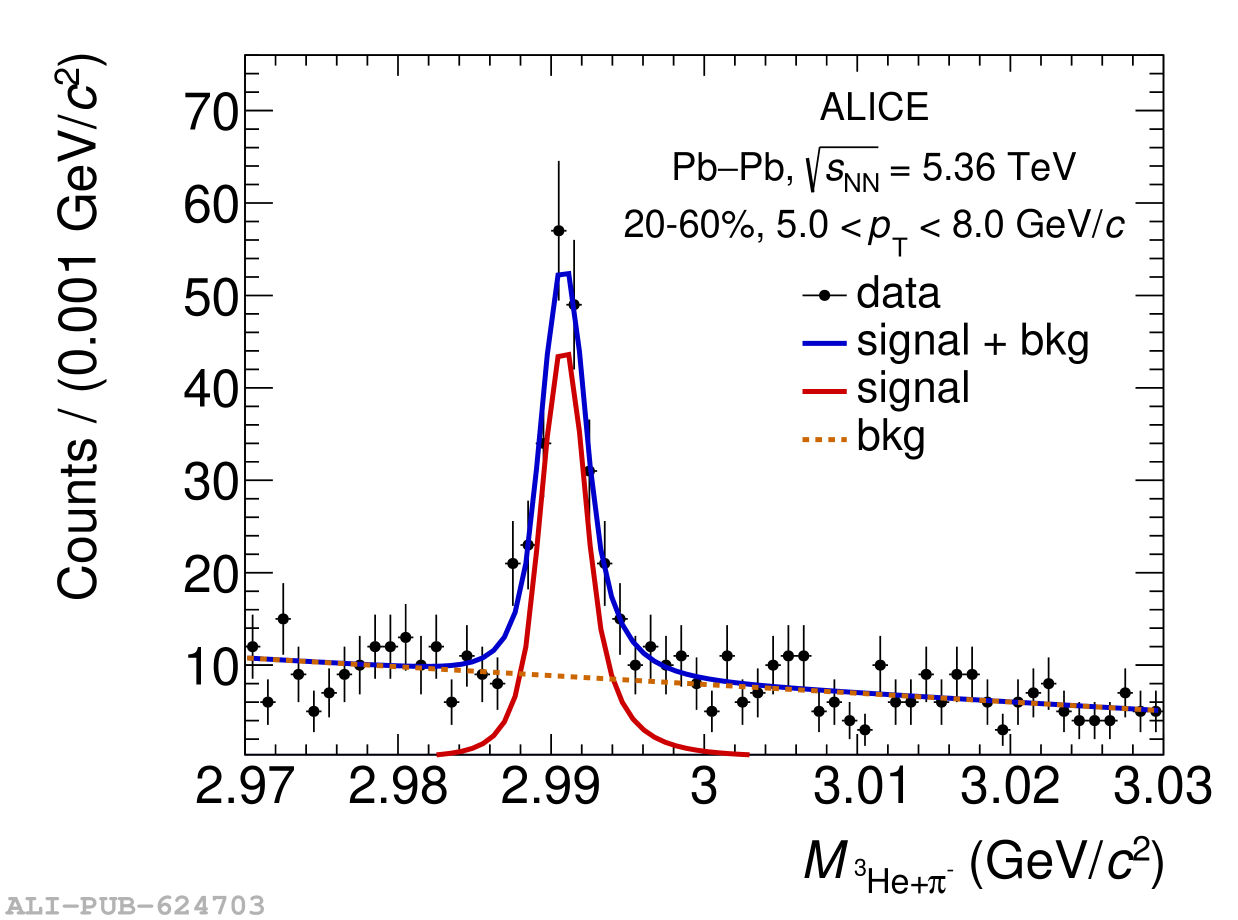 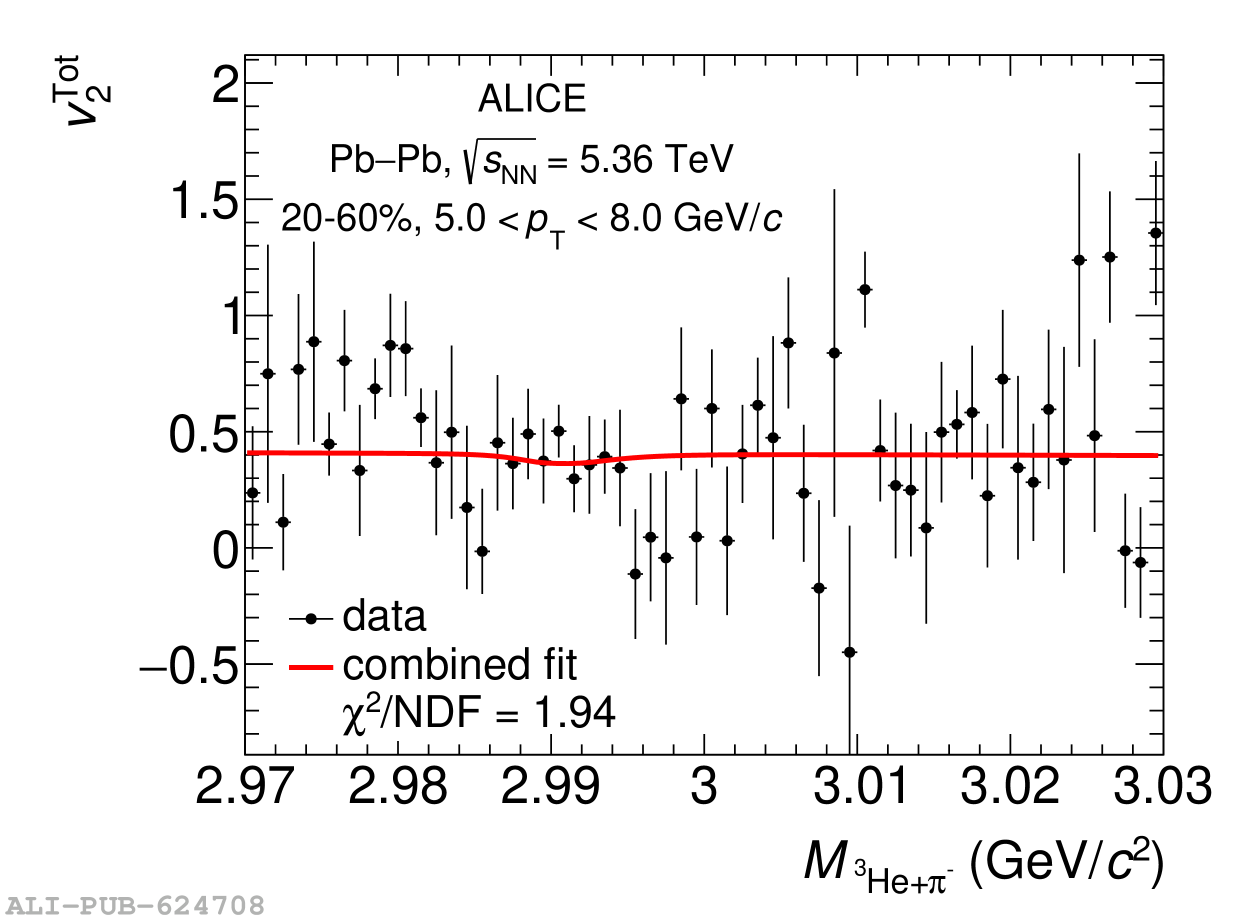 |