The angularity distributions, measured by ALICE in pp collisions at $\sqrt{s}=5.02$ TeV, of \Dzero-tagged jets (red) compared to inclusive charged-particle jets (blue and green) and to PYTHIA 8 simulations for $\alpha=1$, 1.5, 2, and 3 using $R=0.4$ in \jetptrange{10}{20}. The ratio of \Dzero-tagged to inclusive jet angularities is shown in the bottom panels for each value of $\alpha$. Note that the $y$-axis scale differs among the plots. | 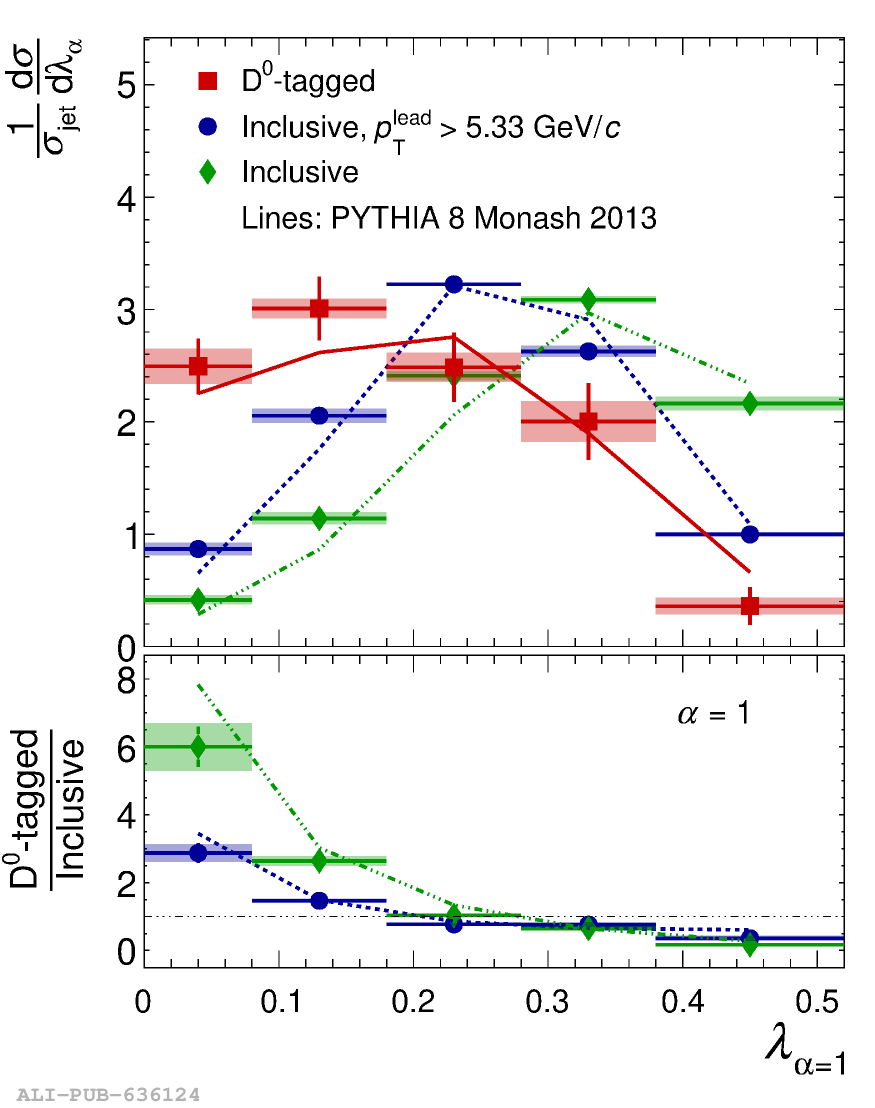 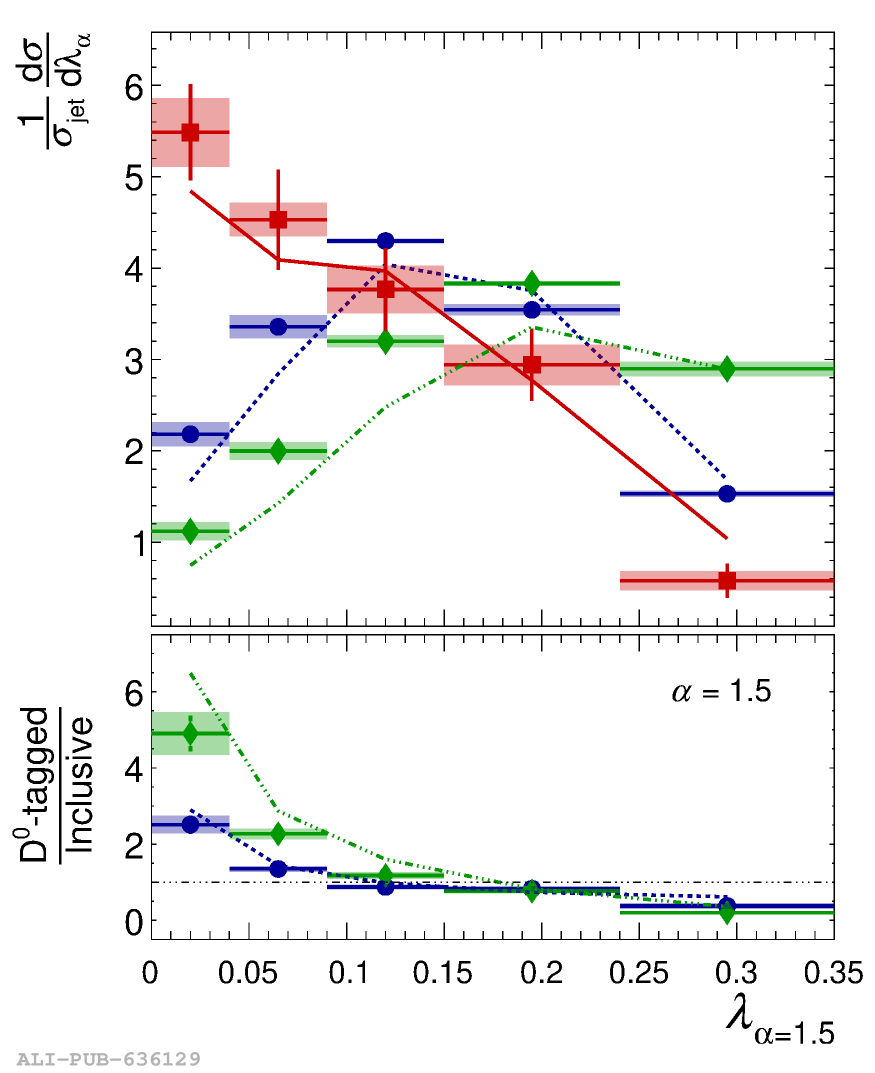  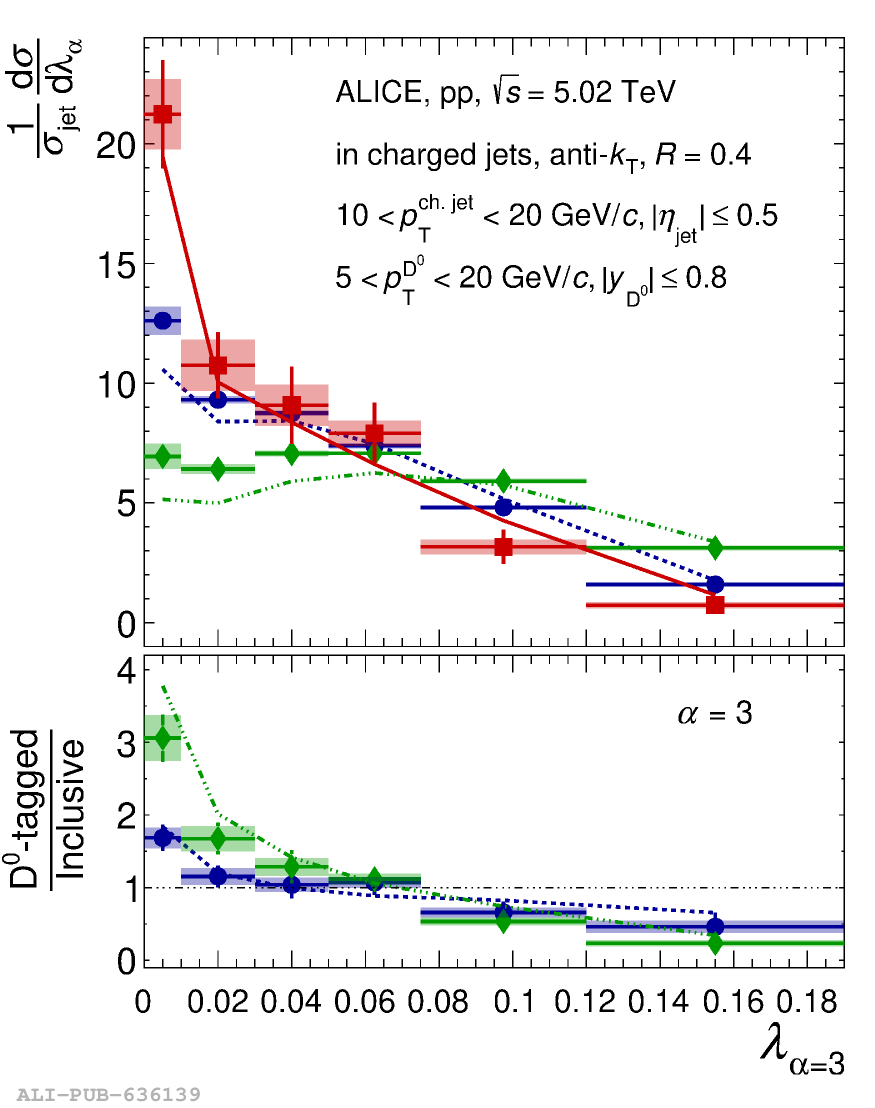 |