Invariant-mass distributions of $\mathrm{B^0}$-meson candidates in the $1 < \pt < 23.5$ $\mathrm{GeV}/c$ (top), $2 < \pt < 4$ $\mathrm{GeV}/c$ (bottom-left), and $10 < \pt < 14$ $\mathrm{GeV}/c$ (bottom-right) intervals. The contributions of the different partially and mis-reconstructed decays to the total fit function (blue) are reported on top of the combinatorial background fit function (red dashed line) with filled colour-coded areas. The values of the signal counts ($S$) are reported in the text. | 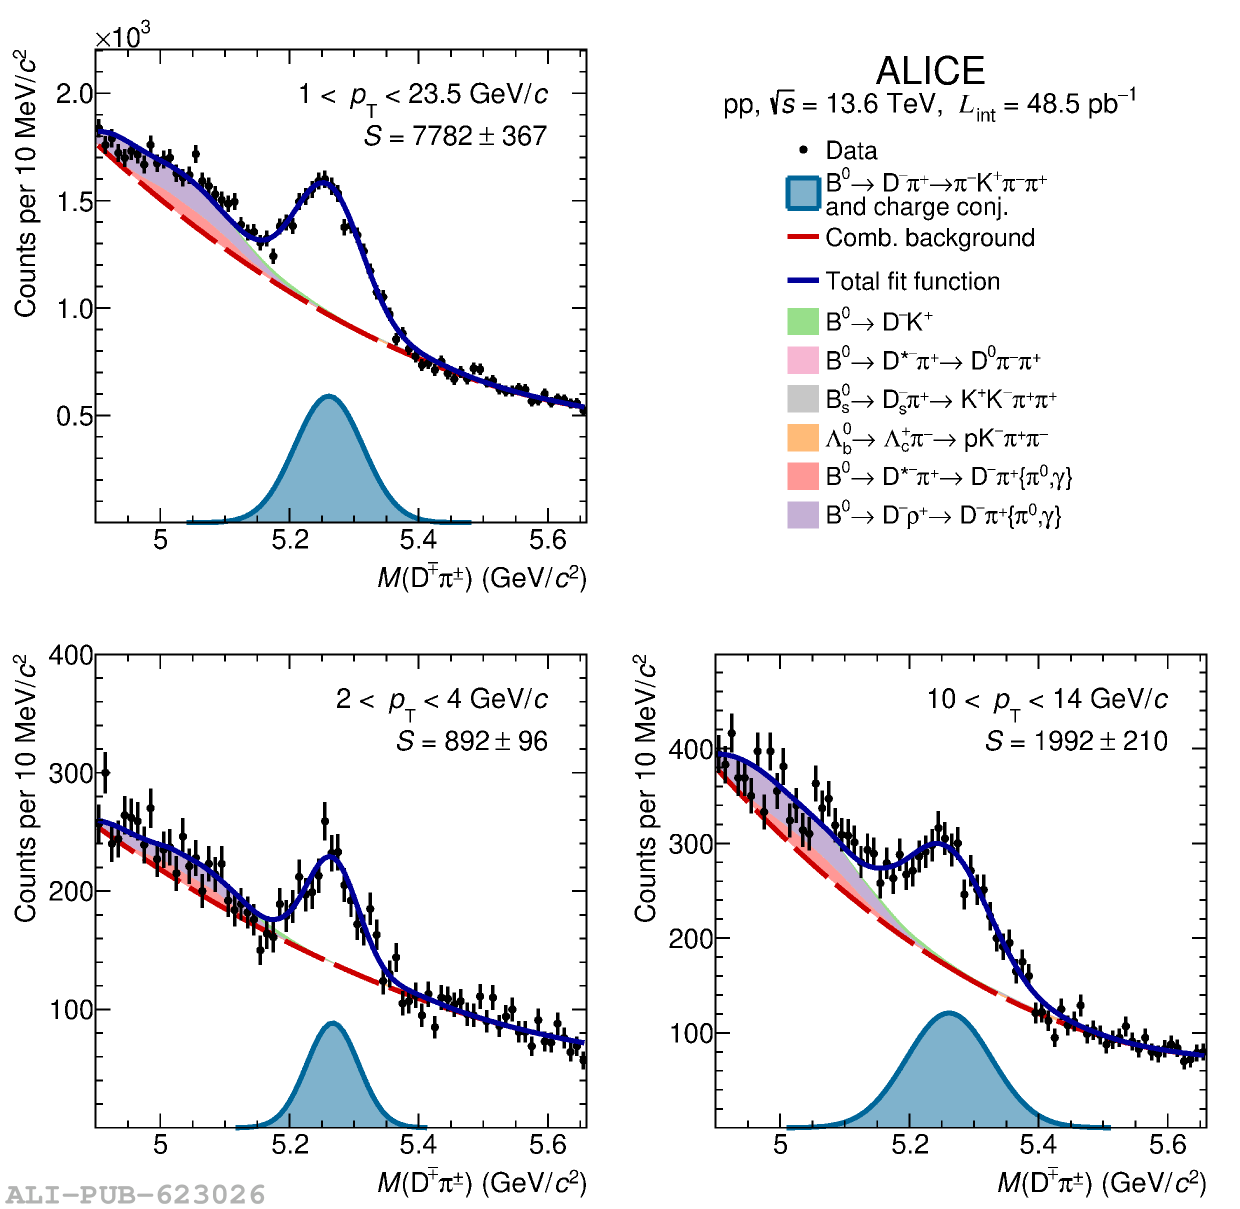 |