The average of deuteron and antideuteron (top row) and antiproton (bottom row) \pt -differential yields in the three azimuthal regions (left) and in jets (right) measured in \pPb collisions at \fivenn. Statistical and systematical uncertainties are reported, respectively, with vertical lines and boxes. Individual \LT fits are also shown. The distributions are scaled for visibility reasons. The bottom panel of each figure shows the ratio of the distribution with respect to the Toward one. | 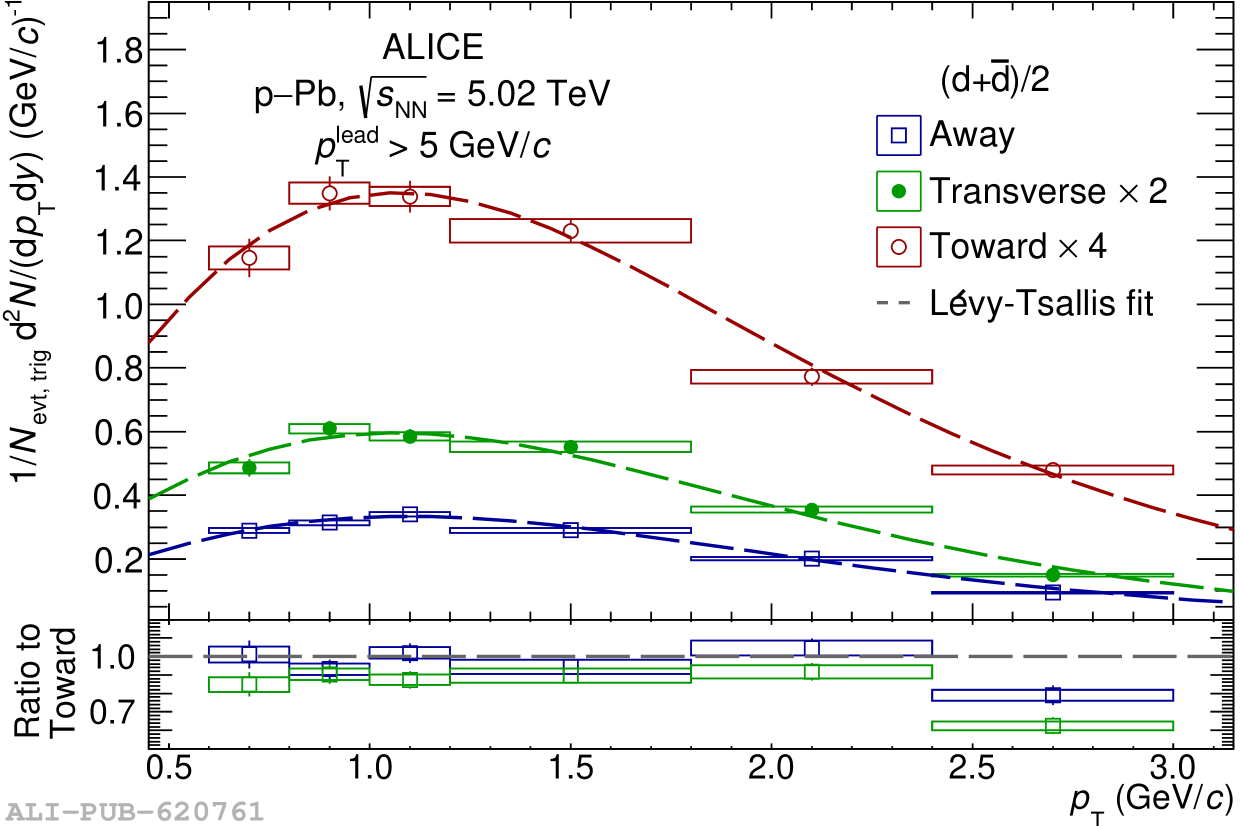 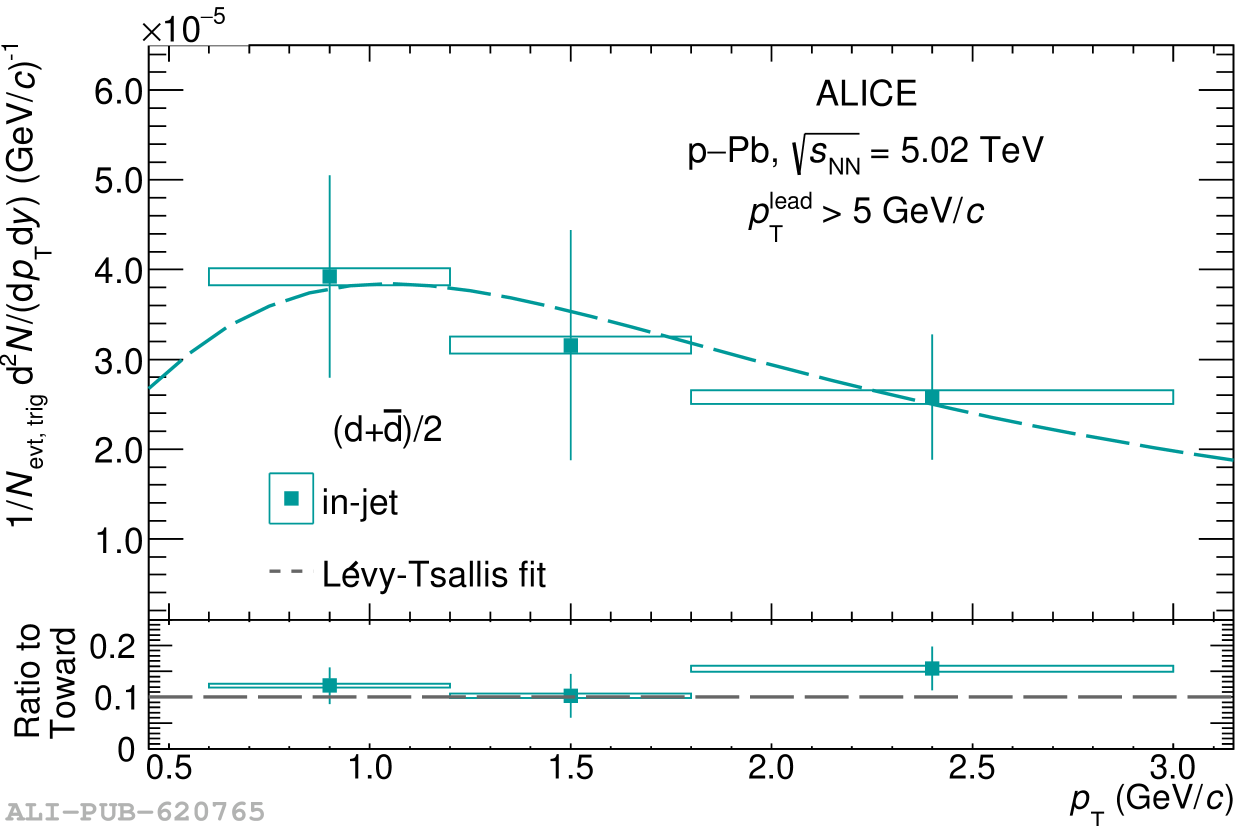 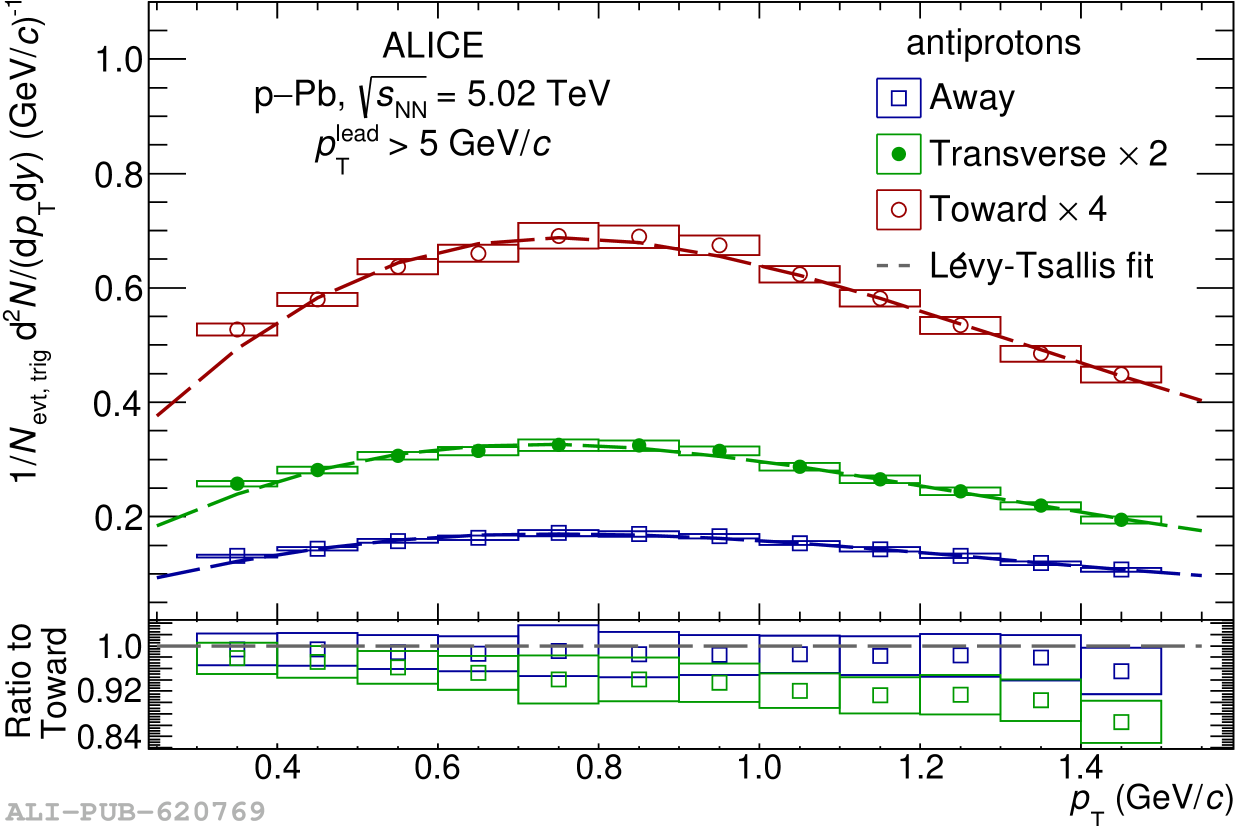 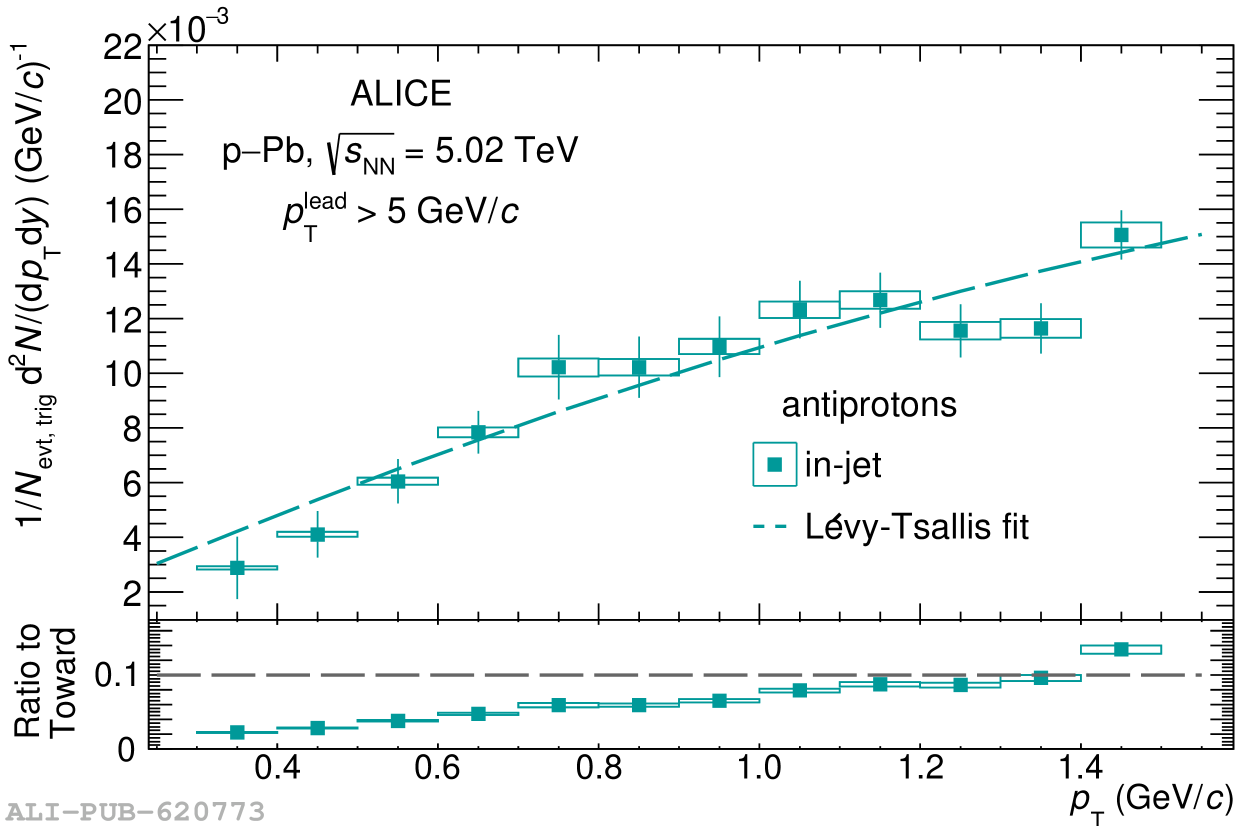 |