Probability distribution of the charged isolation momentum $p_{\rm T }^{\text{iso, ch}}$ (see Eq.(2)) in pp collisions at $\sqrt{s}=8$ TeV. The isolation threshold $p_{\rm T }^{\text{iso, ch}} < 1.5$ GeV/$c$ is drawn as a dashed grey line. The $p_{\rm T }^{\text{iso, ch}}$ distribution is shown for data (black) and PYTHIA 8 simulations for a signal ($\gamma$--jet) and background (jet--jet) dominated population. | 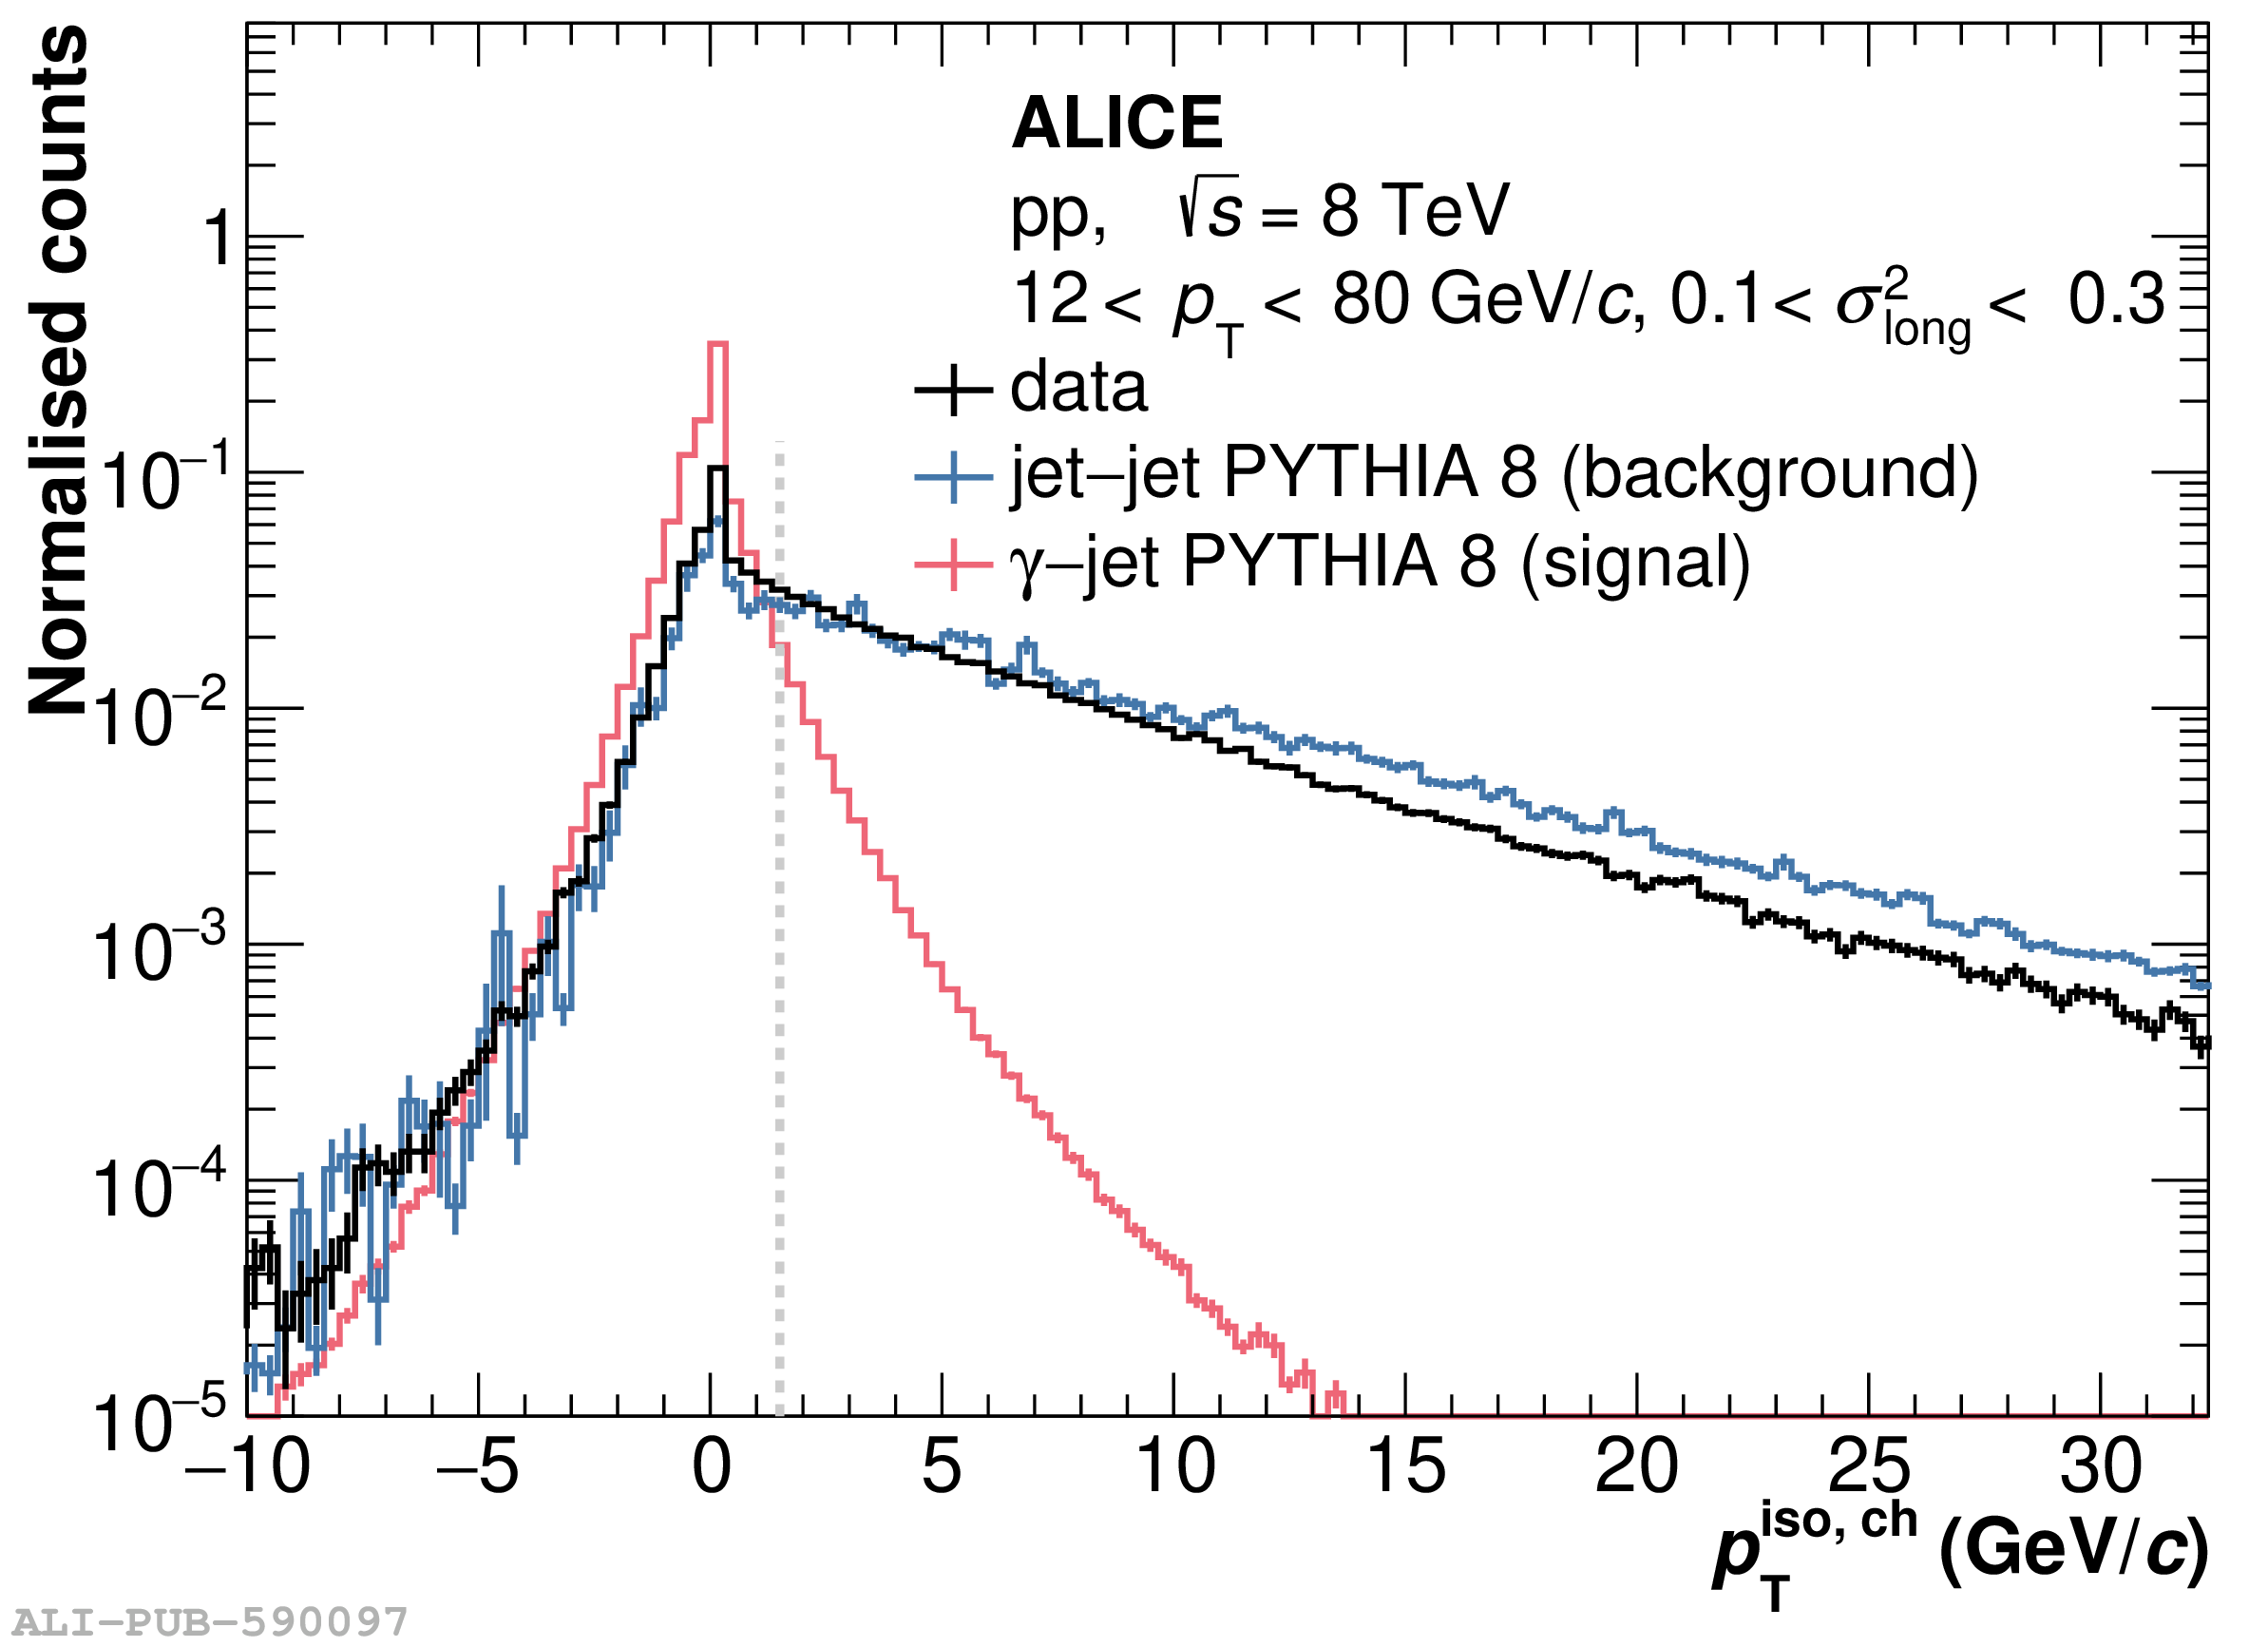 |