Results for $r_2(p_{\rm T}^{\rm a},p_{\rm T}^{\rm b})$ in p--Pb collisions at $\snn$ = 5.02 TeV as a function of transverse momentum for 0--20\% V0A (red points), 20--40\% V0A (blue points) and 40--60\% V0A (green points). Statistical (systematic) uncertainties are represented by vertical bars (filled boxes). Calculations from 3DGlauber+MUSIC+UrQMD are shown as plain bands. The results from AMPT are not shown due to excessively large statistical uncertainties. | 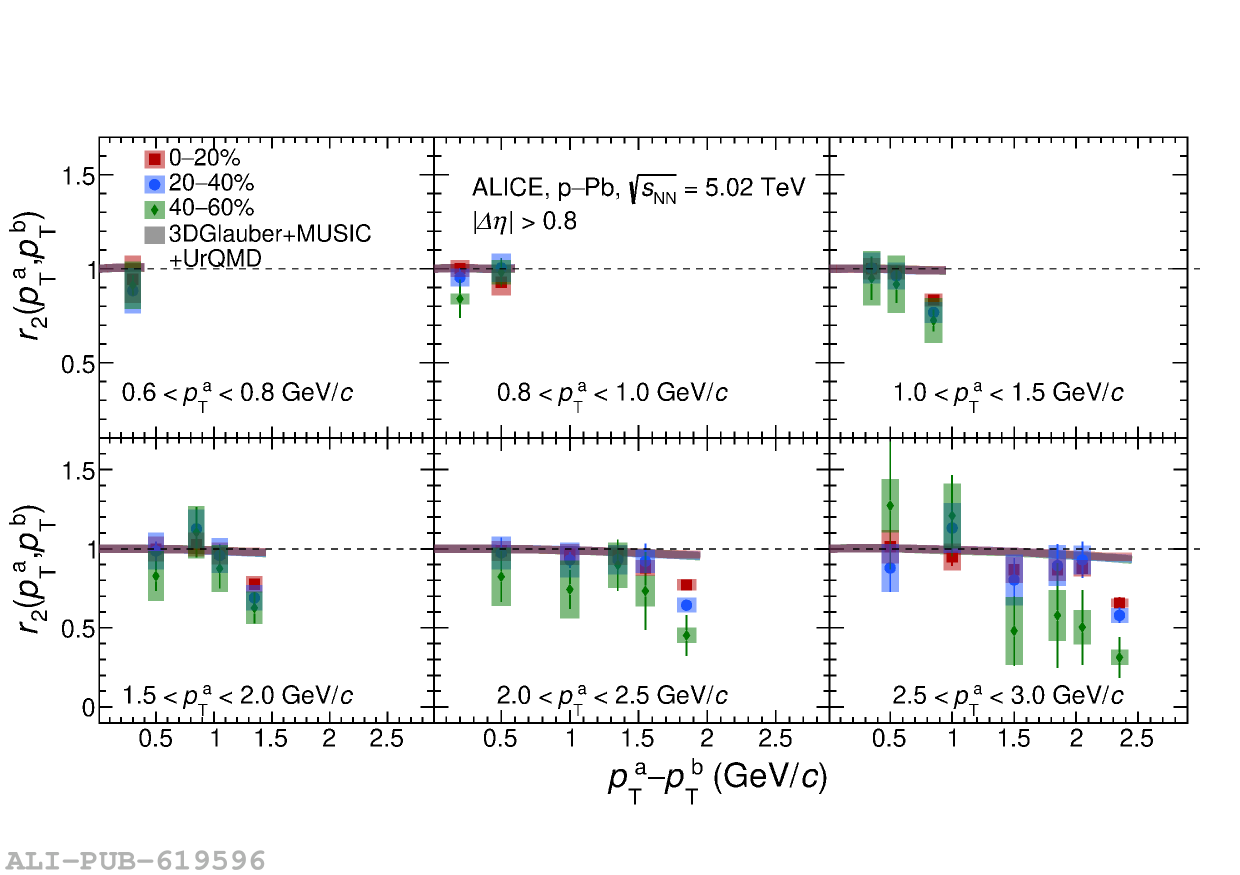 |