$\mathrm{d}N_\mathrm{ch} / \mathrm{d}\eta $ distributions for different multiplicity classes in pp collisions at $\sqrt{s}=13.6$ TeV. The top, third and fifth rows present $\mathrm{d}N_\mathrm{ch} / \mathrm{d}\eta $ distributions from the 0-1% to the 70-100% multiplicity classes, and the other rows display the model-to-data ratios of the rows above. The distributions are compared with theoretical predictions from PYTHIA 8 and EPOS4 with their variations. Note that the multiplicity classes in the models correspond to INEL>0, and multiplicity classes in the data correspond to MB>0 classification as listed in Tab.2. | 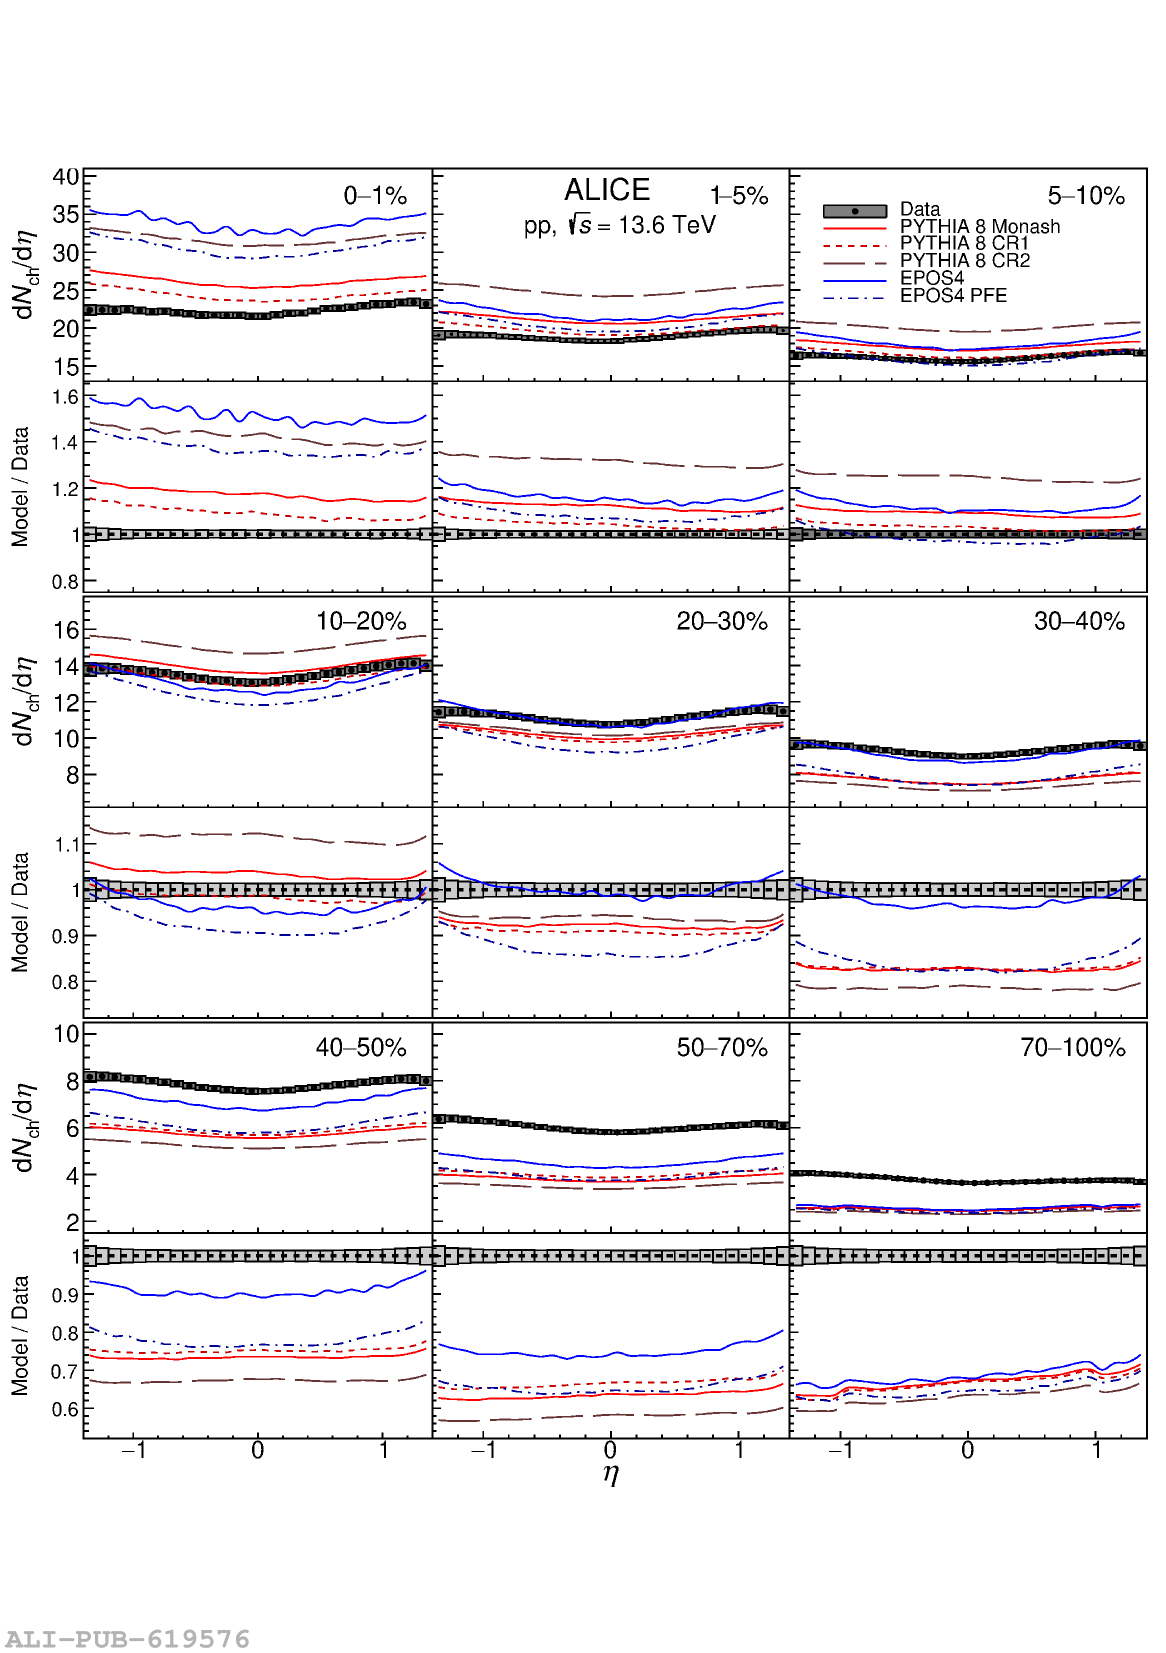 |