$R_\mathrm{long}^2$ fitted with Eq.(10) for eight centrality classes: 0-5%, 5-10%, 10-20%, 20-30%, 30-40%, 40-50%, 50-70%, and 70-90%. Statistical uncertainties are shown as bars and systematic uncertainties are depicted as boxes. The width of the bands represents the uncertainties of the power-law fit. | 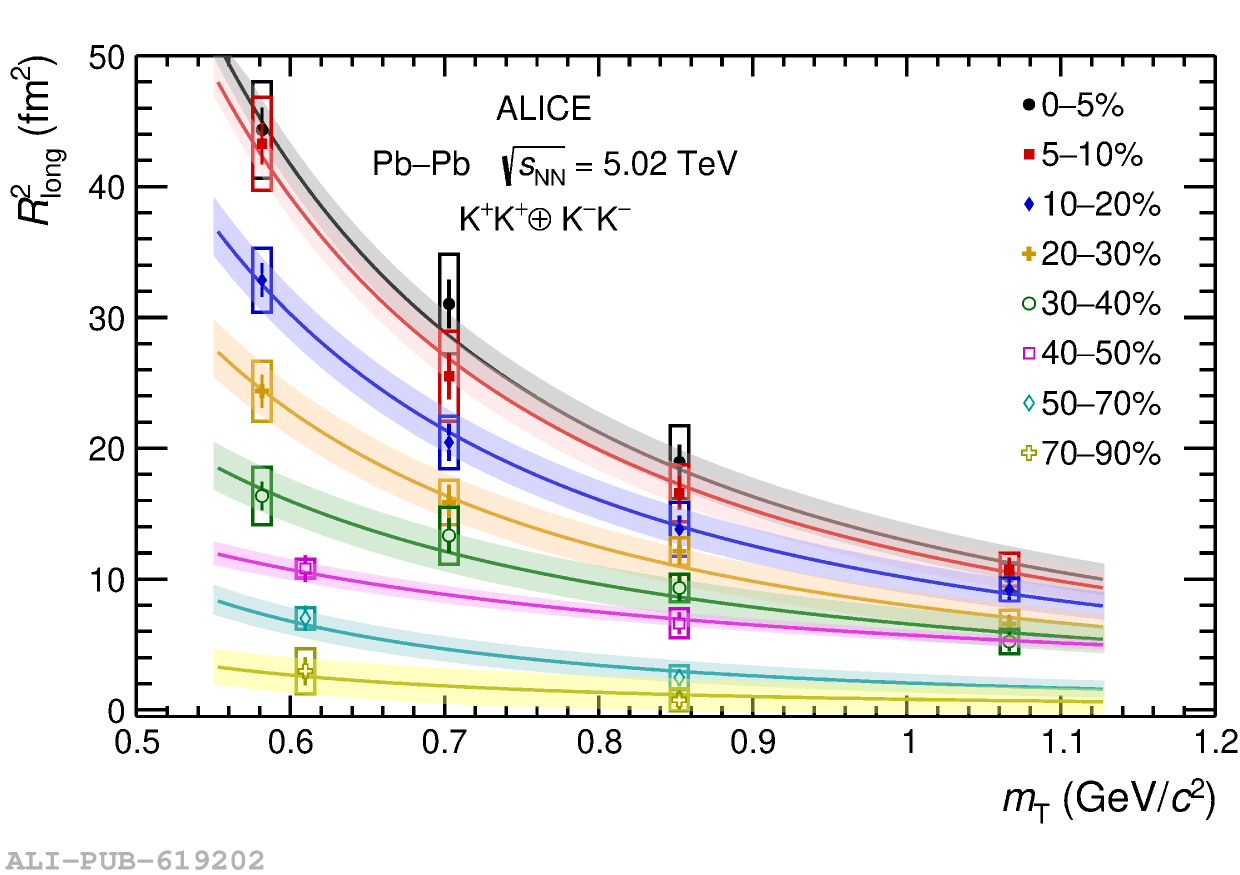 |