Experimental 3D radii (markers) as a function of the pair transverse momentum $k_\mathrm{T}$ compared with iHKM calculations (lines) for the 0-5%, 20-30%, and 40-50% centrality classes. Statistical uncertainties of the experimental points are shown with bars and systematic uncertainties are depicted with boxes. The solid line presents the calculations with the particlization temperature $T_{\rm p}=165$ MeV and the dotted line corresponds to the temperature $T_{\rm p}=156$ MeV. | 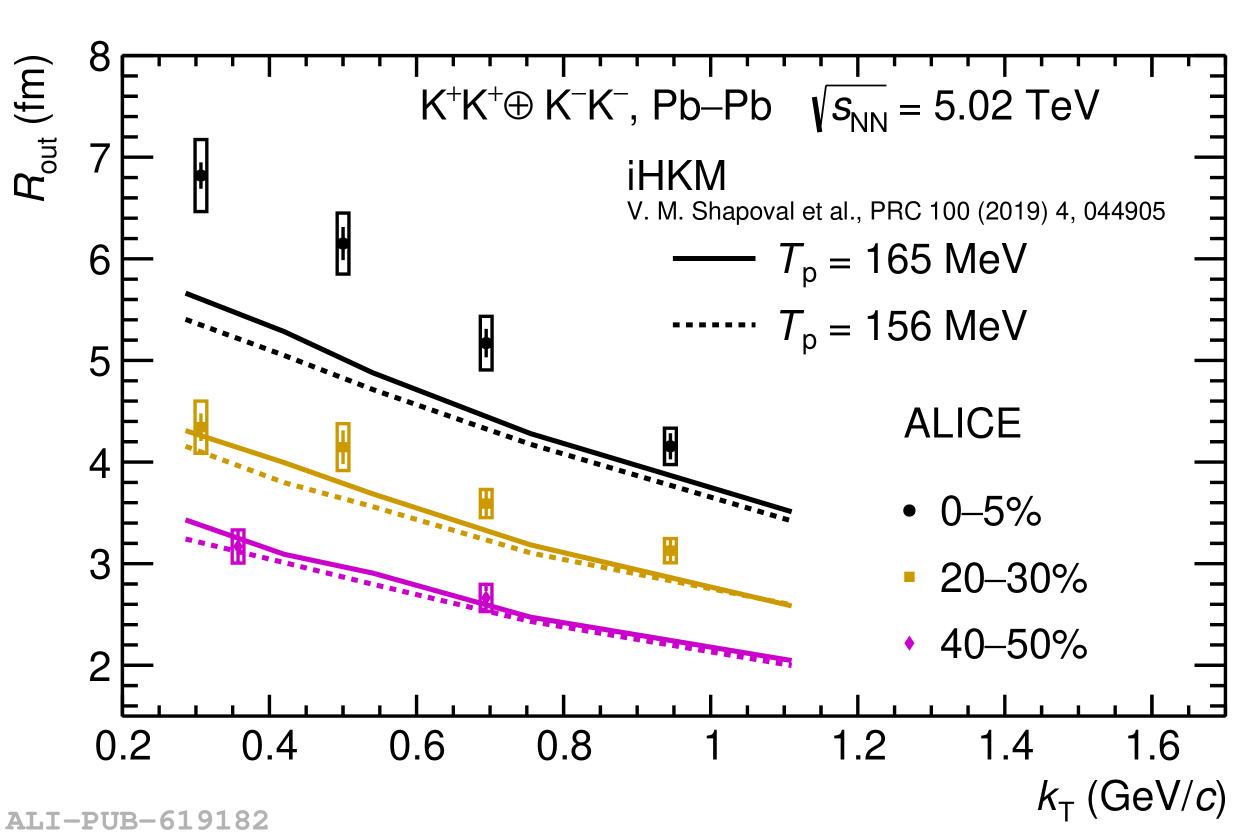 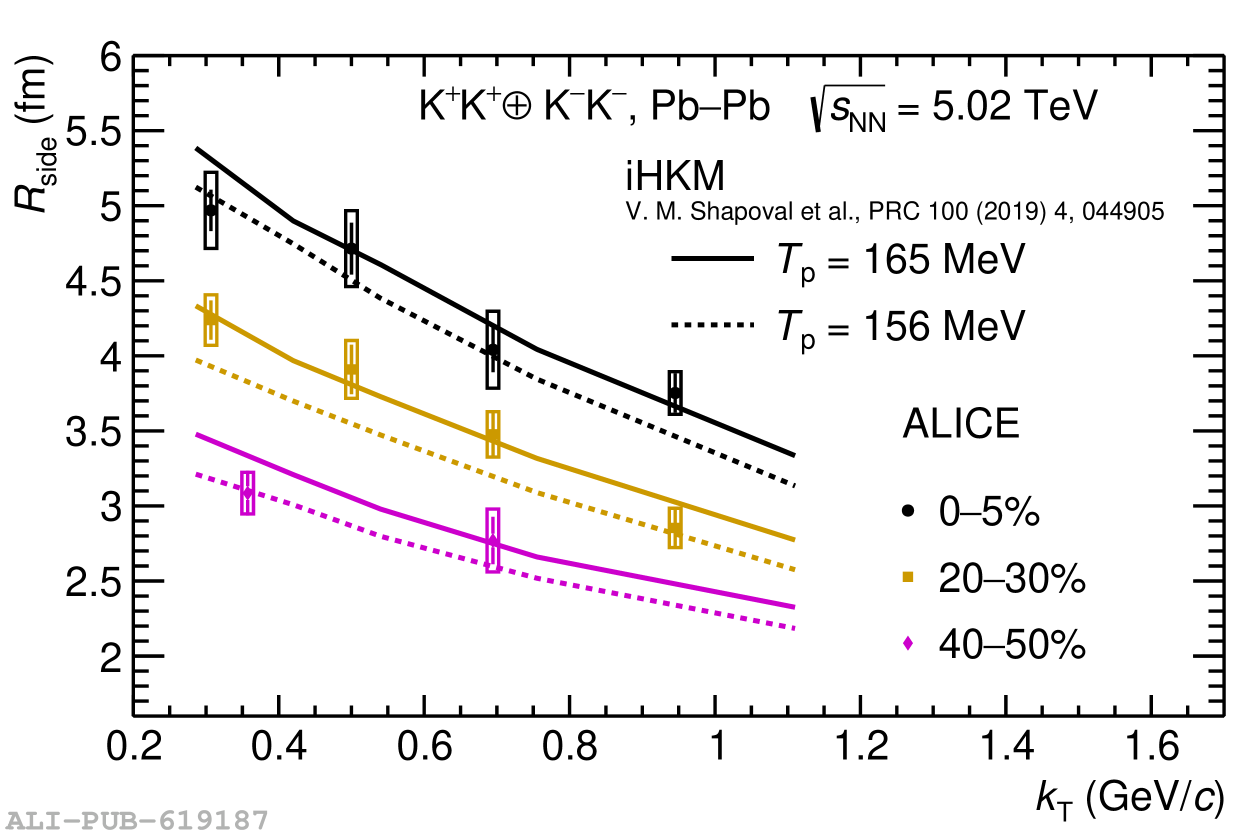 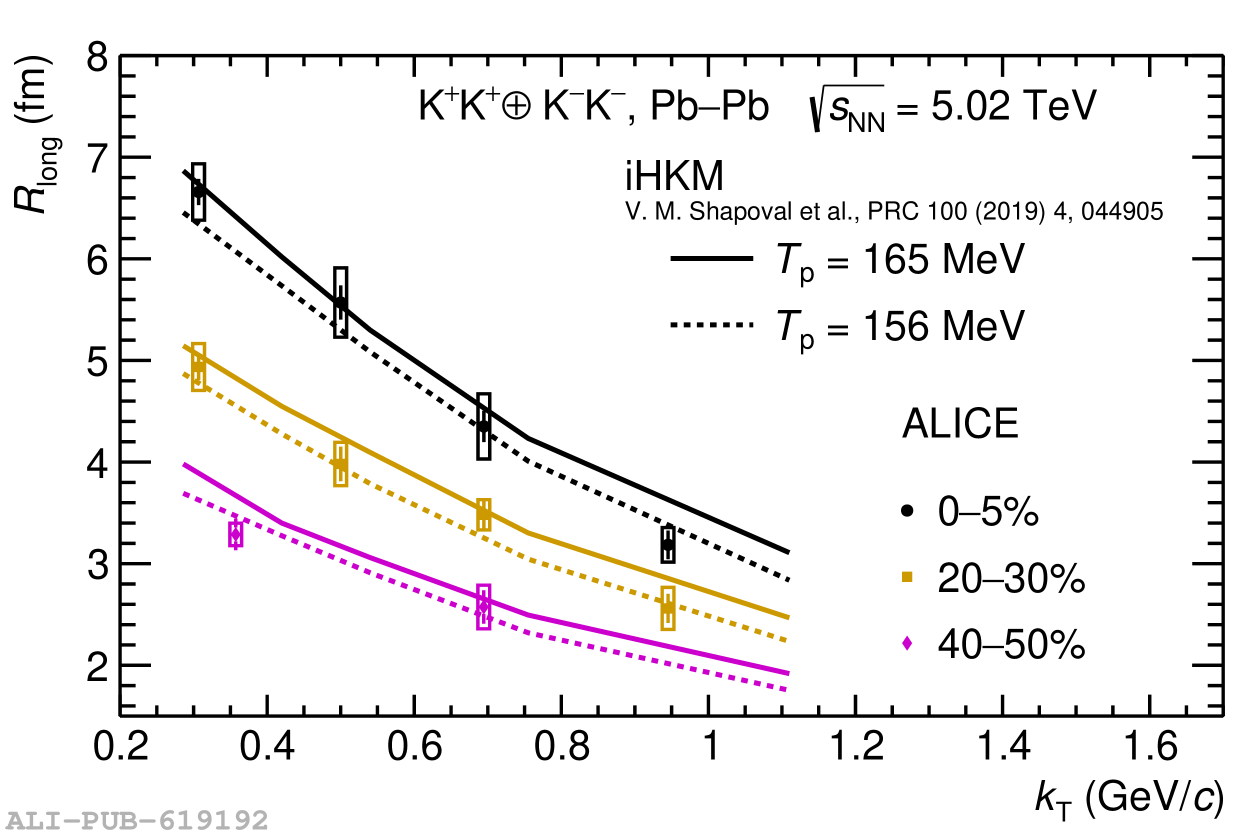 |