A central question in strong-interaction physics, governed by quantum chromodynamics (QCD), is whether femto-scale droplets of quark$-$gluon plasma (QGP) form in small collision systems involving projectiles significantly smaller than heavy ions. Collisions of light ions such as $^{16}$O and $^{20}$Ne offer a unique opportunity to probe the emergence of collective behavior in QCD matter. This Letter presents the first measurements of elliptic ($v_2$) and triangular ($v_3$) flow of charged particles in $^{16}$O$-$$^{16}$O and $^{20}$Ne$-$$^{20}$Ne collisions at a center-of-mass energy per nucleon pair of $\sqrt{s_{_{\rm NN}}} = 5.36$ TeV with the ALICE detector. The hydrodynamic model predictions, explicitly incorporating the nuclear structures of $^{16}$O and $^{20}$Ne, exhibit a good agreement with the flow measurements presented. The observed increase of $v_2$ in central Ne$-$Ne collisions relative to OO collisions, driven by the nuclear geometries, highlights the importance of utilizing light nuclei with well-defined geometric shapes to constrain the initial conditions. These findings support the presence of nuclear geometry-driven hydrodynamic flow in light-ion collisions at the LHC.
Accepted by: PRL
HEP Data
e-Print: arXiv:2509.06428 | PDF | inSPIRE
CERN-EP-2025-203
Figure group
Figure 1
Charged particle $v_2\{2\}$, $v_3\{2\}$, and $v_2\{4\}$ as a function of centrality in \OO (solid markers) and \NeNe (open markers) collisions at $\sqrt{s_{_\mathrm{NN}}}$ = 5.36 TeV. The vertical lines represent statistical uncertainties, and the open boxes represent systematic uncertainties, with most of them being smaller than the symbol size. | 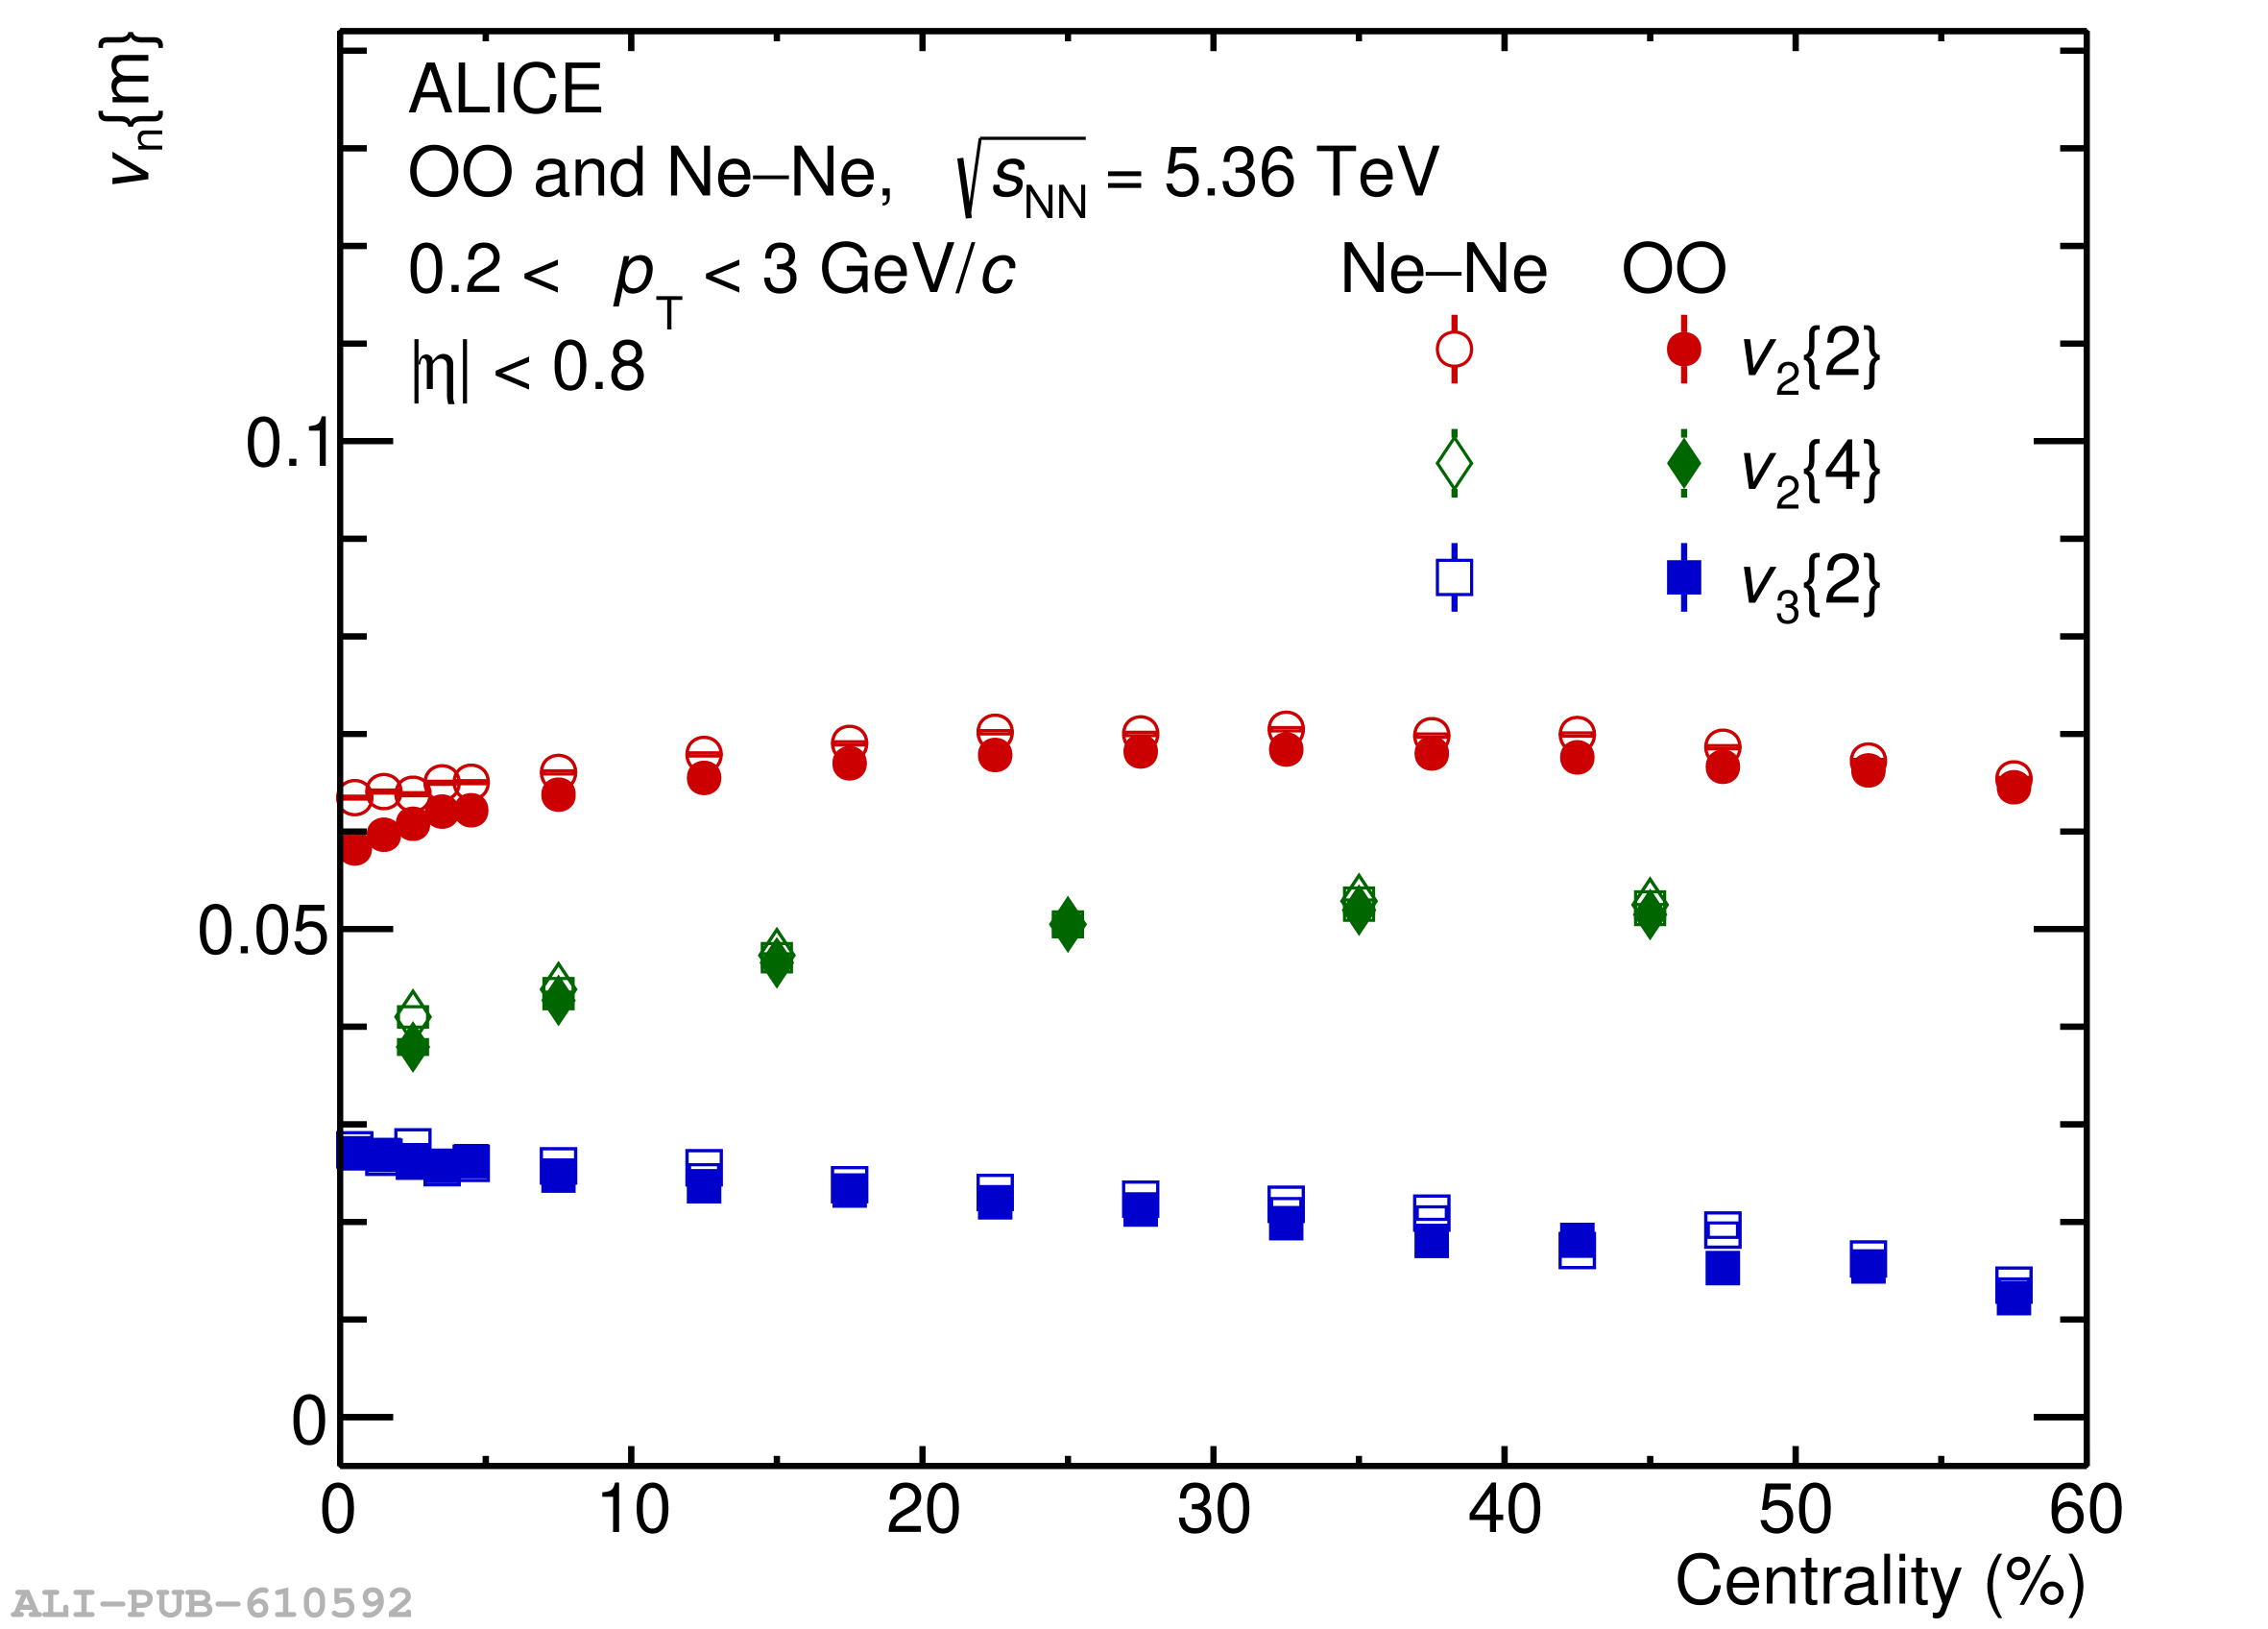 |
Figure 2
Charged particle $v_2\{2\}$, $v_3\{2\}$, and $v_2\{4\}$ as a function of centrality in \OO (left) and \NeNe (right) collisions at $\sqrt{s_{_\mathrm{NN}}}$ = 5.36 TeV. The vertical lines represent statistical uncertainties, and the open boxes represent systematic uncertainties, with most of them being smaller than the symbol size. The measurements are compared with Trajectum calculations with NLEFT and PGCM inputs . | 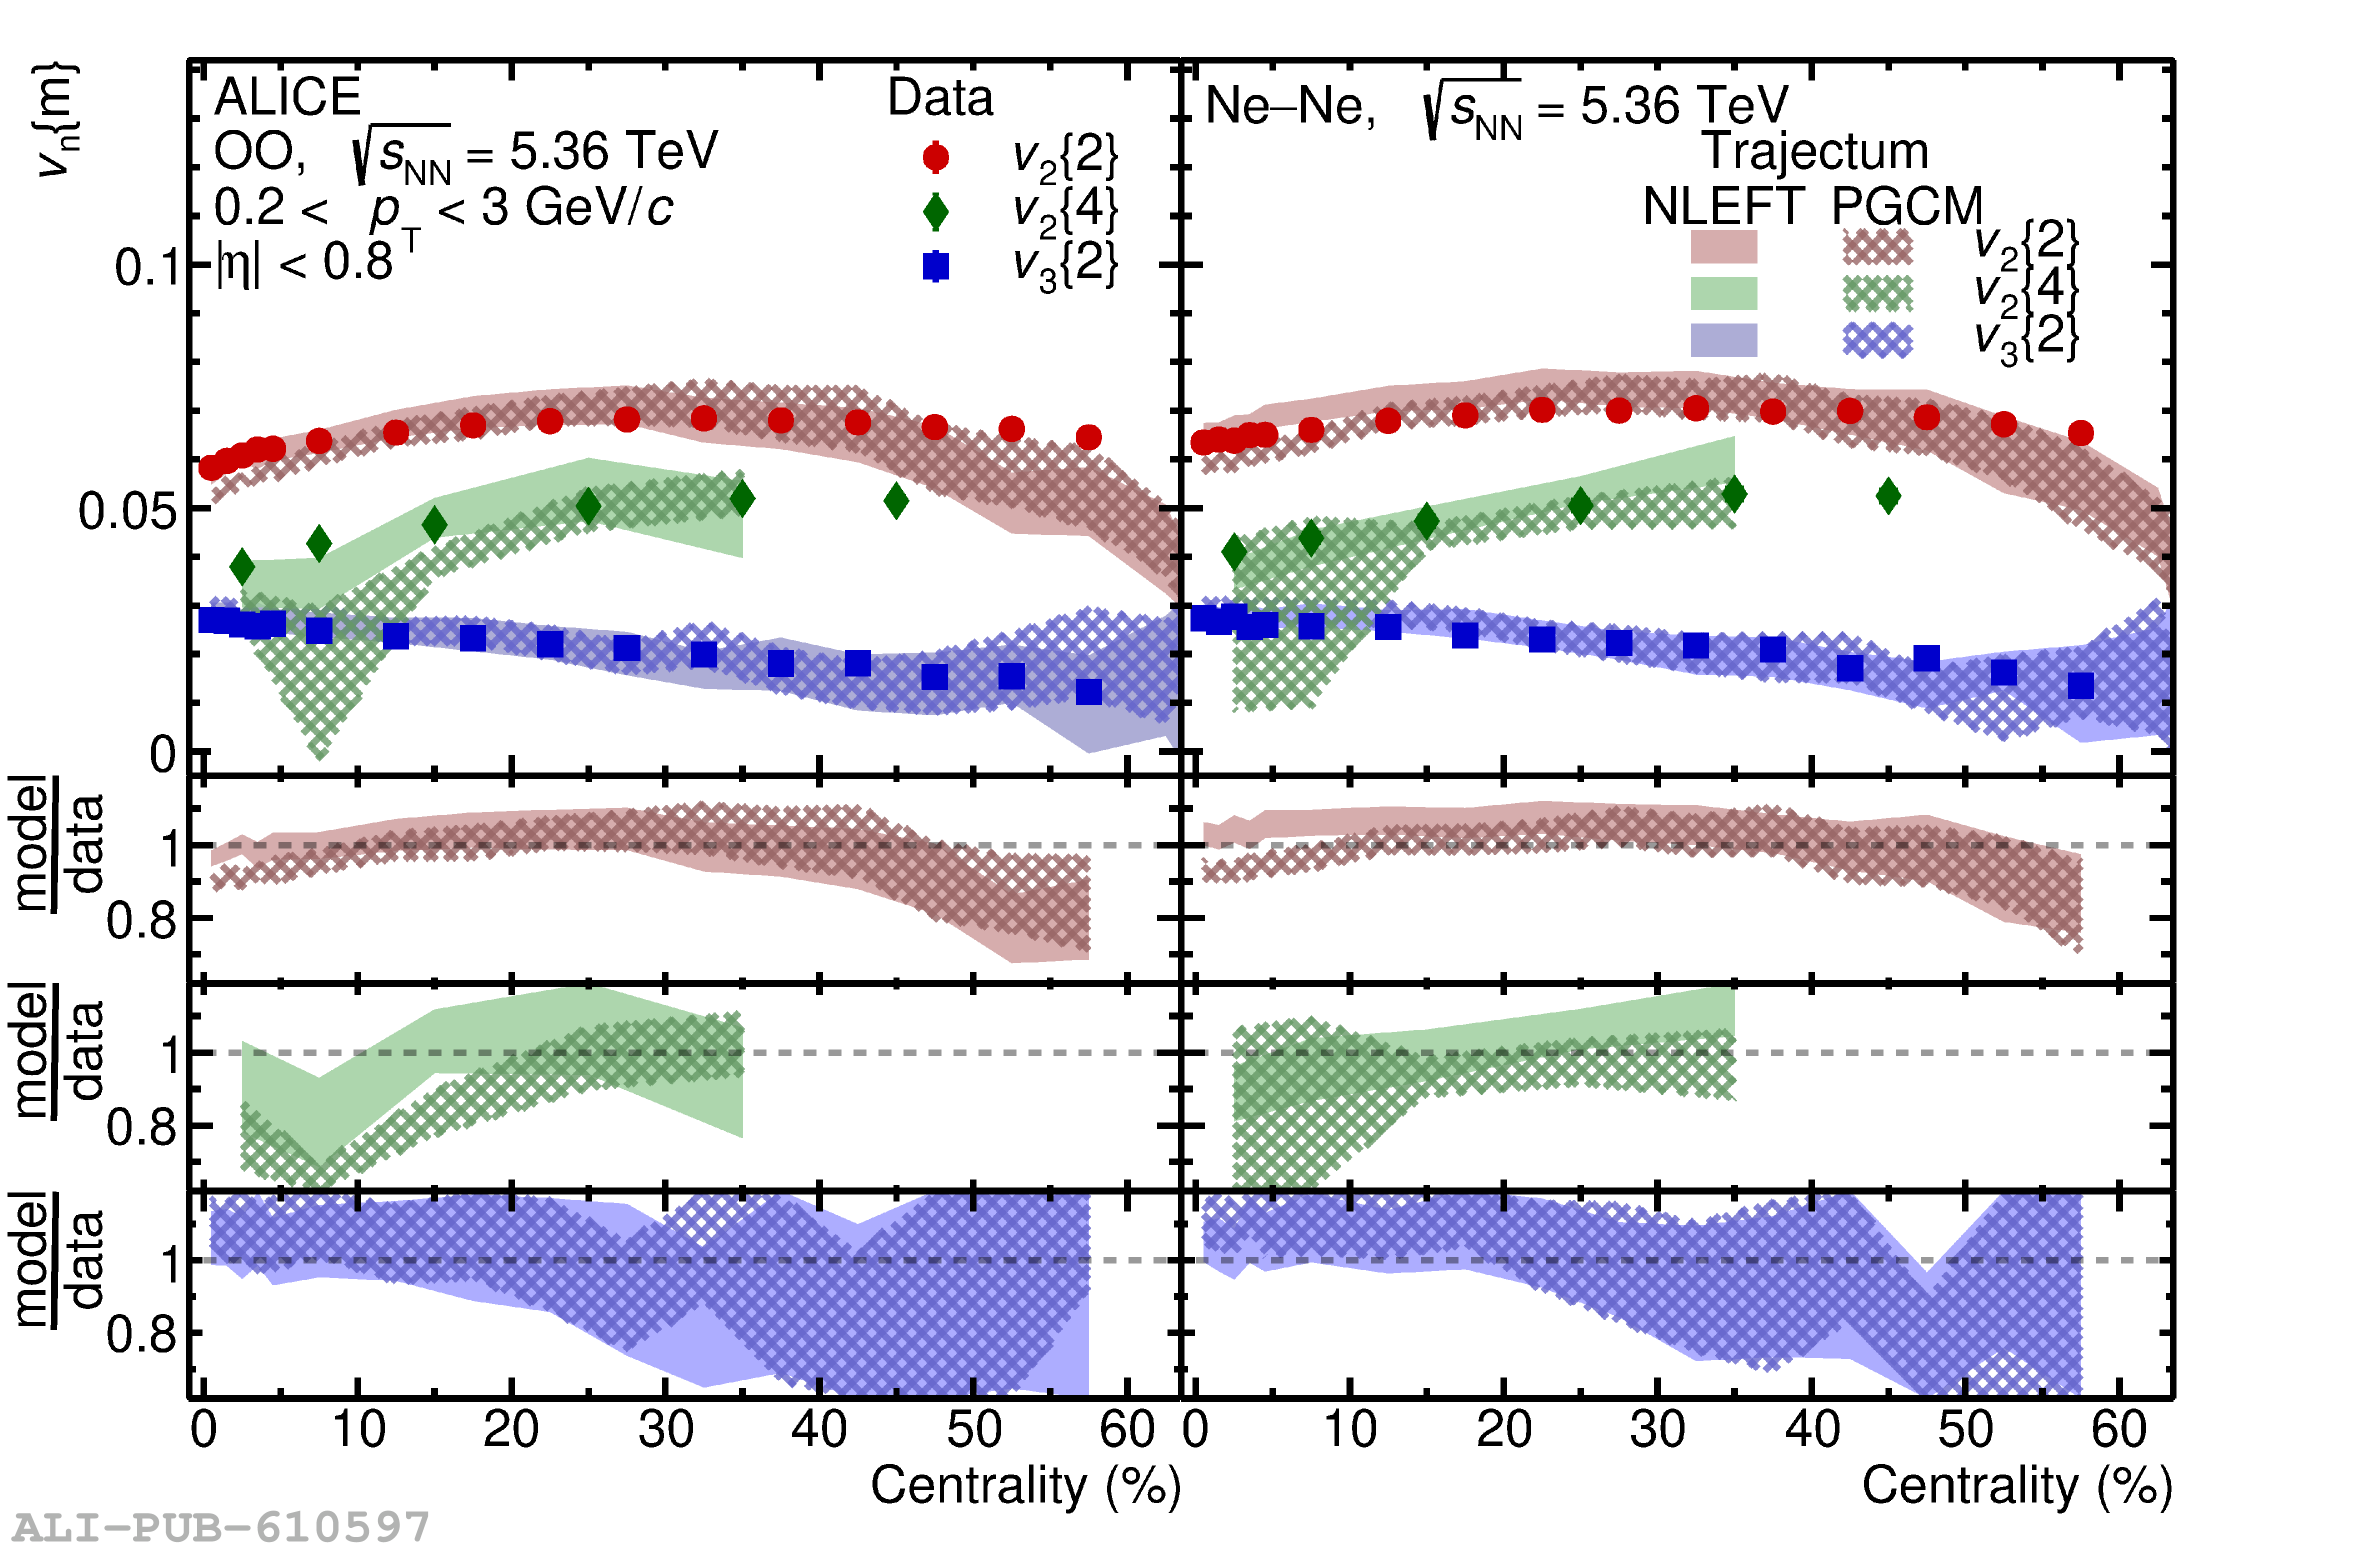 |
Figure 3
Ratios $v_2$(Ne--Ne/OO) and $v_3$(Ne--Ne/OO) as a function of centrality in the 0–30\% centrality range. The vertical lines represent statistical uncertainties and the open boxes represent the systematic uncertainties, while most of them are smaller than the symbol size. The measurements are compared with Trajectum calculations with NLEFT and PGCM inputs as well as IP-Glasma+JIMWLK+MUSIC+UrQMD and 3DGlauber+MUSIC+UrQMD calculations with PGCM input. | 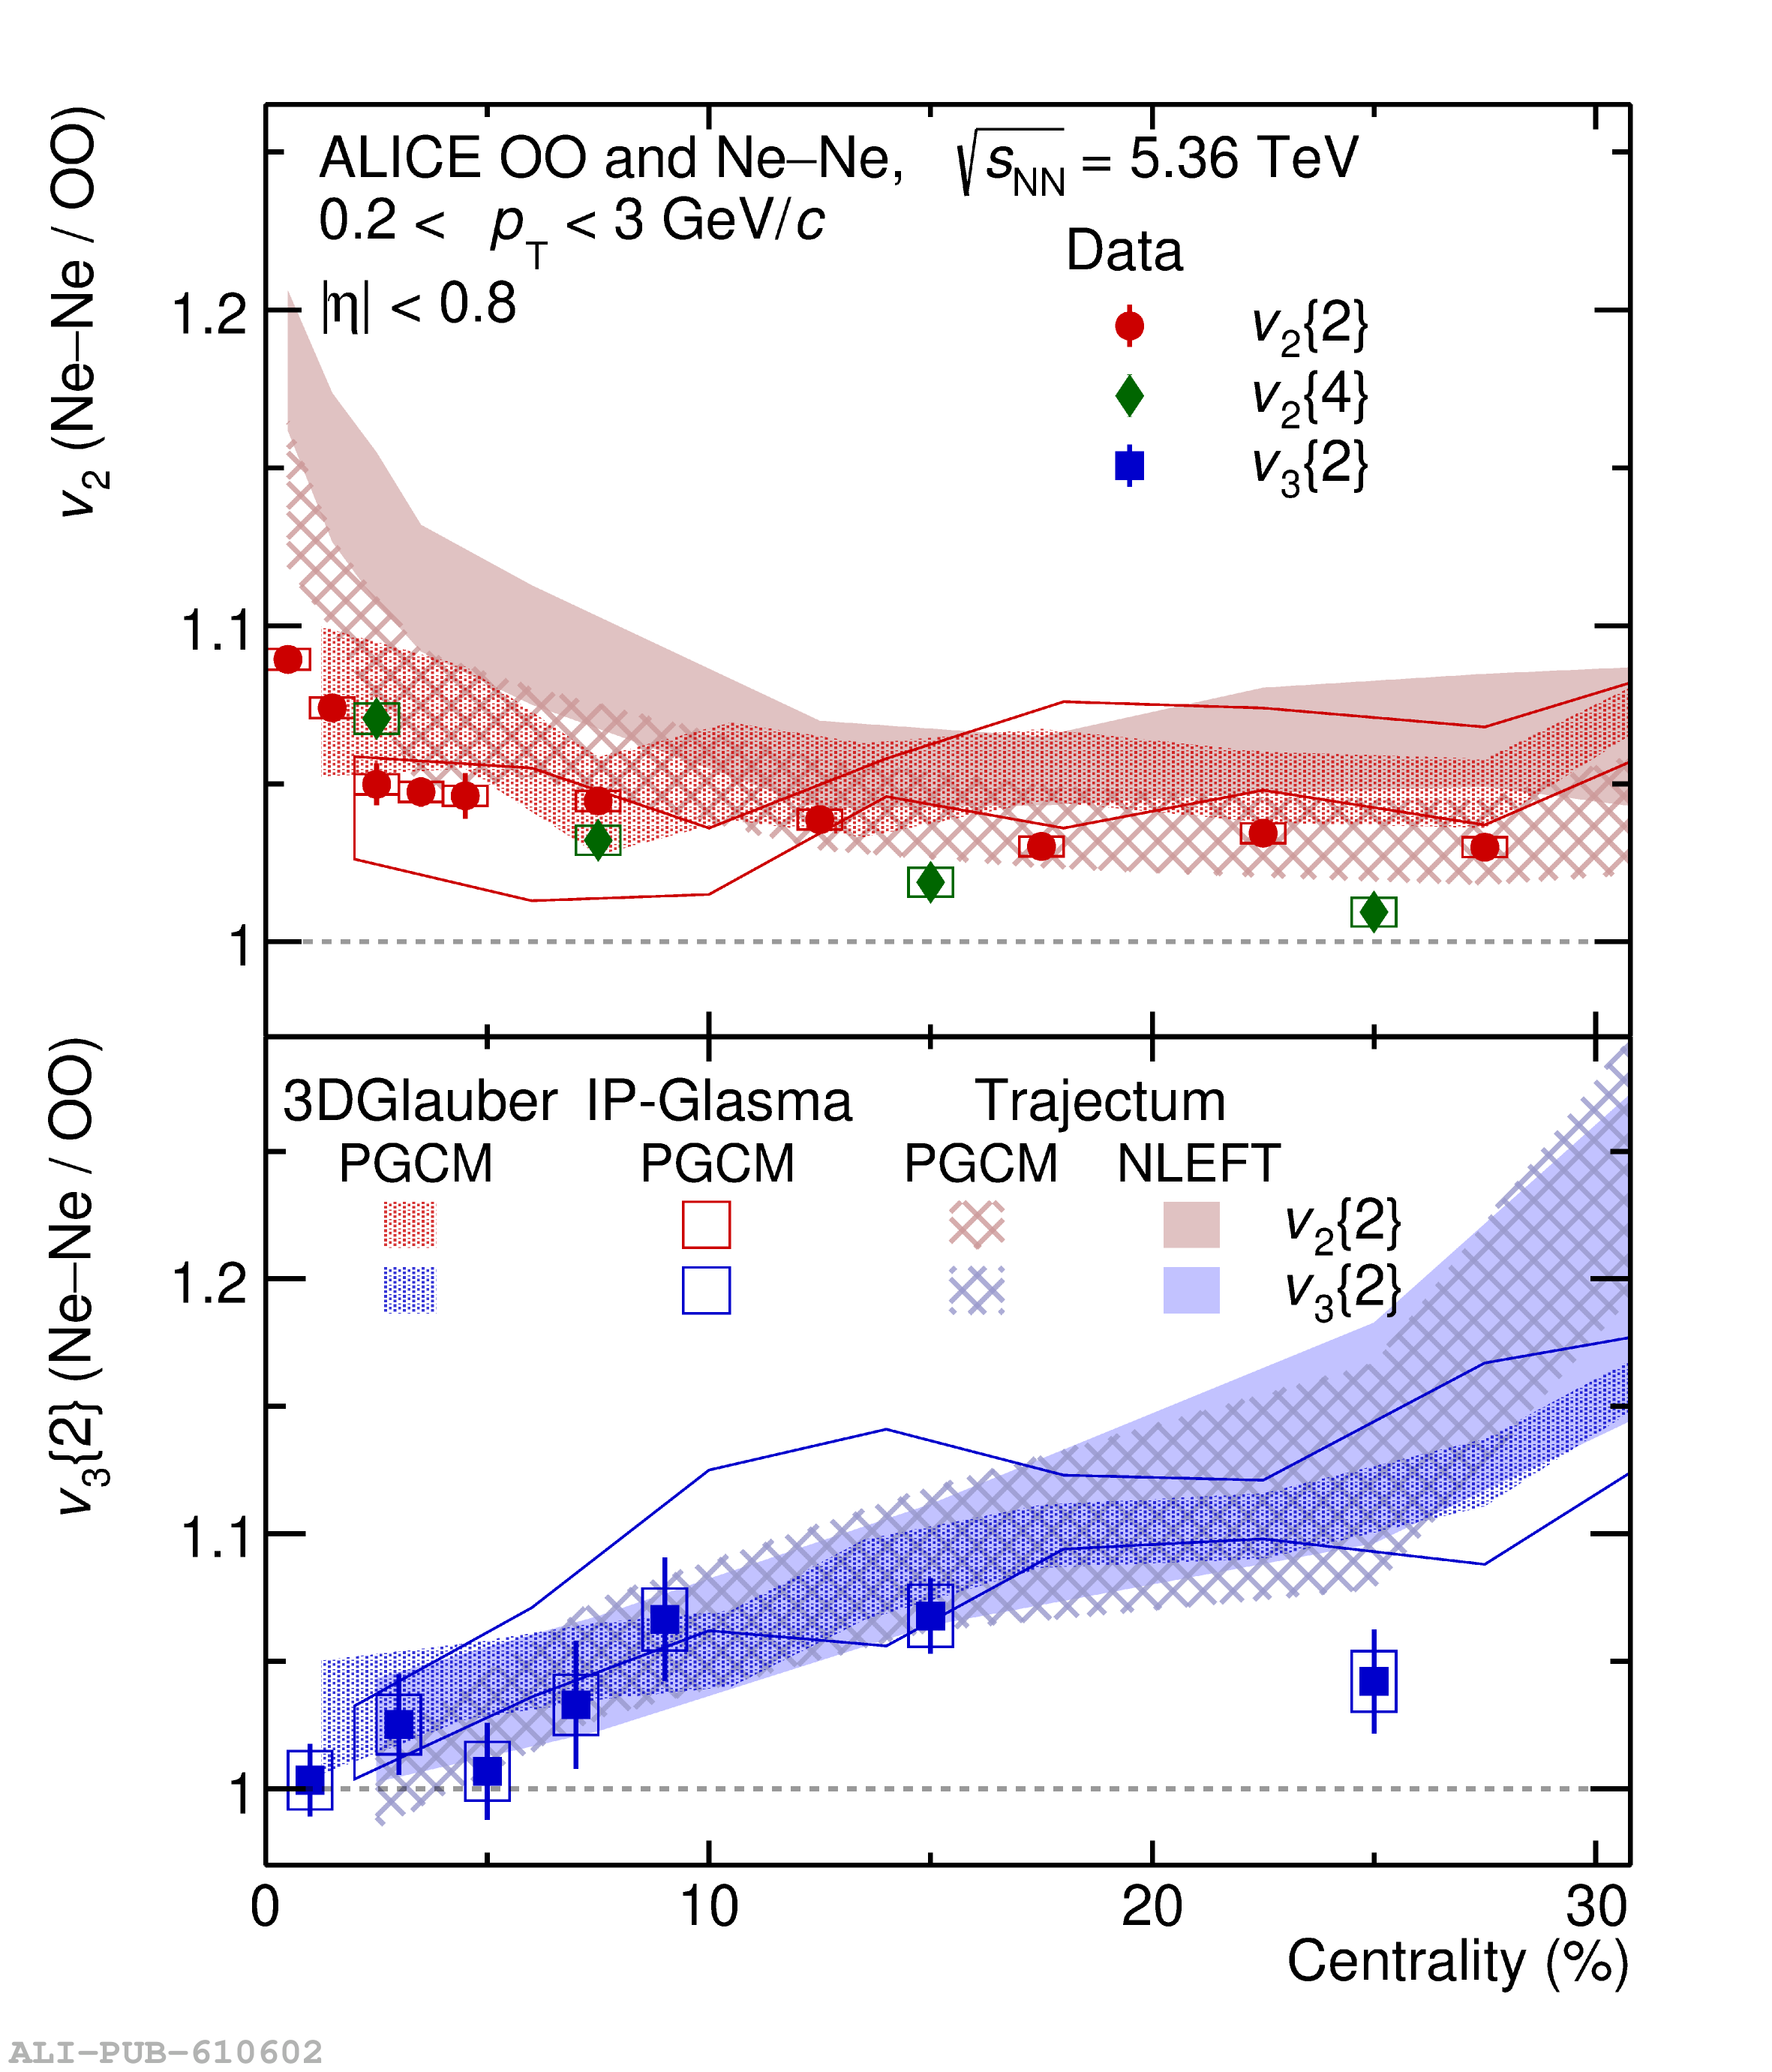 |
Figure A.1
(top): Ratio of the charged particle $v_3\{2\}$ to $v_2\{2\}$ as a function of centrality in OO and Ne--Ne collisions at $\sqrt{s_{_\mathrm{NN}}}$ = 5.36 TeV (bottom): Double ratios $v_3\{2\} / v_2\{2\}$(Ne--Ne/OO). The vertical lines represent statistical uncertainties and the open boxes represent the systematic uncertainties while most of them are smaller than symbol size. The measurements are compared with Trajectum calculations with NLEFT and PGCM inputs . |  |
Figure A.2
(top): Ratio of the charged particle $v_2\{4\}$ to $v_2\{2\}$ as a function of centrality in OO and Ne--Ne collisions at $\sqrt{s_{_\mathrm{NN}}}$ = 5.36 TeV (bottom): Double ratios $v_2\{4\} / v_2\{2\}$(Ne--Ne/OO). The vertical lines represent statistical uncertainties and the open boxes represent the systematic uncertainties while most of them are smaller than symbol size. The measurements are compared to Trajectum calculations with NLEFT and PGCM inputs . | 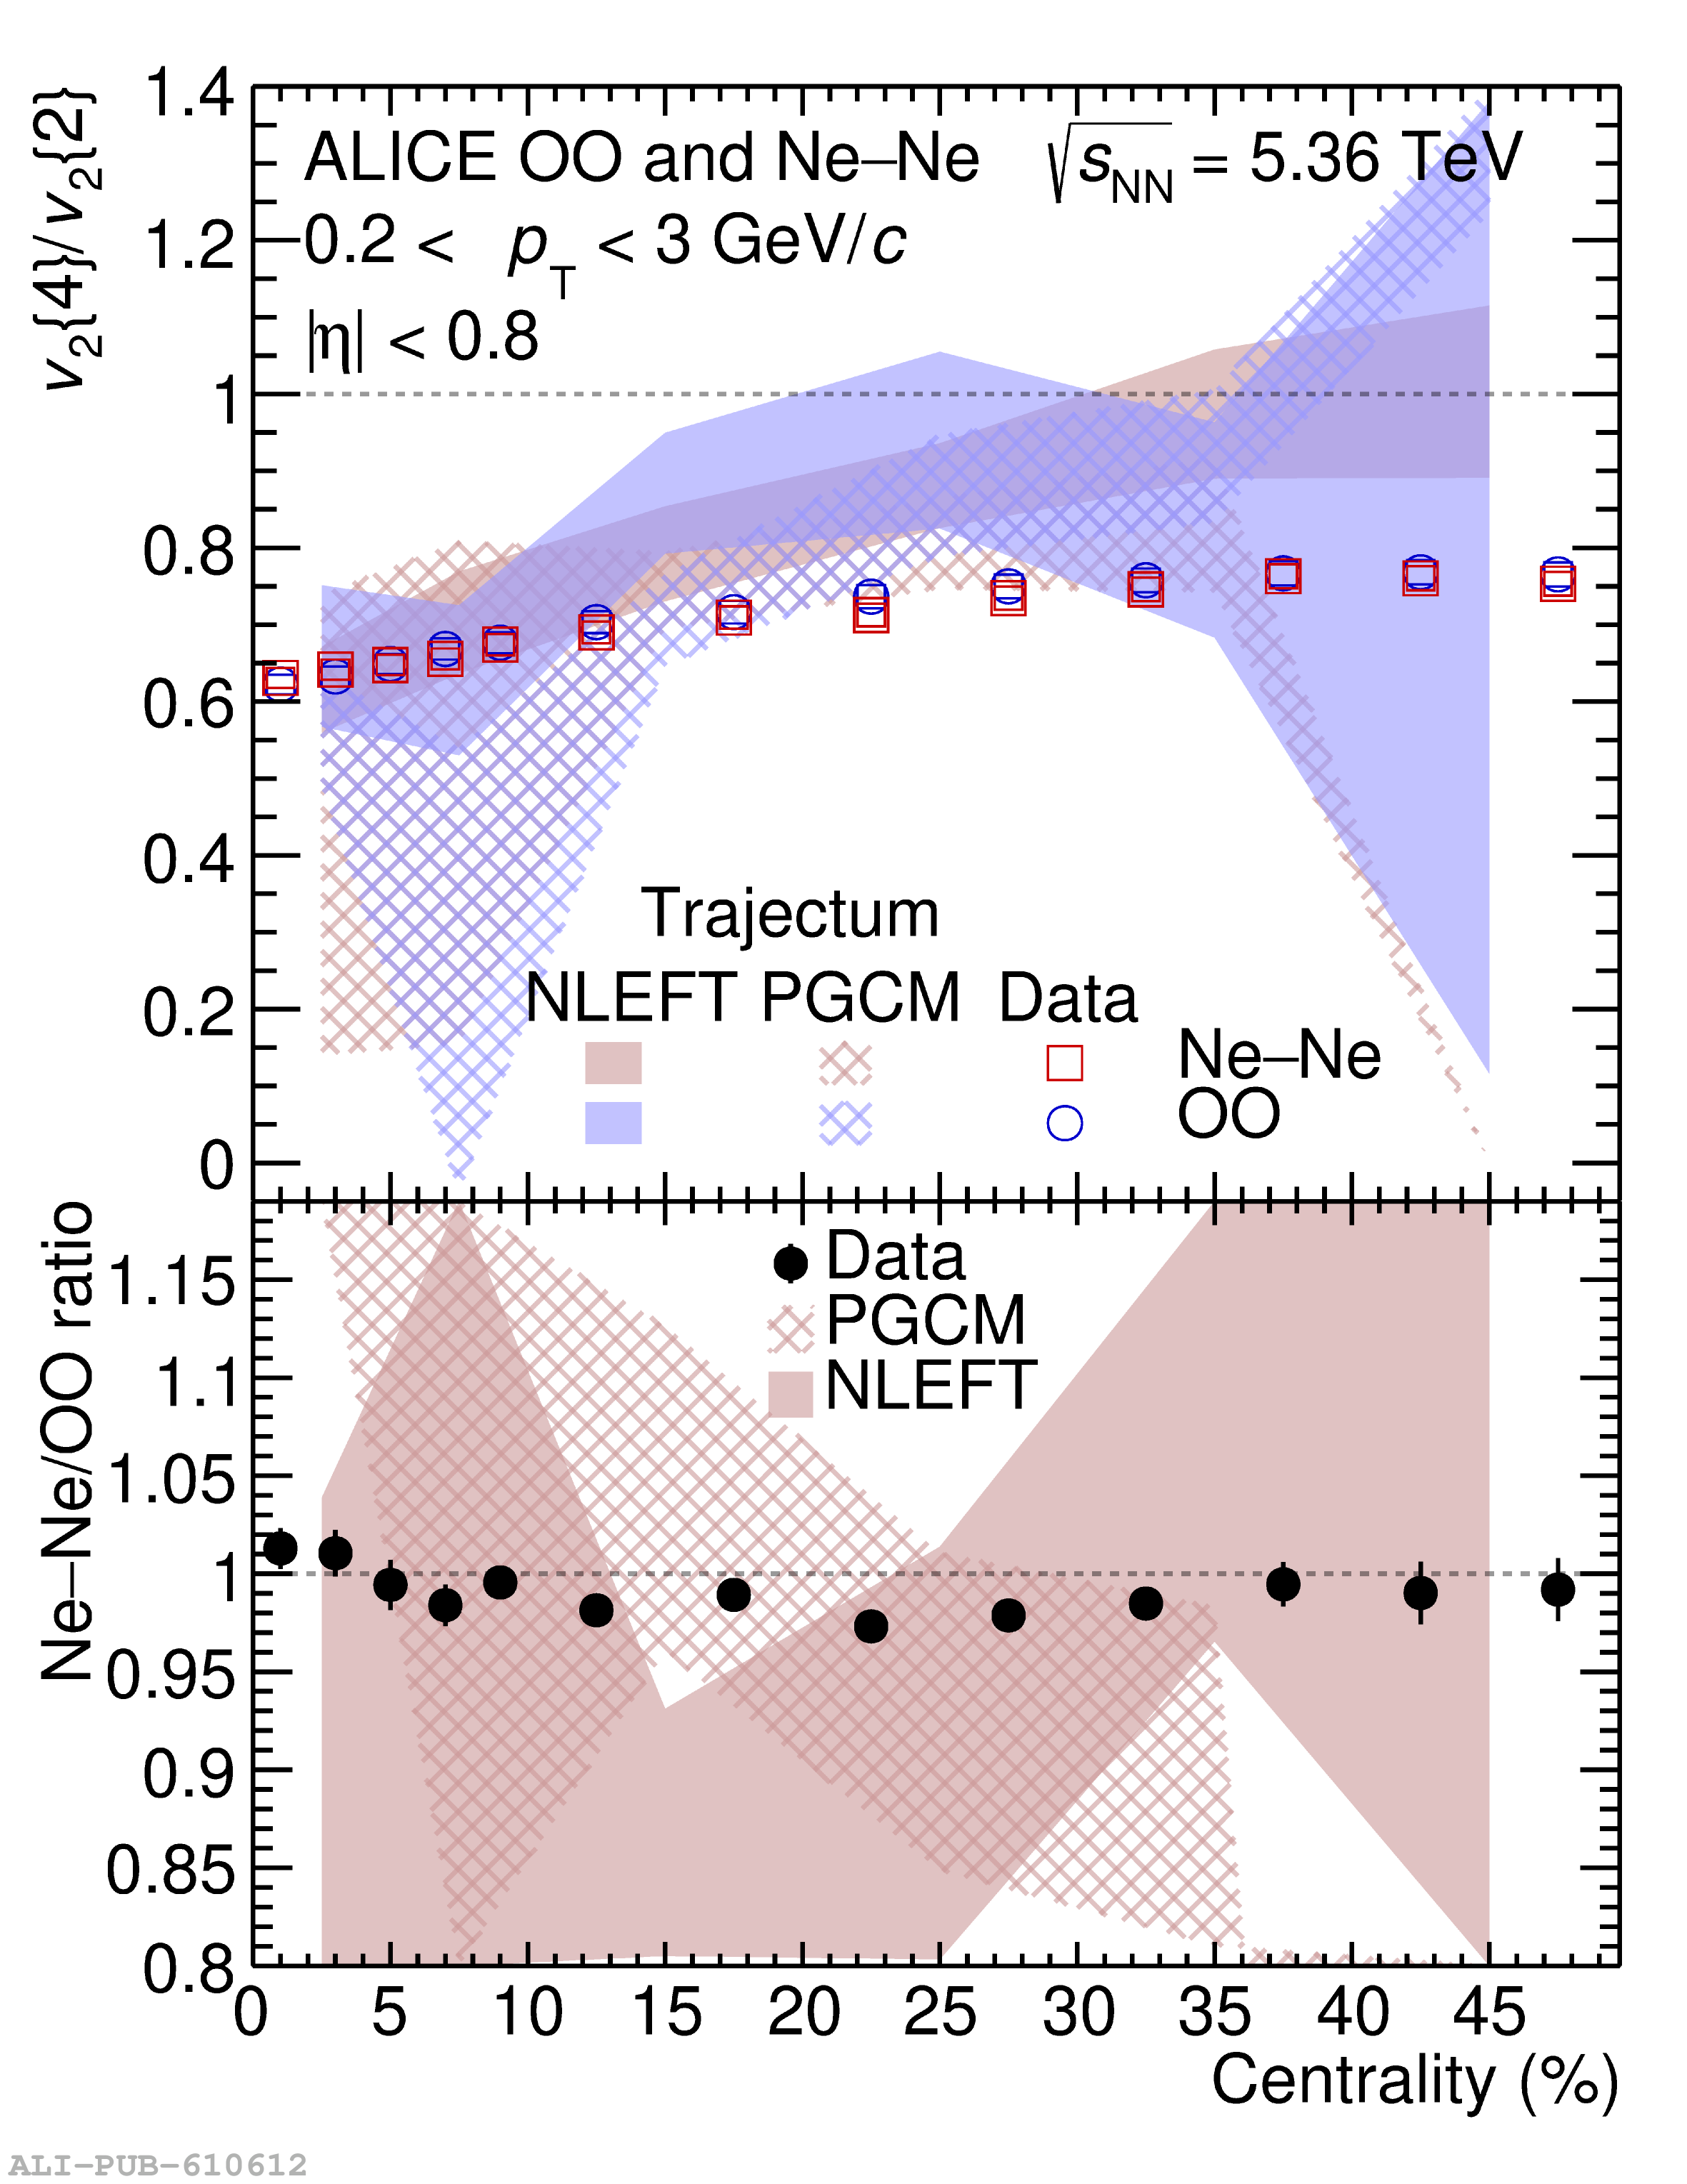 |
Figure A.3
Charged particle $v_2\{2\}$ and $v_3\{2\}$ as a function of centrality in \OO (left) and \NeNe (right) collisions. The data points are the same as those in Fig. \ref{fig:vnNeNeOO}. The measurements are compared with IP-Glasma+JIMWLK+MUSIC+UrQMD and 3DGlauber+MUSIC+UrQMD calculations with PGCM input, as well as AMPT with NLEFT input. | 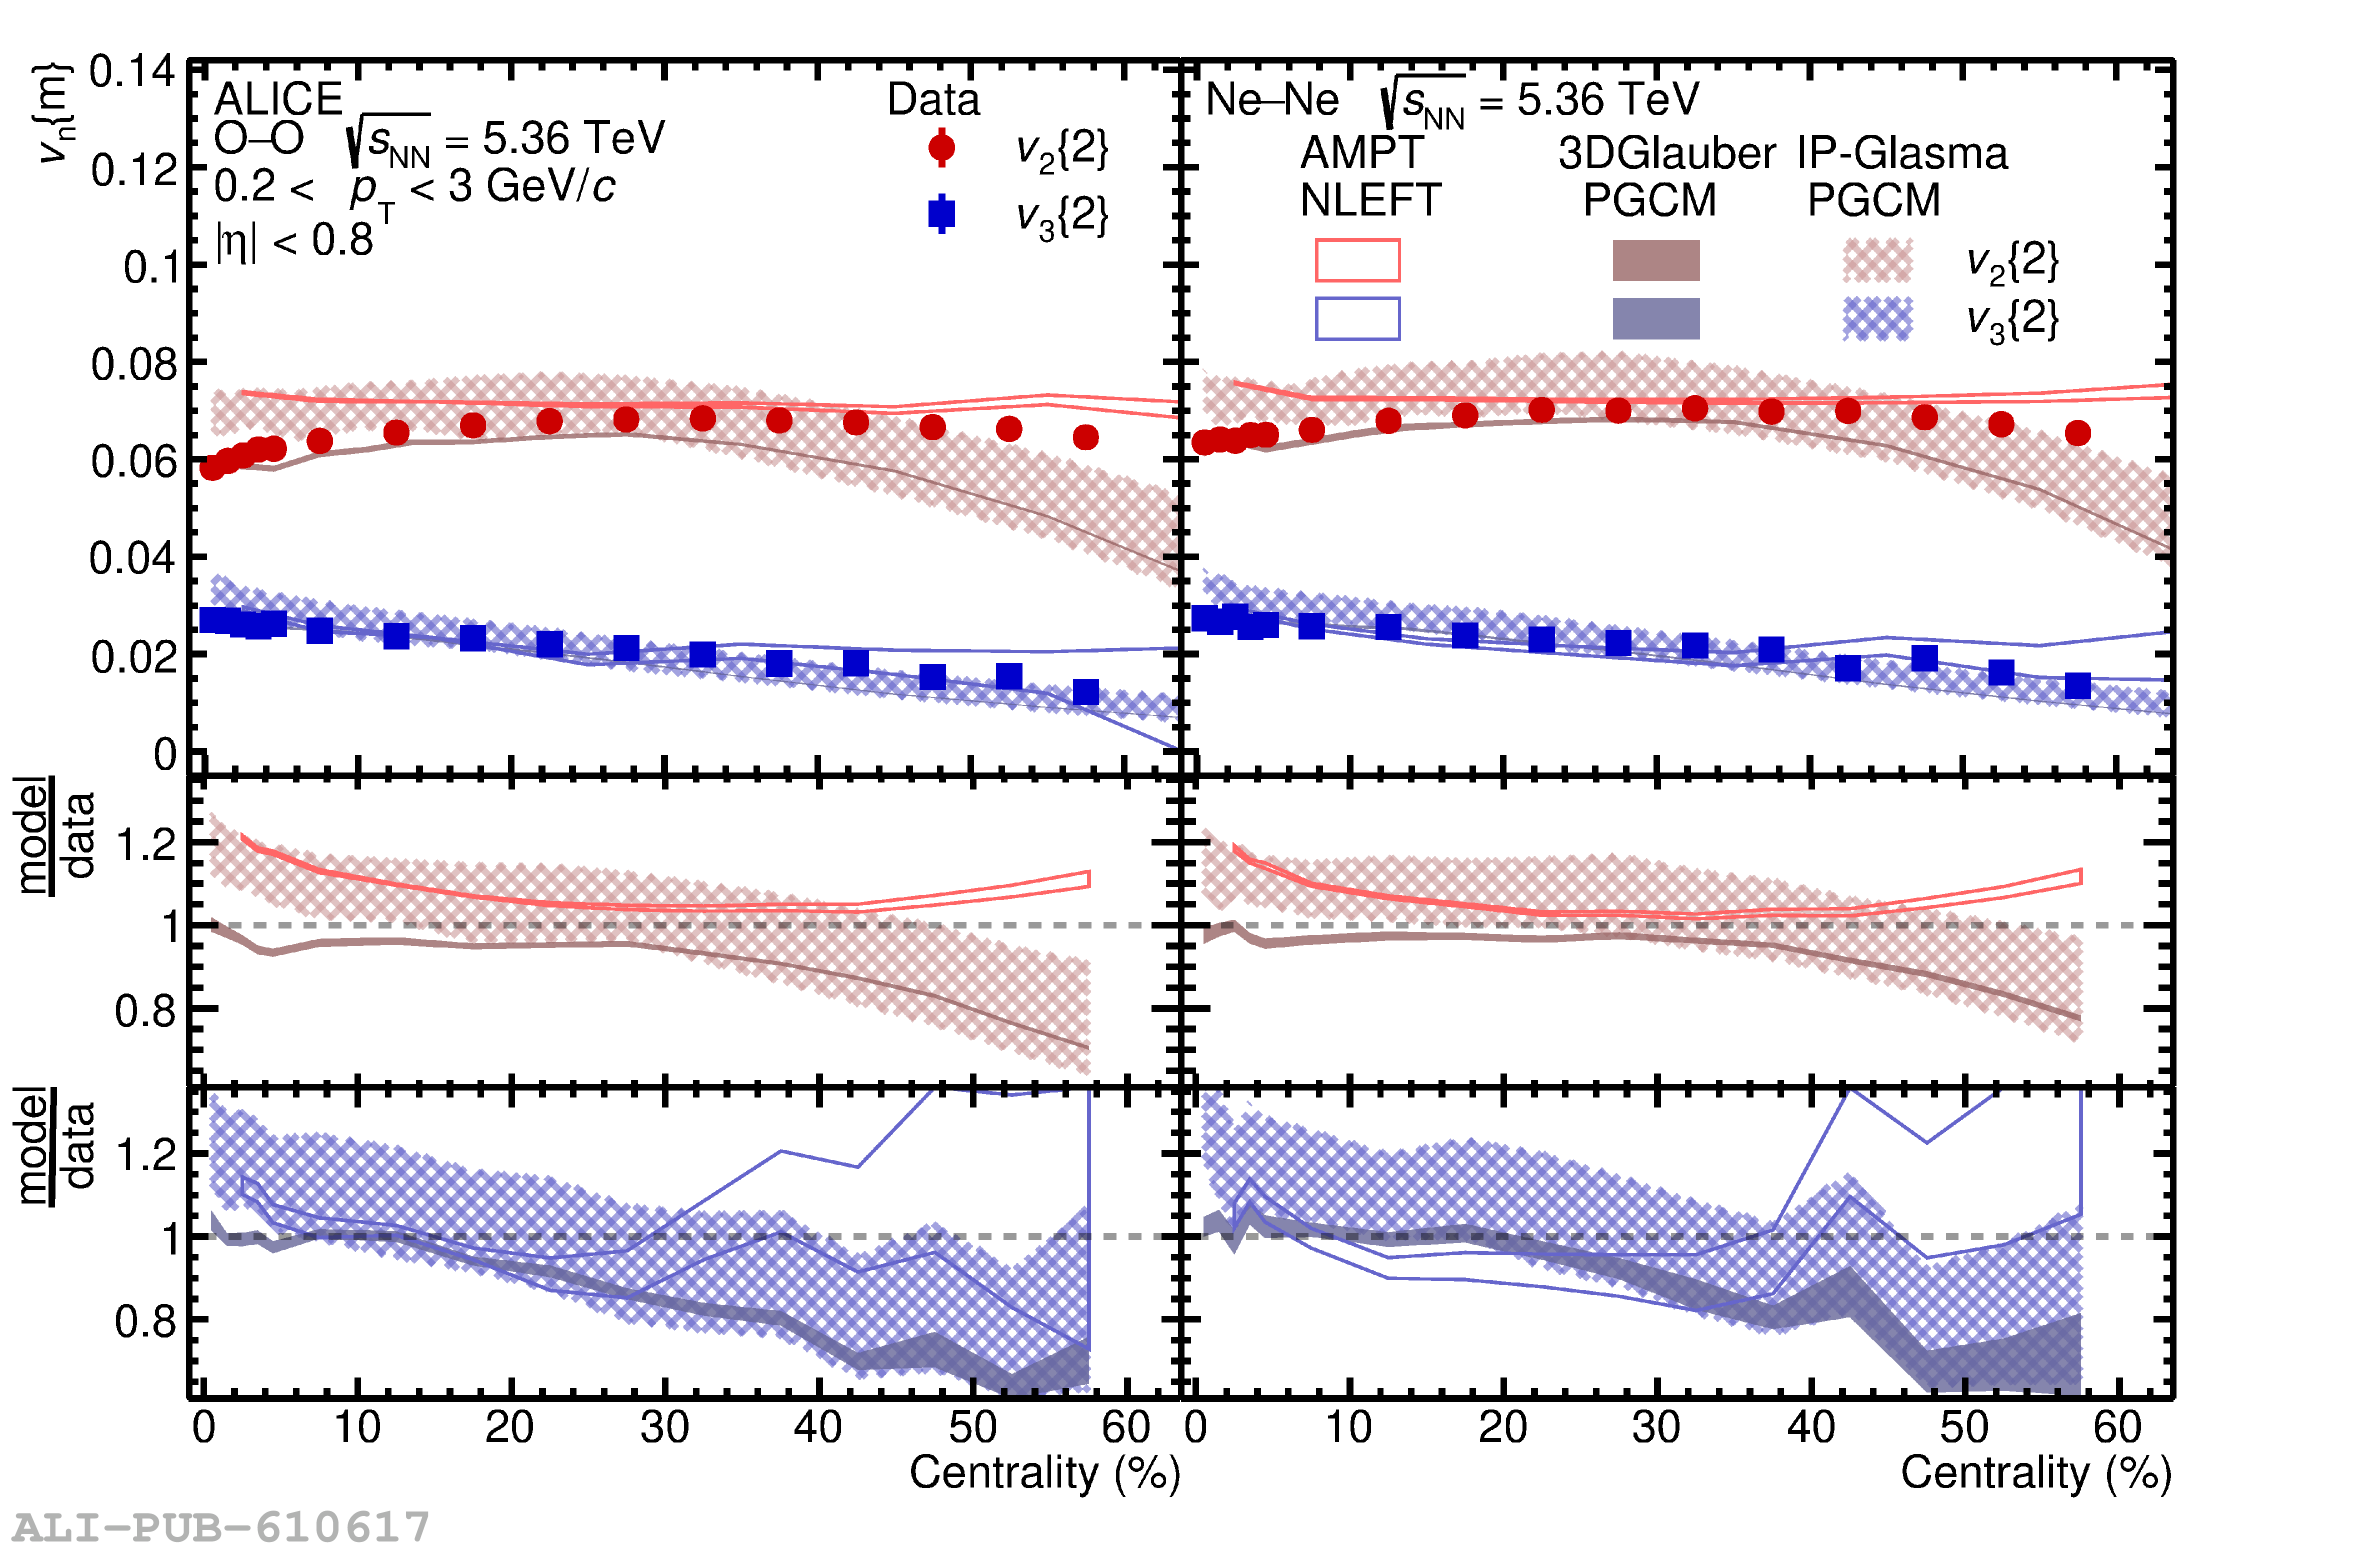 |