Left: $v_{0}(p_\mathrm{T})$ of inclusive charged particles shown as a function of $p_\mathrm{T}$ for centrality intervals 10$-$20%, compared to hydrodynamic model predictions from IP-Glasma+MUSIC+UrQMD framework with varying transport coefficients ($\eta/s$ and $\zeta/s$), in Pb$-$Pb collisions at $\sqrt{s_\mathrm{NN}} = 5.02$ TeV. Right: same measurements are compared to hydrodynamic model predictions with different equations of state (EOS) from Ref. . The statistical (systematic) uncertainties are represented by vertical bars (boxes). | 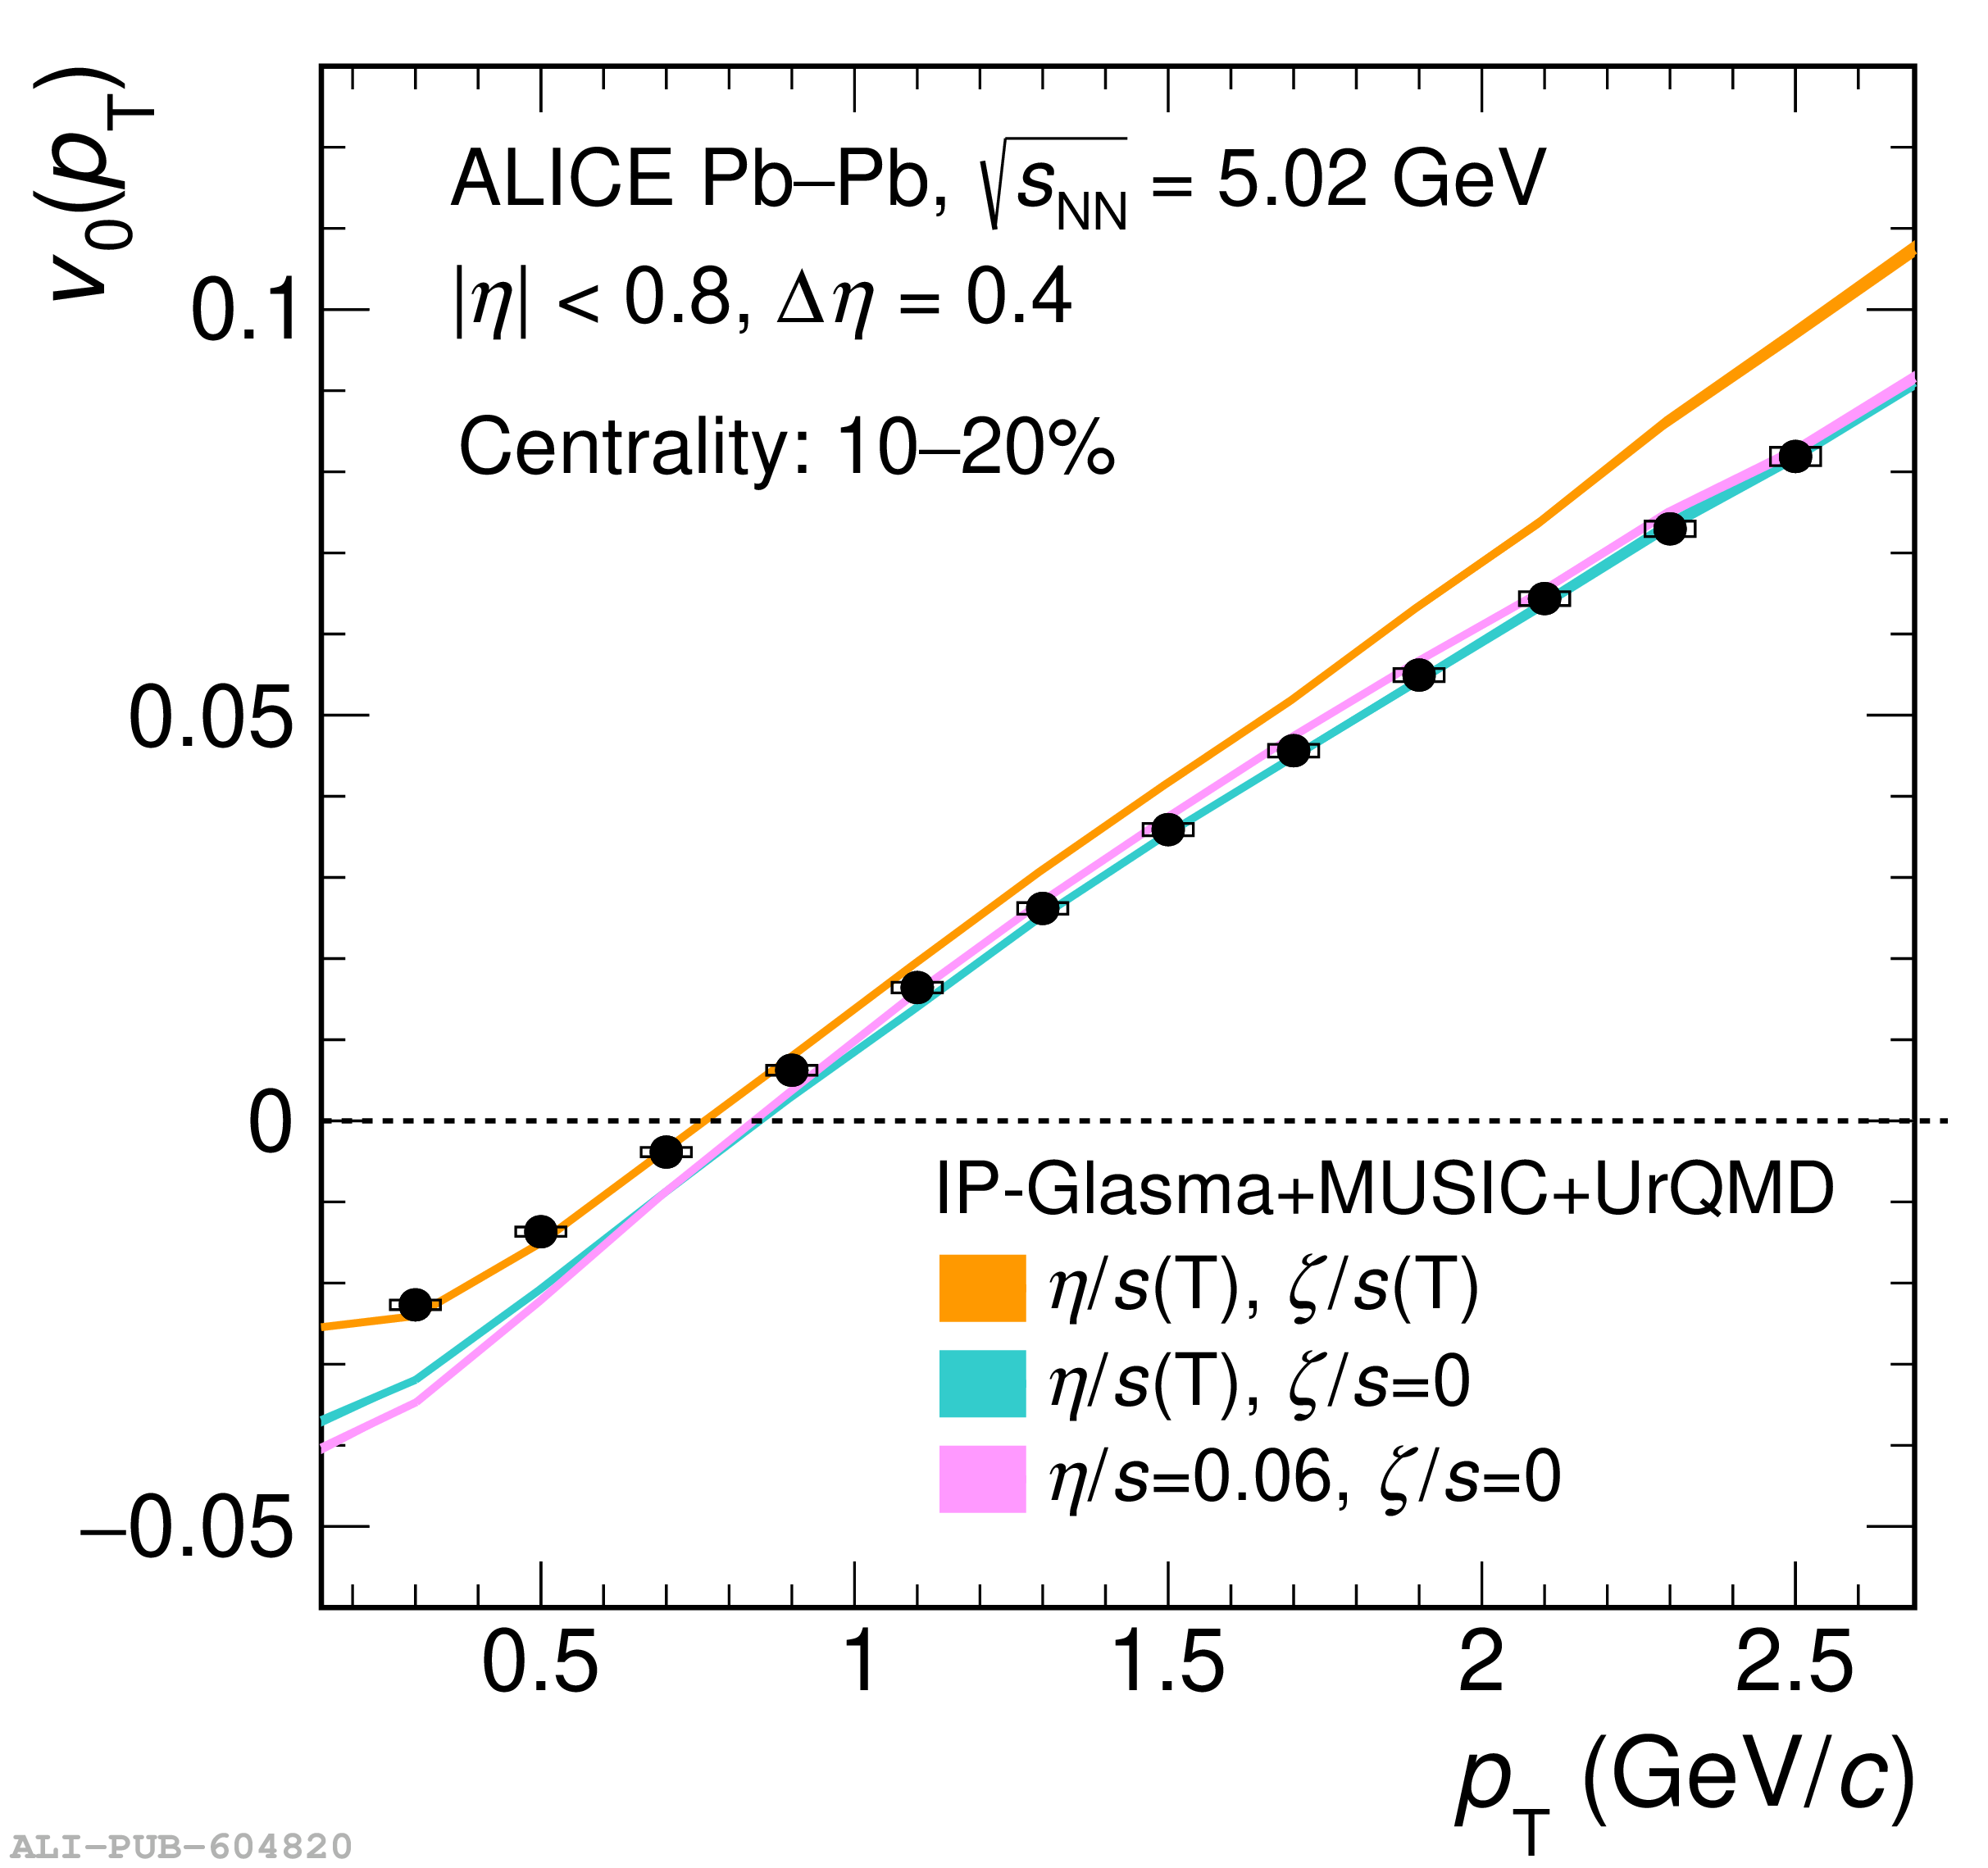 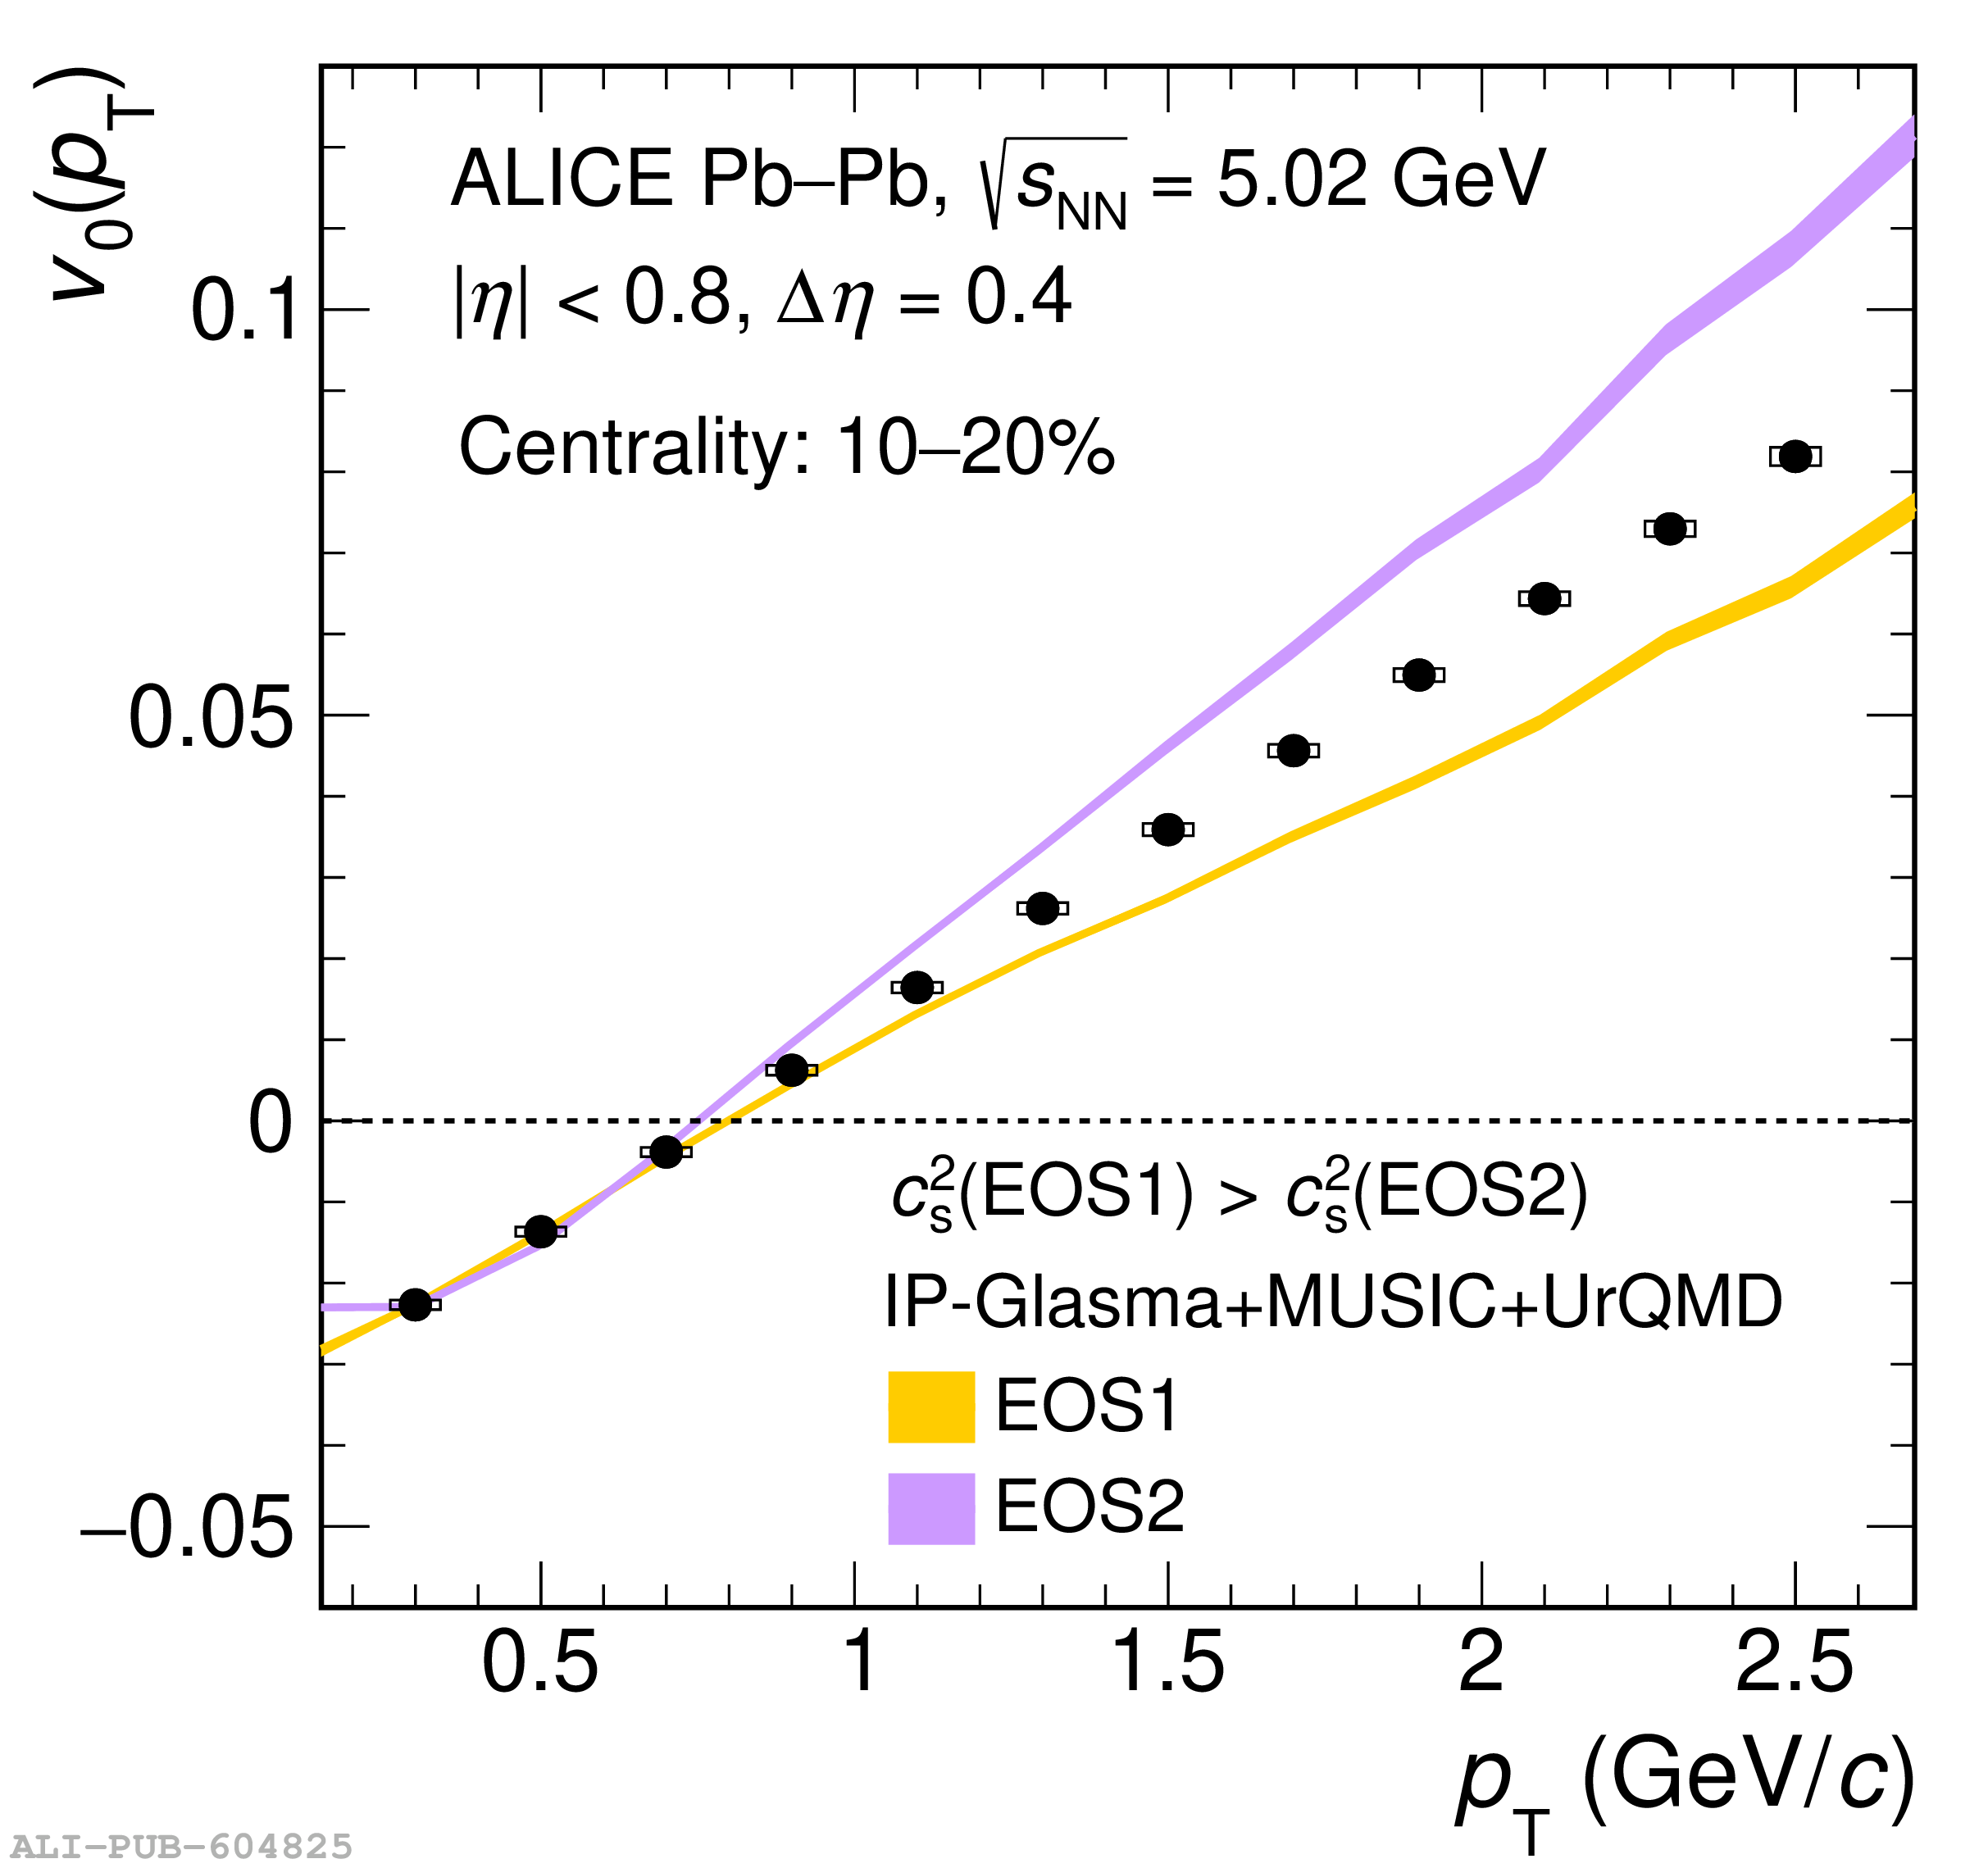 |