$v_{0}(p_\mathrm{T})$ of pions ($\pi^{\pm}$), kaons ($\mathrm{K}^{\pm}$), and protons ($\mathrm{p}(\bar{\mathrm{p}})$) shown as a function of $p_\mathrm{T}$ in Pb$-$Pb collisions at $\sqrt{s_\mathrm{NN}} = 5.02$ TeV for centrality intervals 10$-$20% (left), 30$-$40% (middle), and 60$-$70% (right). The measurements are compared to results from HIJING and IP-Glasma+MUSIC+UrQMD models. The statistical (systematic) uncertainties are represented by vertical bars (boxes). The bottom panels show the (Data-Model)/$\sigma$, representing the deviation between the experimental data and model predictions, normalized by the uncertainty. | 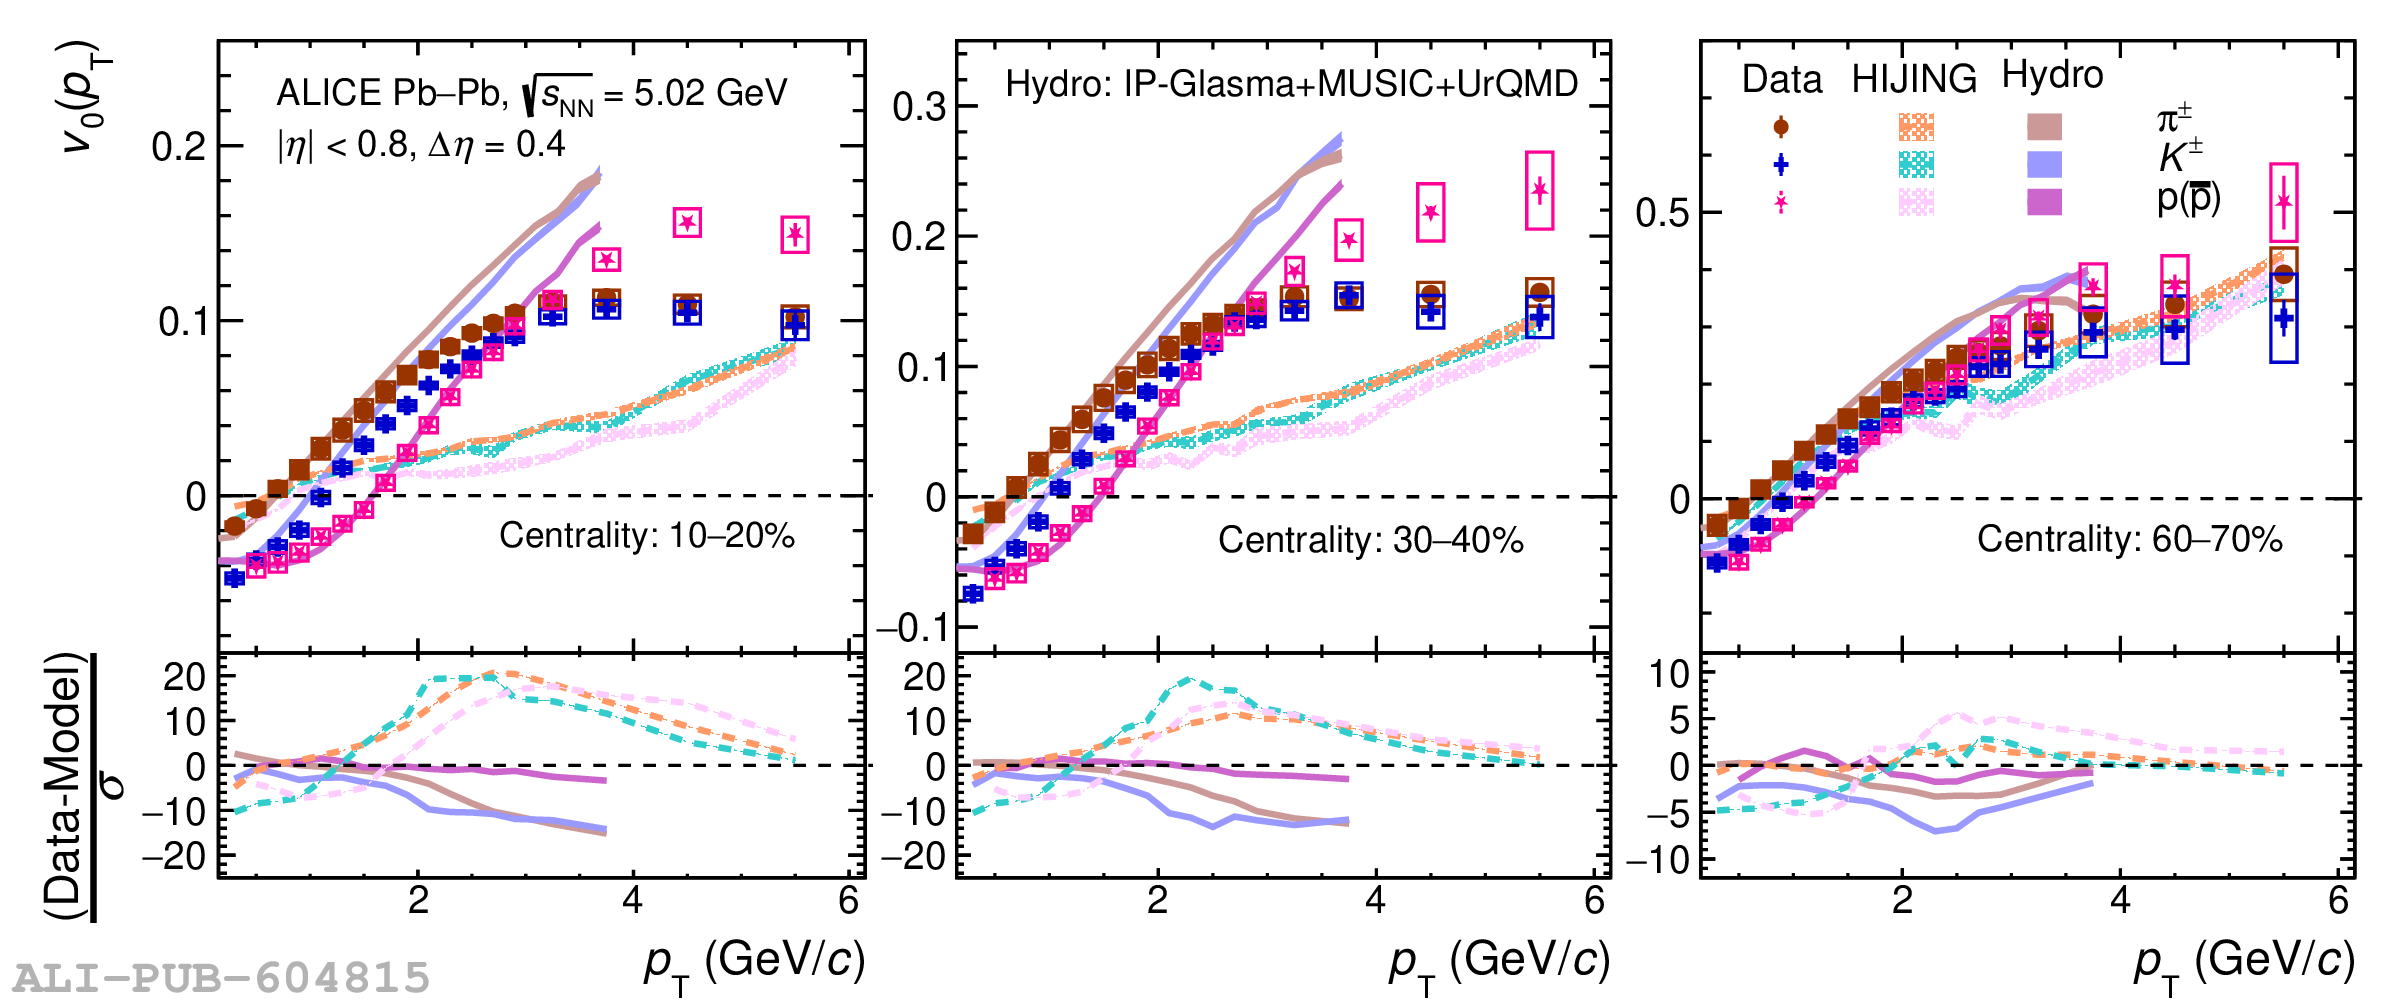 |