\Dzero-tagged jet (red) EEC distribution compared to inclusive jets without leading-track \pt selection (blue) in the \jetptrange{10}{15} (left) and \jetptrange{15}{30} (right) jet-\pt intervals. The data is shown in the solid points, and the different event generators (PYTHIA 8, Herwig, Sherpa Lund and Sherpa Ahadic) are shown in various line styles. The error bars show the statistical error, and the boxes represent the systematic error. | 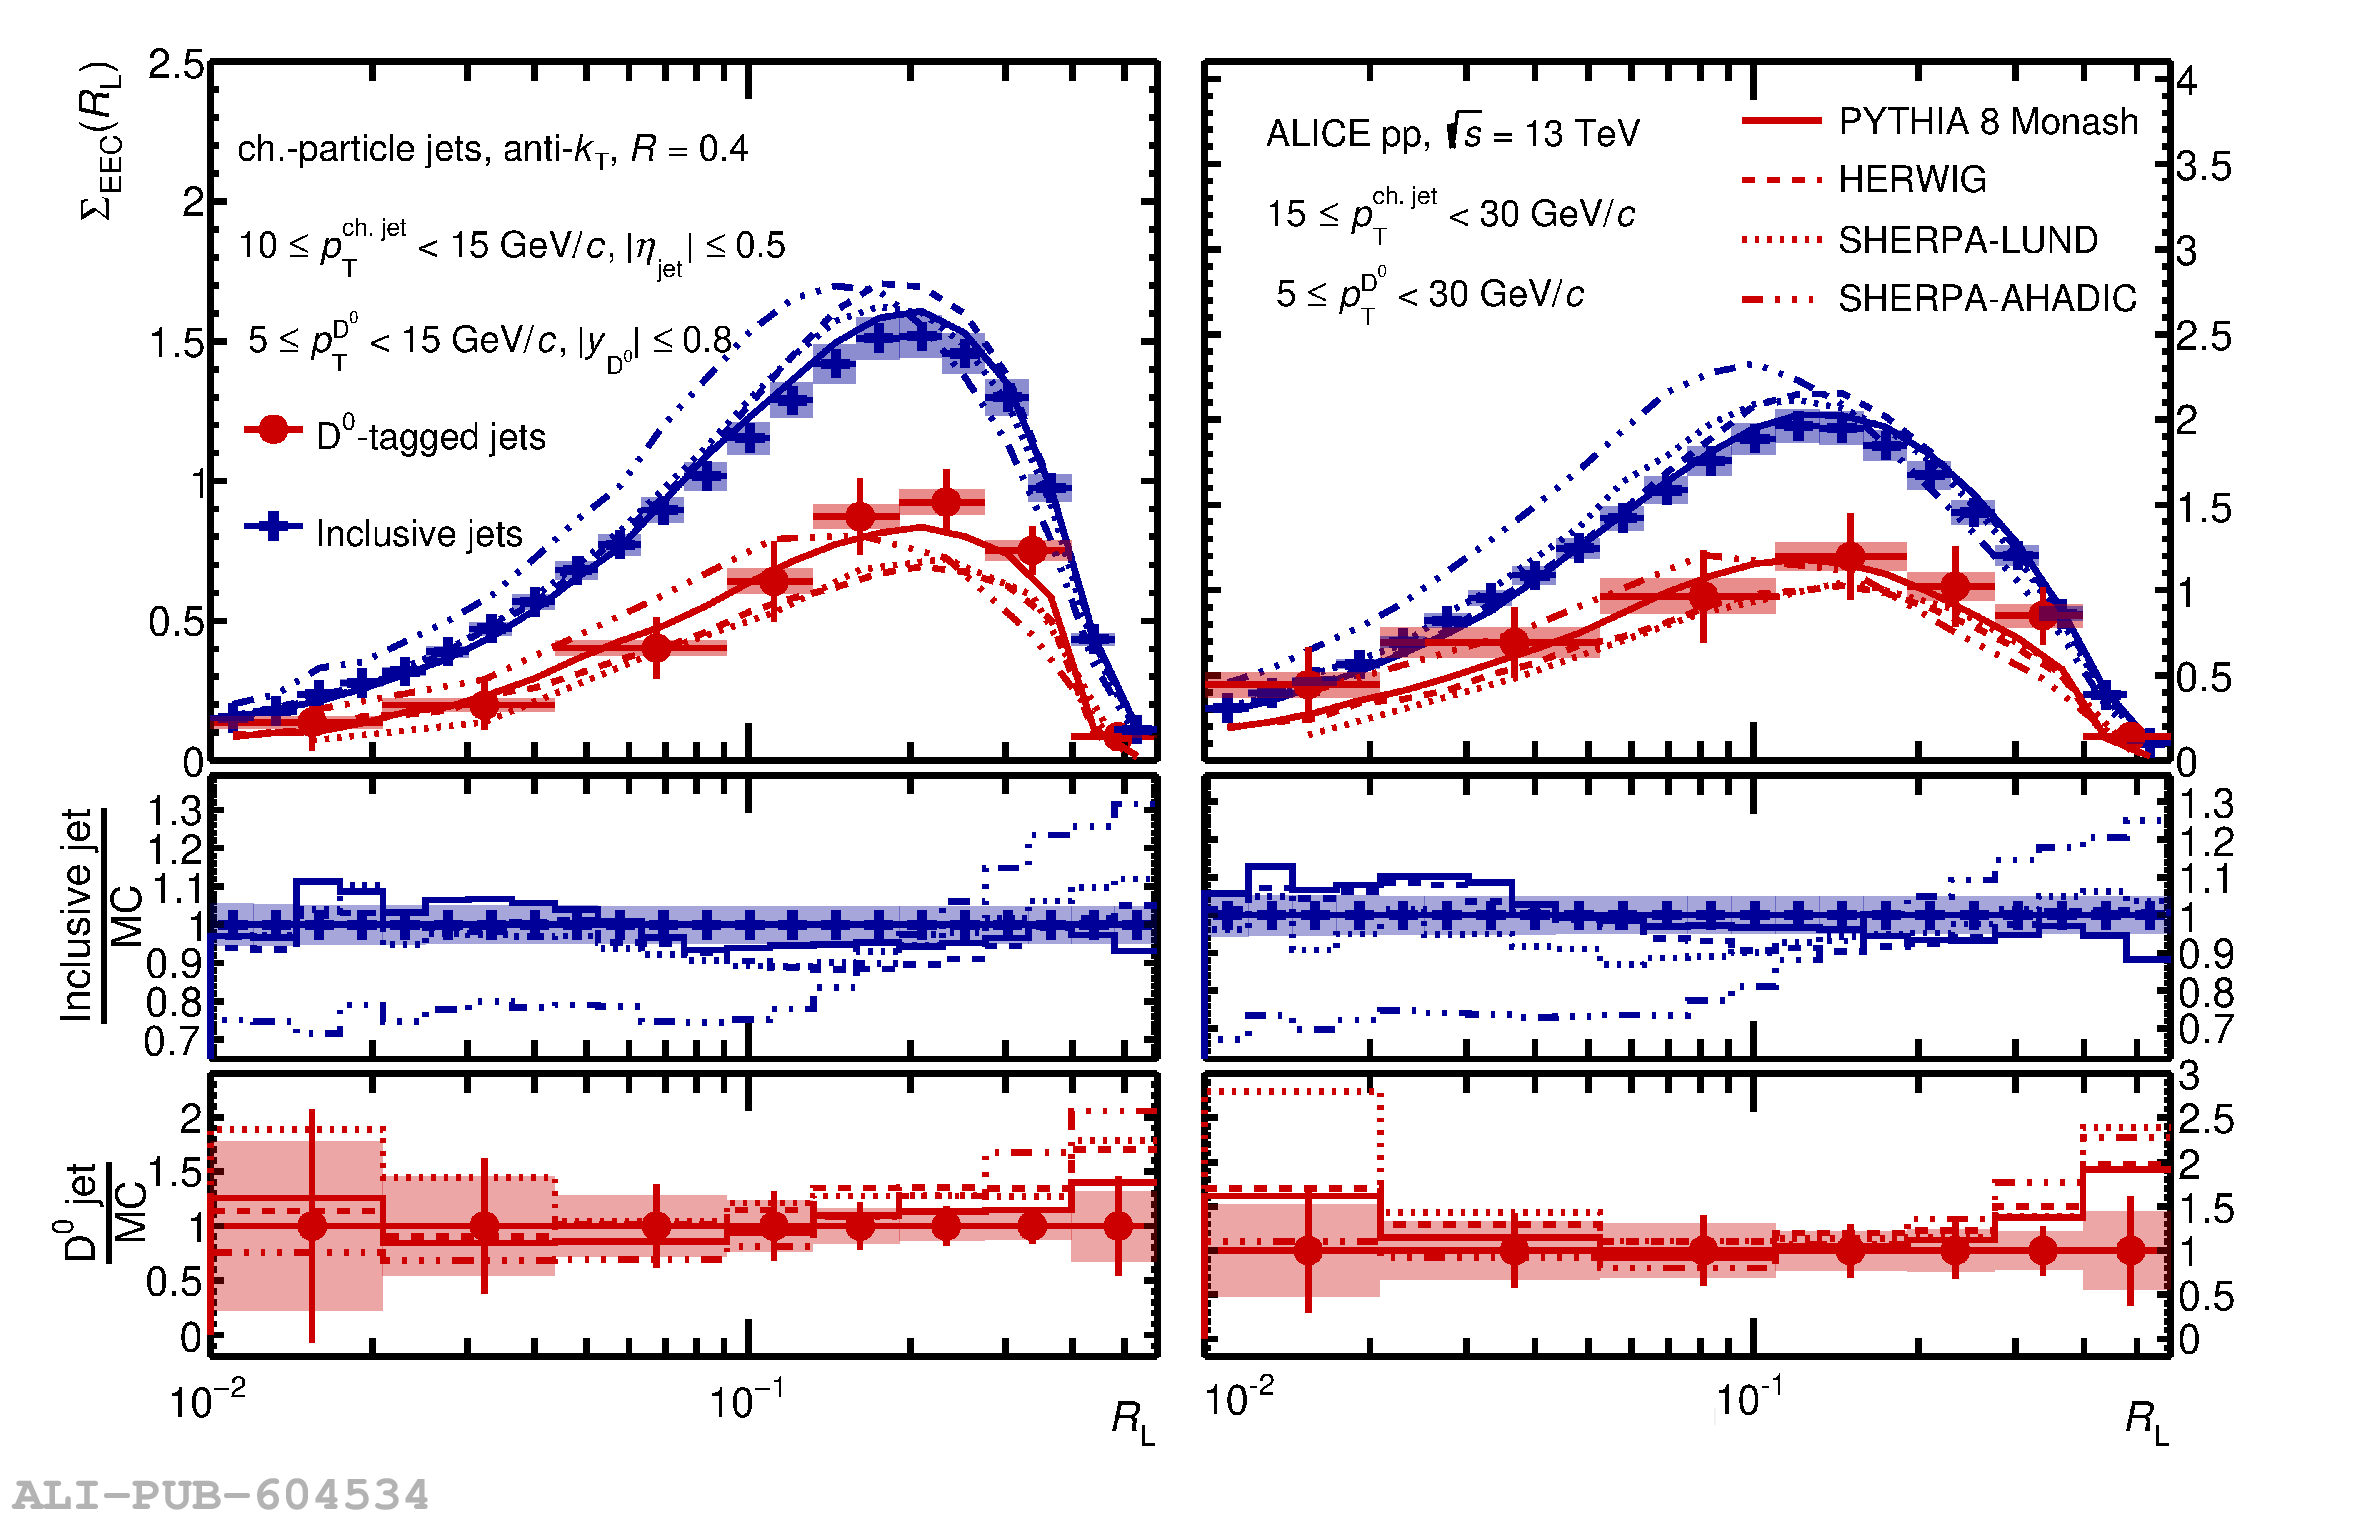 |