\Dzero-tagged jet (red) EEC distribution compared to inclusive jets with no leading track \pt selection (blue) and inclusive jets with a 5 \GeVc leading-track \pt selection (green), to PYTHIA 8 simulations, and to pQCD predictions in the \jetptrange{10}{15} (left) and \jetptrange{15}{30} (right) jet-\pt intervals. The middle panel shows the ratio of \Dzero-tagged jets to inclusive jets in the data. The bottom panel compares the ratio of \Dzero-tagged jets to inclusive jets with the ratio of \Dzero-tagged jets to light-quark jets in PYTHIA 8. The error bars show the statistical error, and the boxes represent the systematic error. | 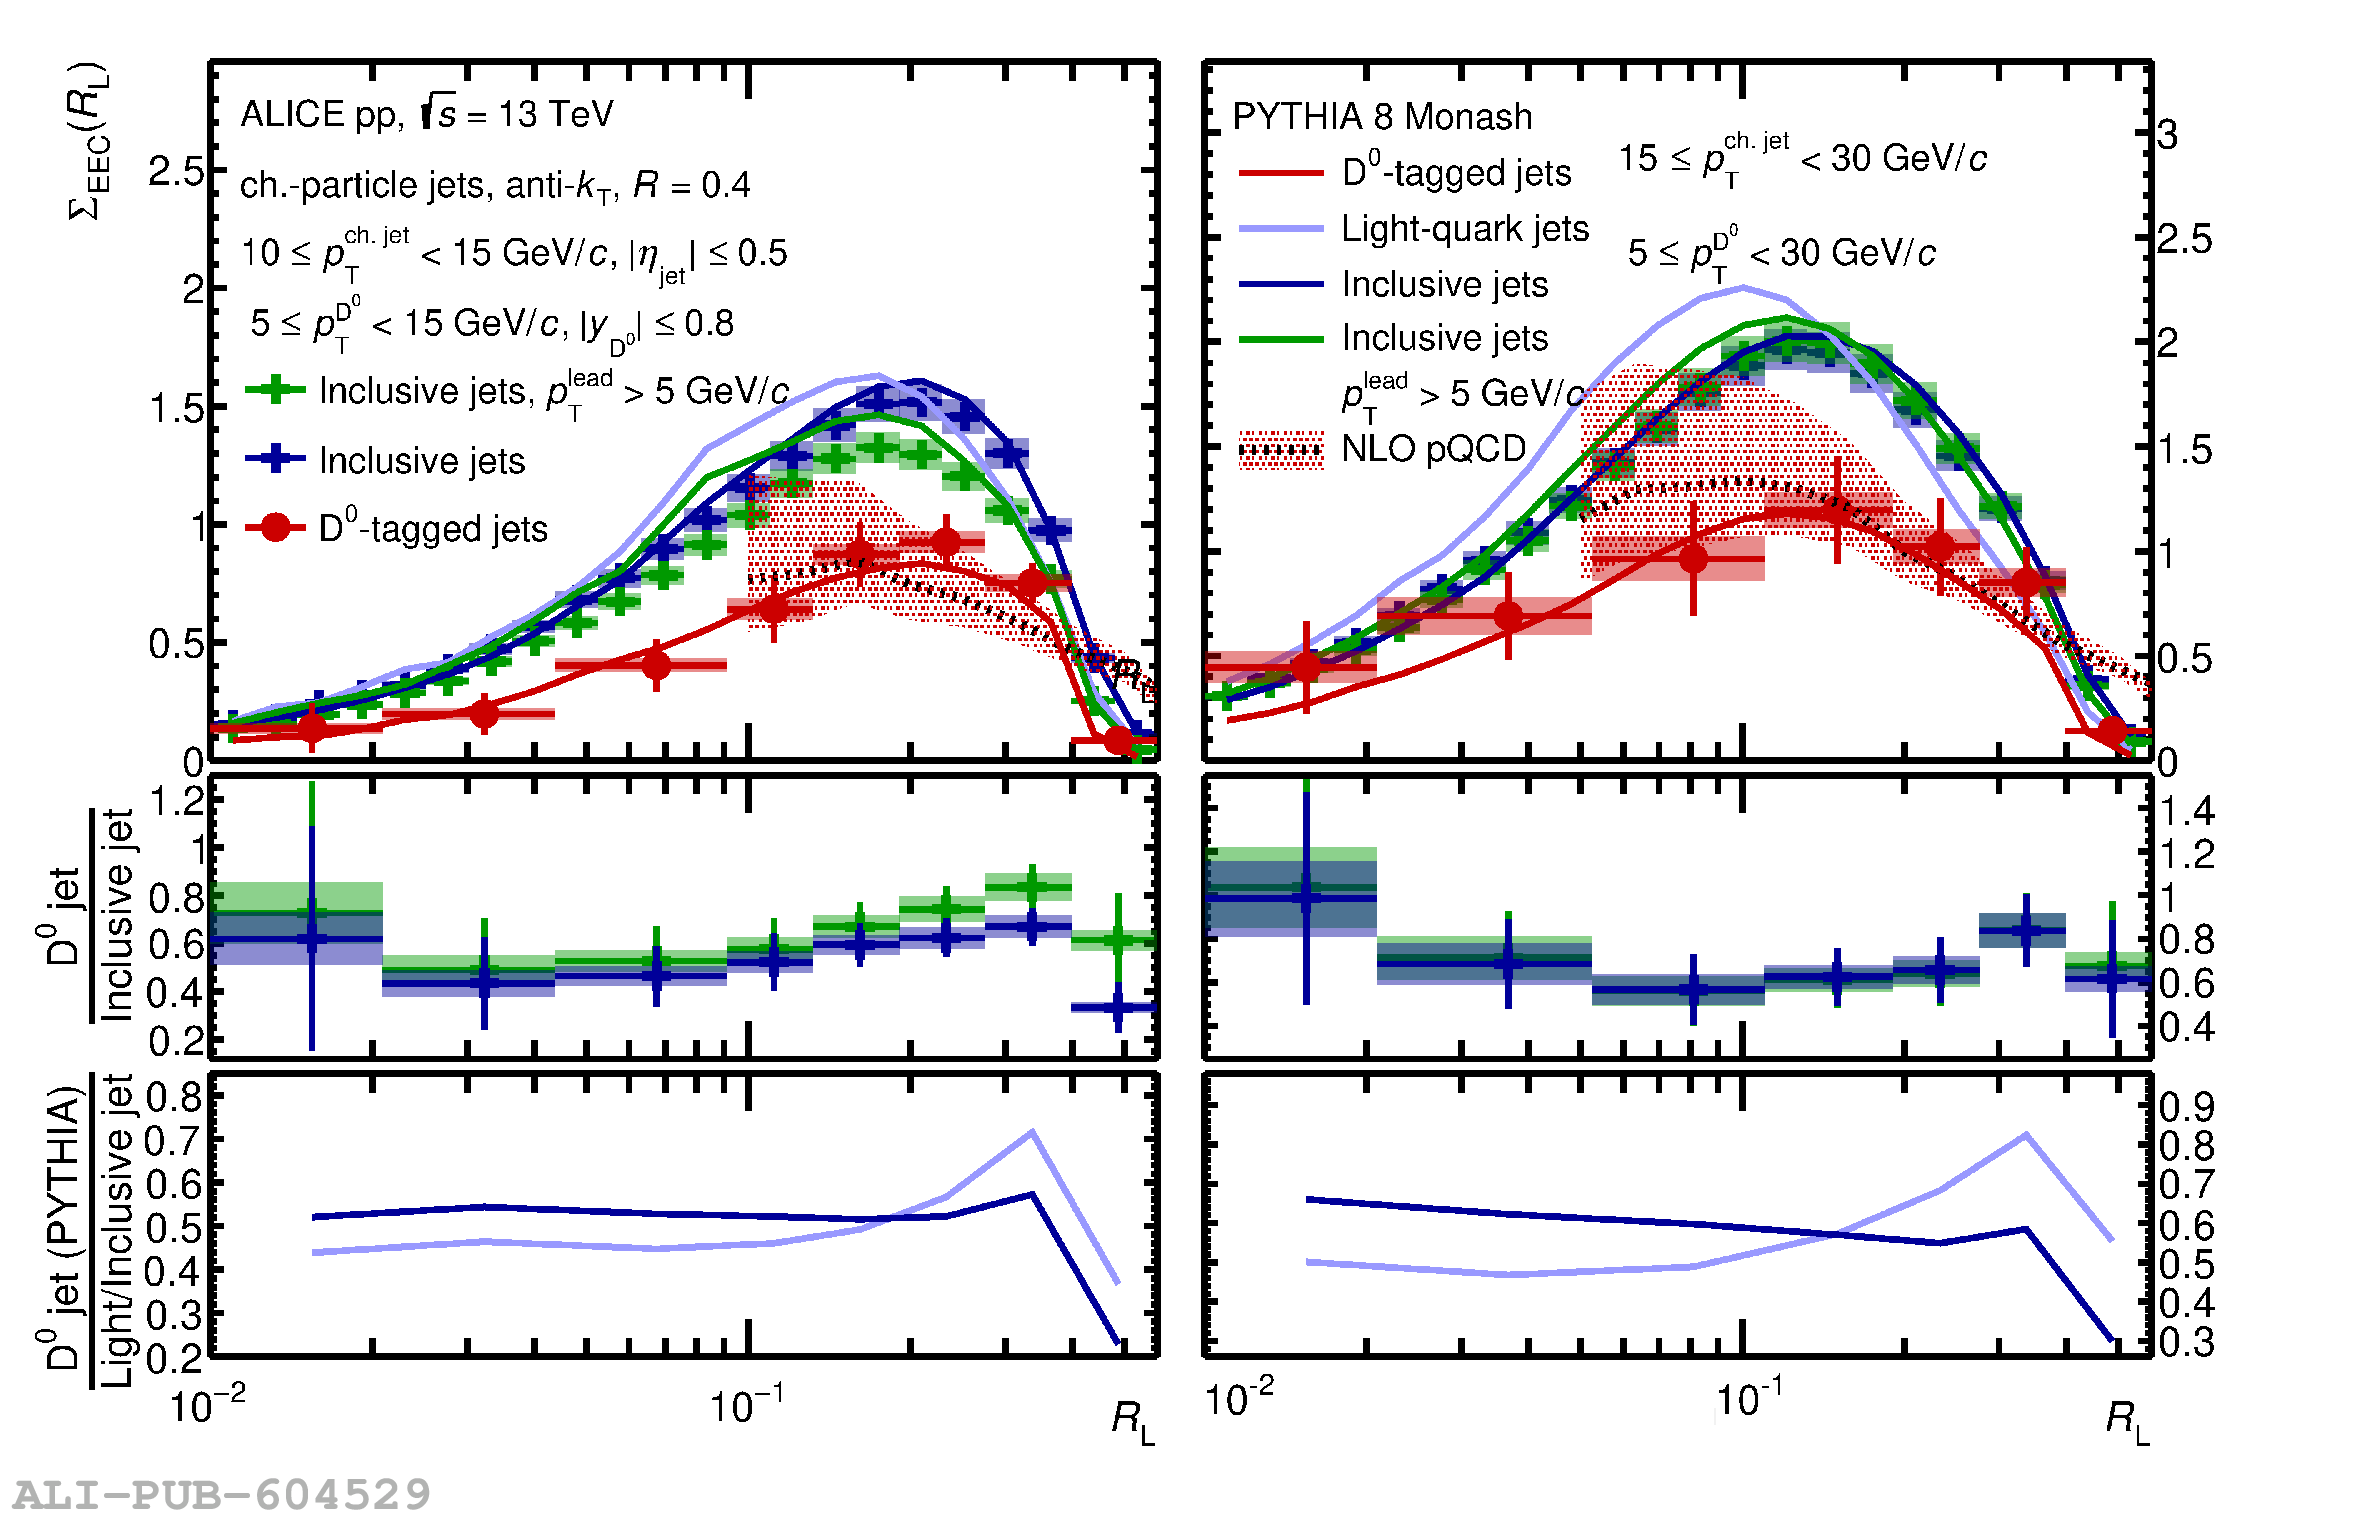 |