Upper row: $\rm \uppi^{+}d \oplus \uppi^{-}\overline{d}$ correlation functions in three centrality classes with Coulomb (Lednick\'y--Lyuboshitz, denoted as L-L) fits shown as orange bands. Bottom row: $\rm \uppi^{-}d \oplus \uppi^{+}\overline{d}$ correlation functions in three centrality classes with L--L fits including both Coulomb and strong interaction shown as blue bands. The data are shown after non-femtoscopic background subtraction and corrections (see text for more details). The statistical and systematic uncertainties of the experimental data are represented by lines and boxes, respectively Bandwidths represent the systematic uncertainties related to the fit. The bottom sub-panels display the data-to-fit differences normalized by the statistical uncertainty $\sigma_{\rm stat}$. | 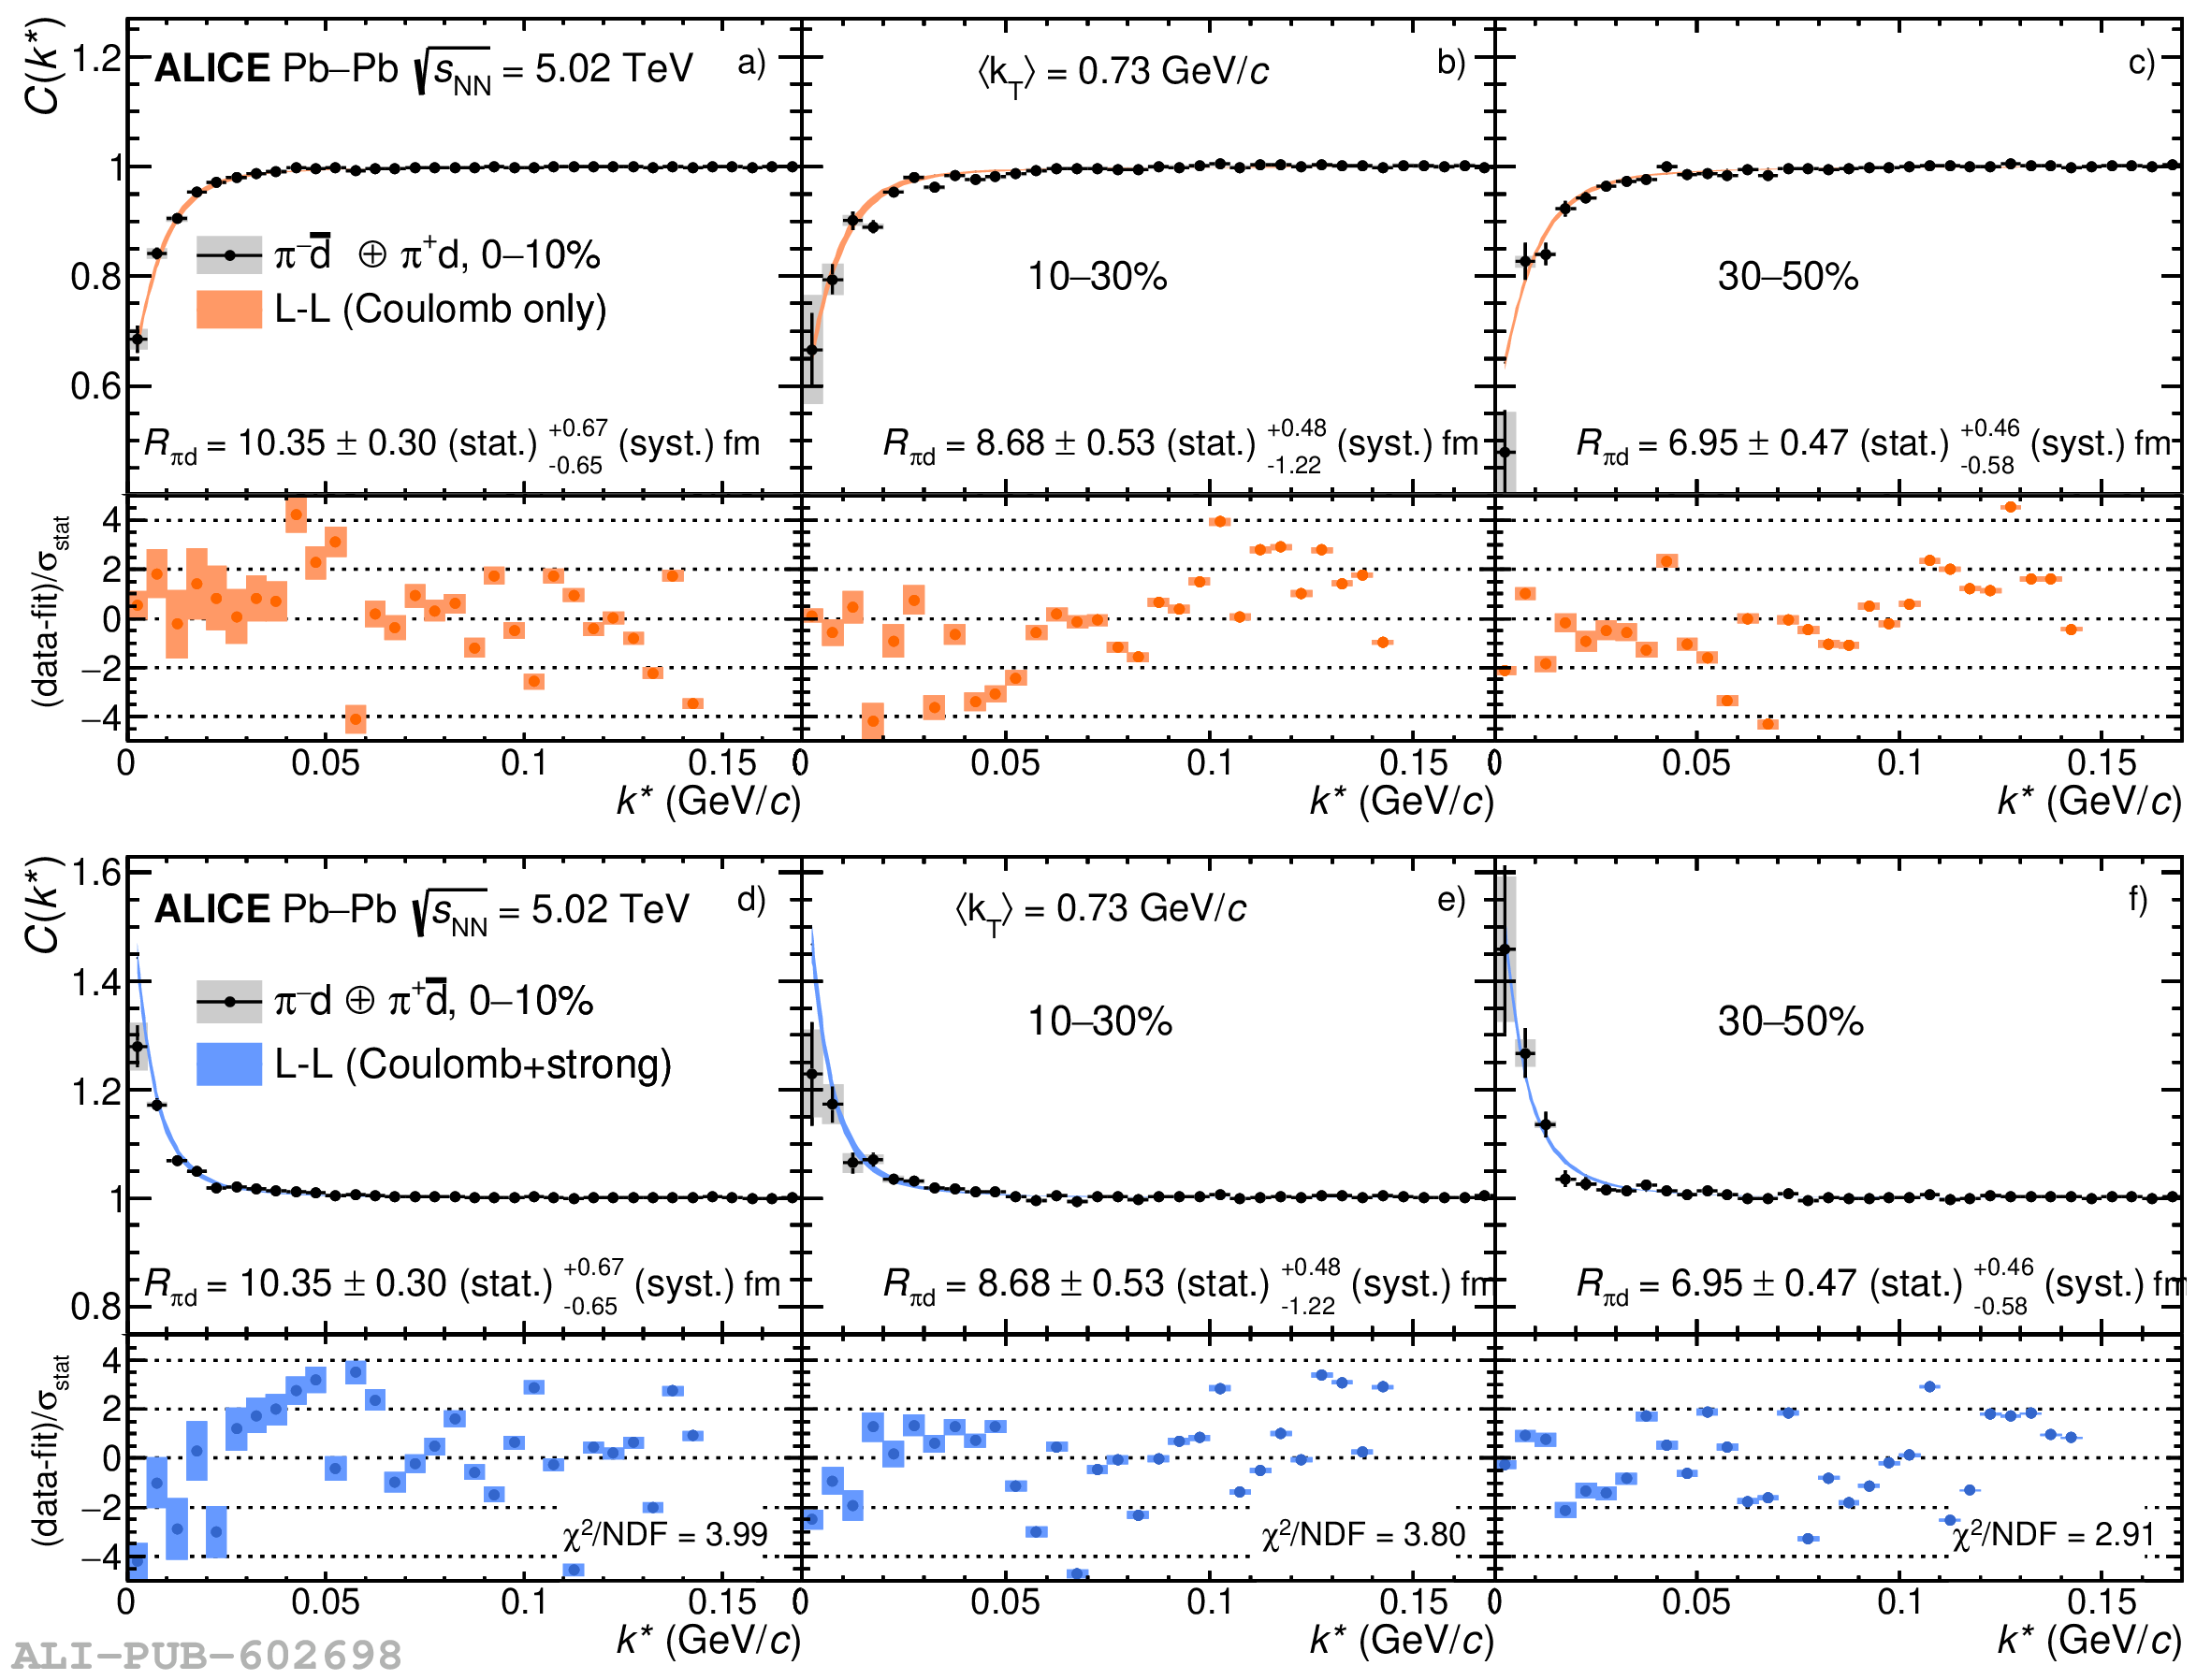 |