Measured \piPd (left) and \piMd (right) correlation functions fitted with model calculations (upper panels) and the number of standard deviations (lower panels). The brown crosshatched bands in both panels correspond to contributions by the $\Delta$ resonance, blue bands represent the Coulomb interactions, teal diagonally hatched bands the residual background and the magenta bands the total fit function. The lower panels display comparisons between the data points and the fit in terms of the number of standard deviations $n\sigma$, where statistically 95\% of points are expected to lie within $\pm2\sigma$. | 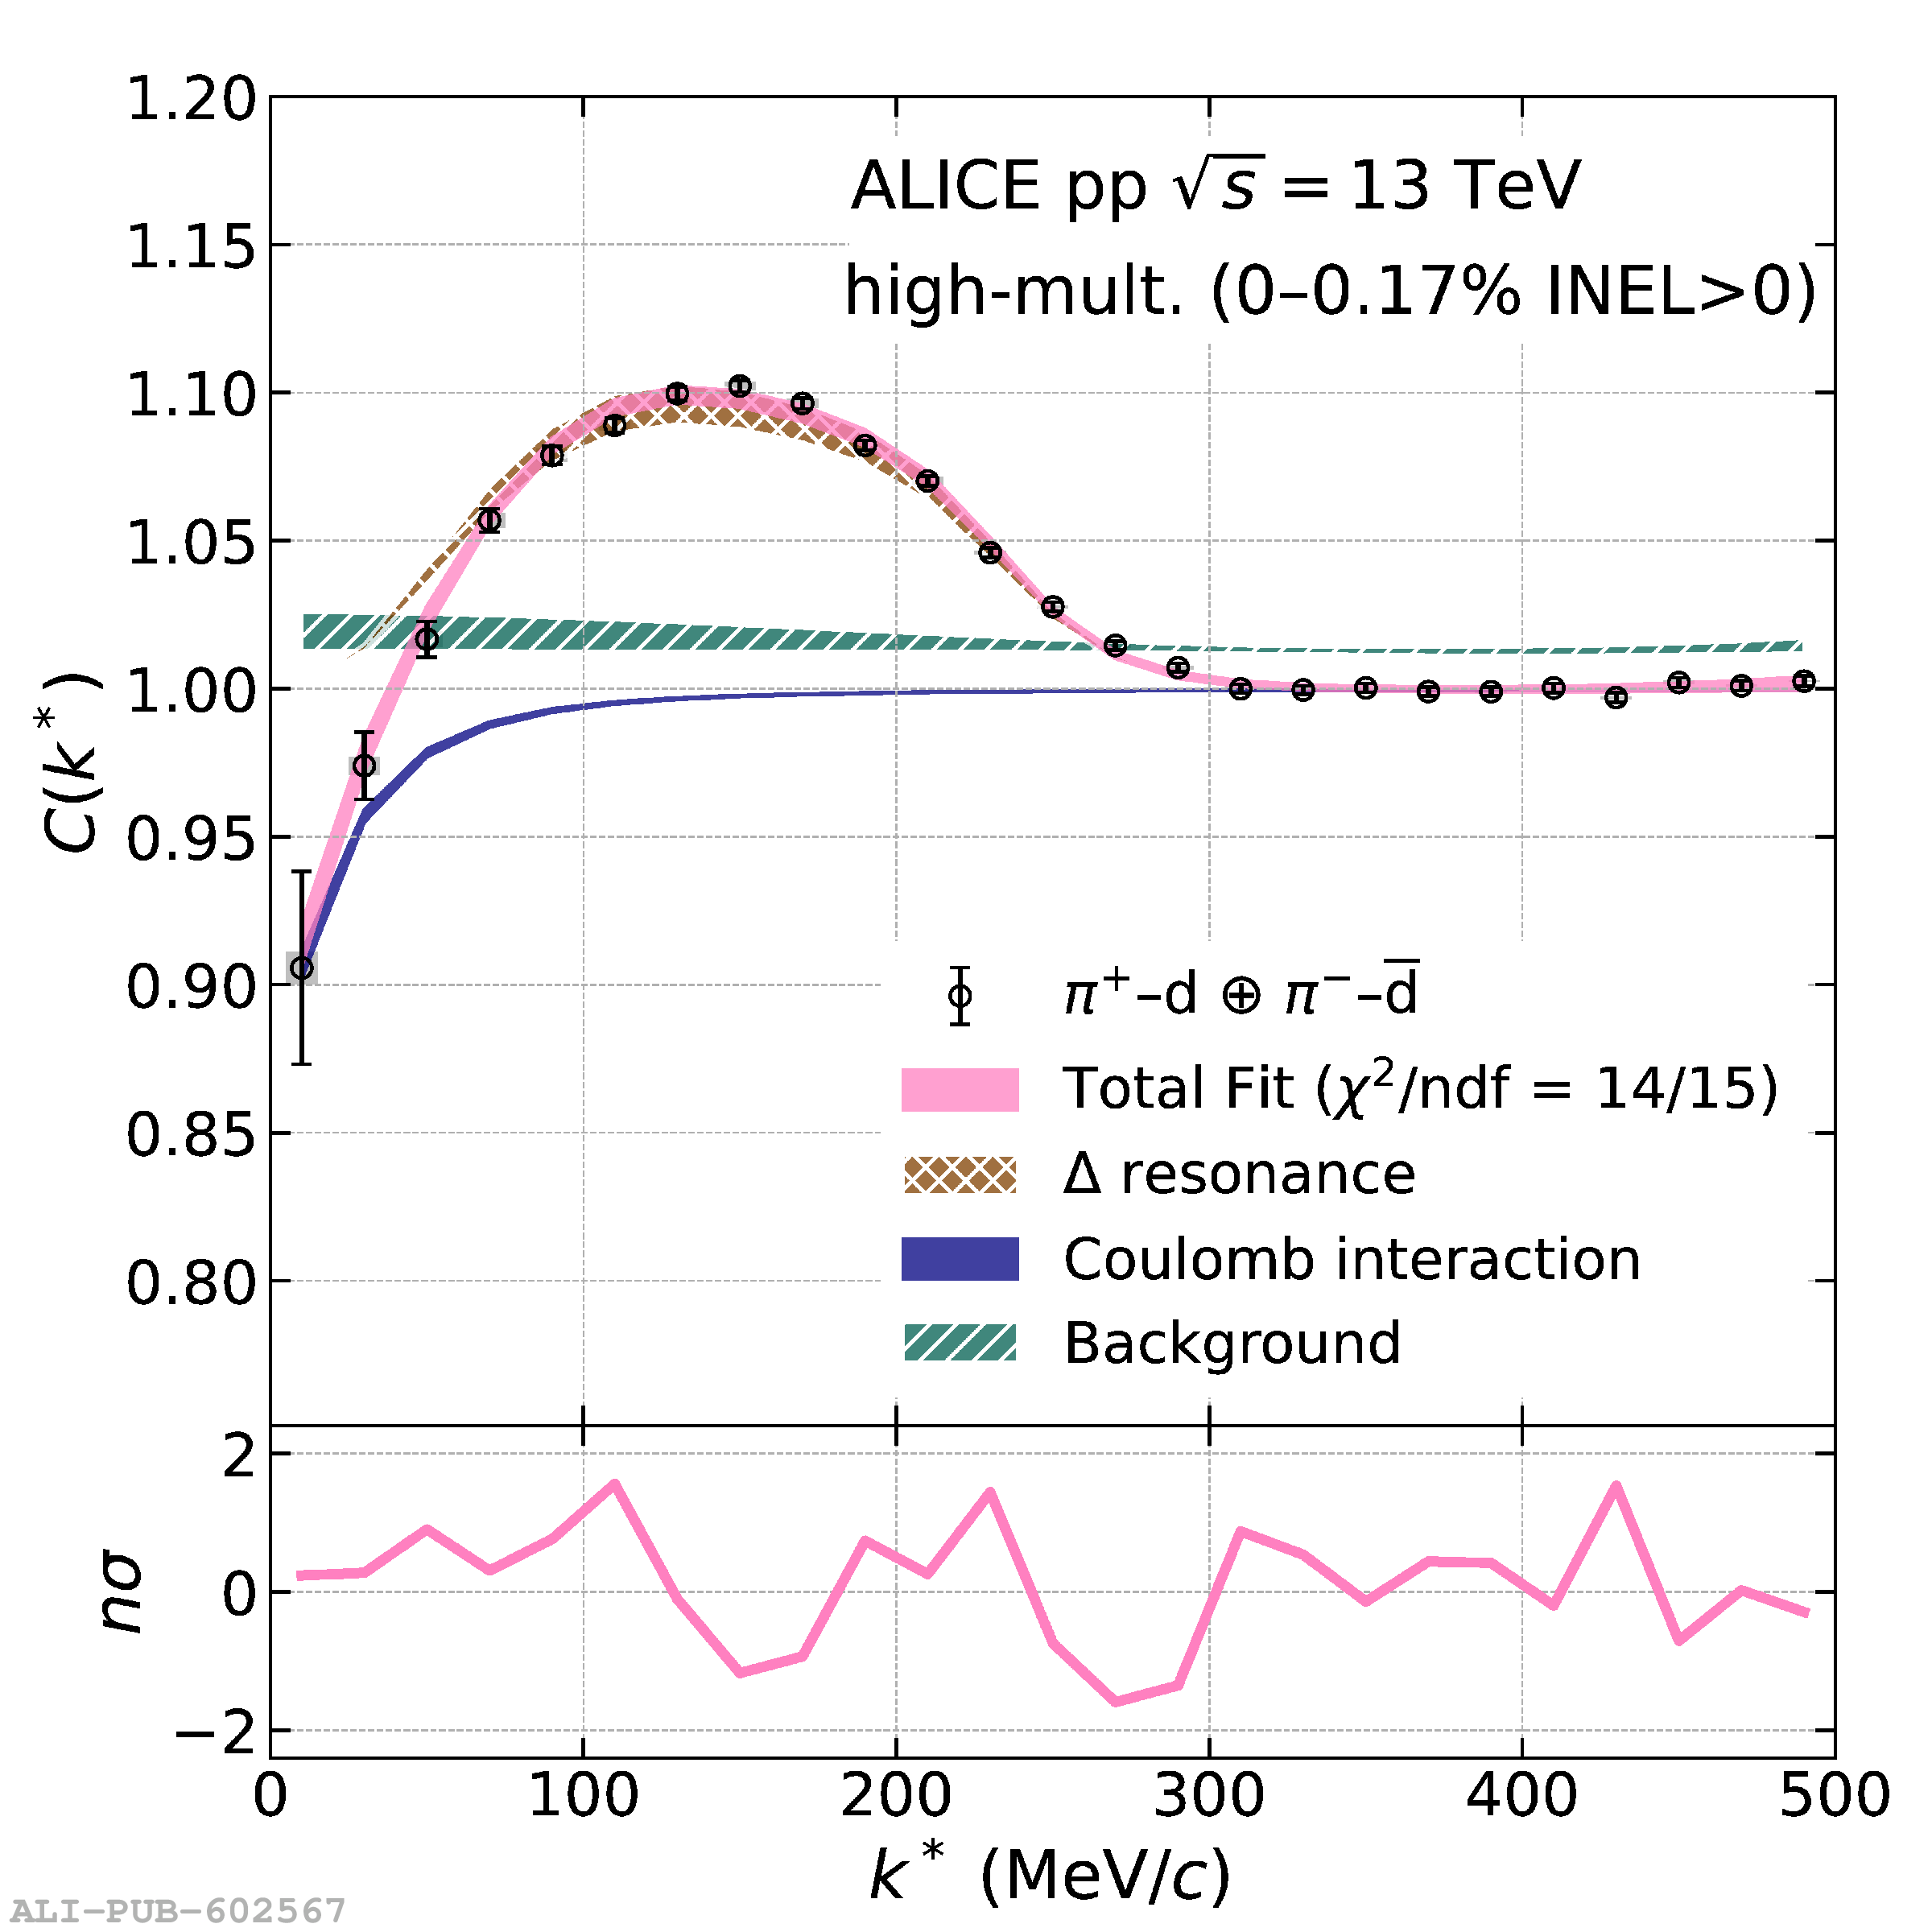 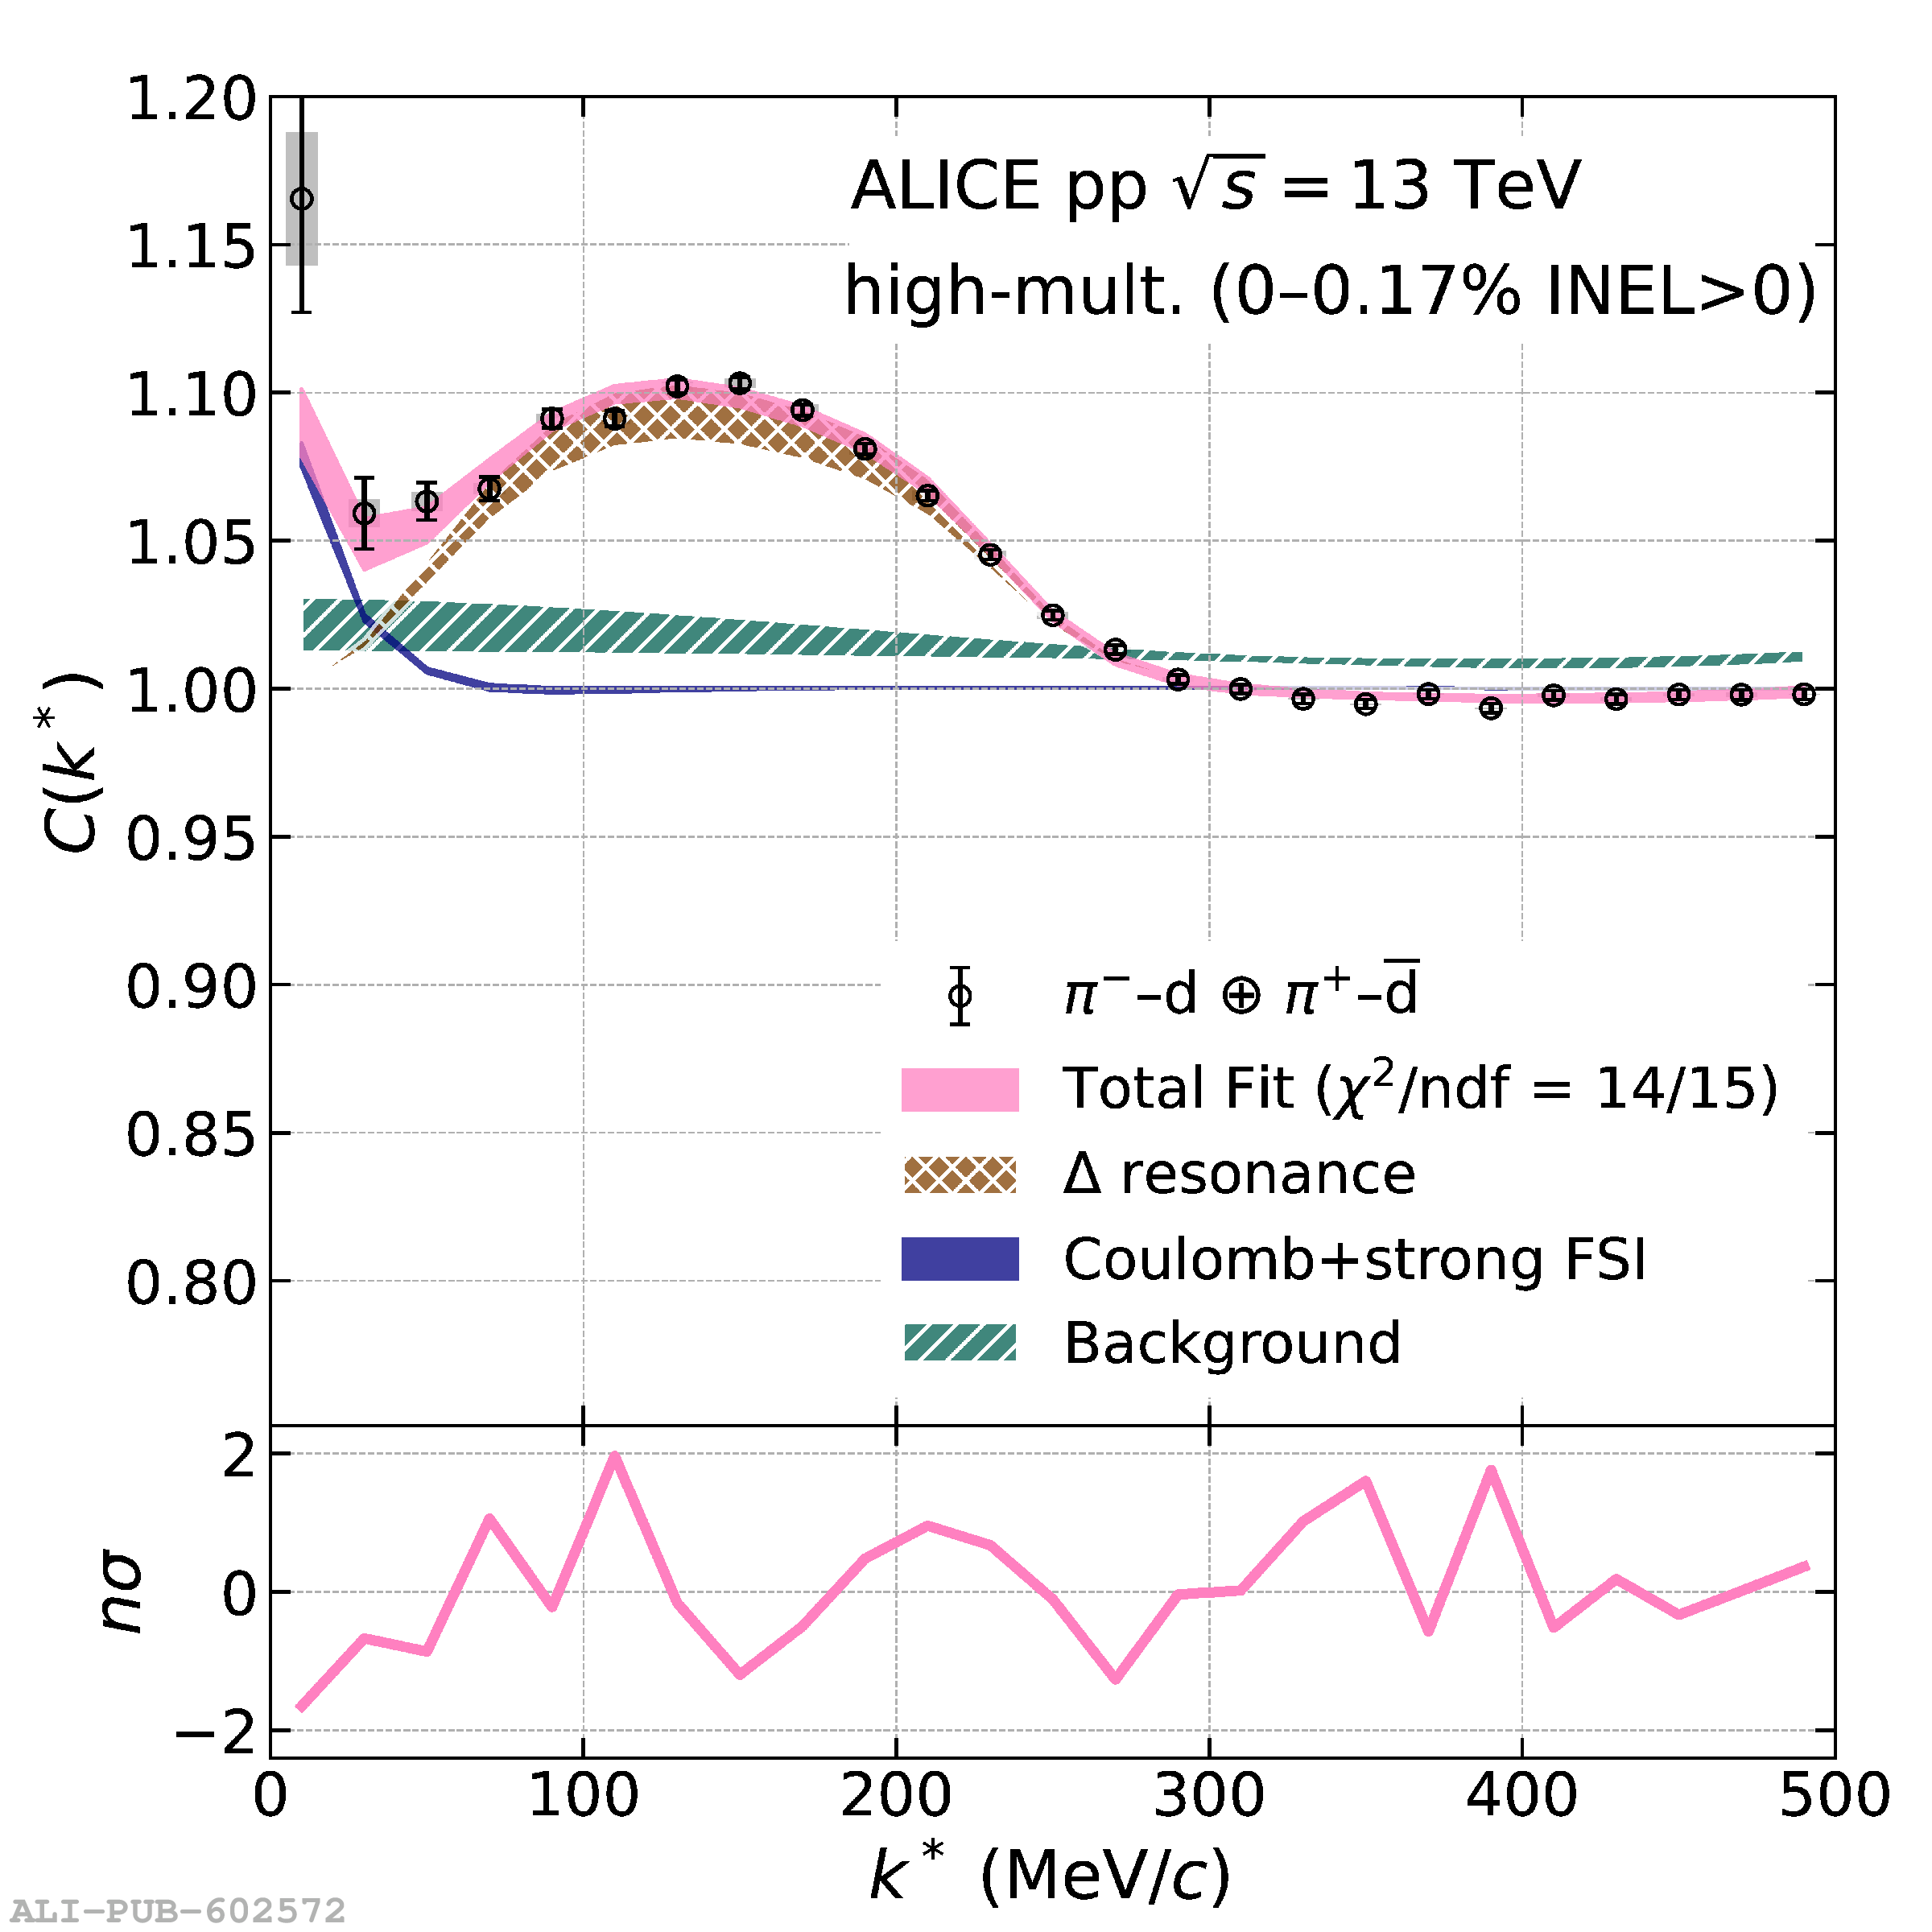 |