PYTHIA 8 predictions of the jet axes difference distributions for \deltaR{STD}{WTA} and \deltaR{WTA}{SD}, where the Soft Drop parameters are $\beta=0$ and $\zcut = 0.1$ or $0.2$, in \jetptrange{10}{20}. The top panels show the normalized distributions. Left: \Dzero-tagged jets compared to inclusive jets. Middle: \Dzero-tagged jets compared to gluon-initiated jets. Right: \Dzero-tagged jets compared to light-quark-initiated jets. | 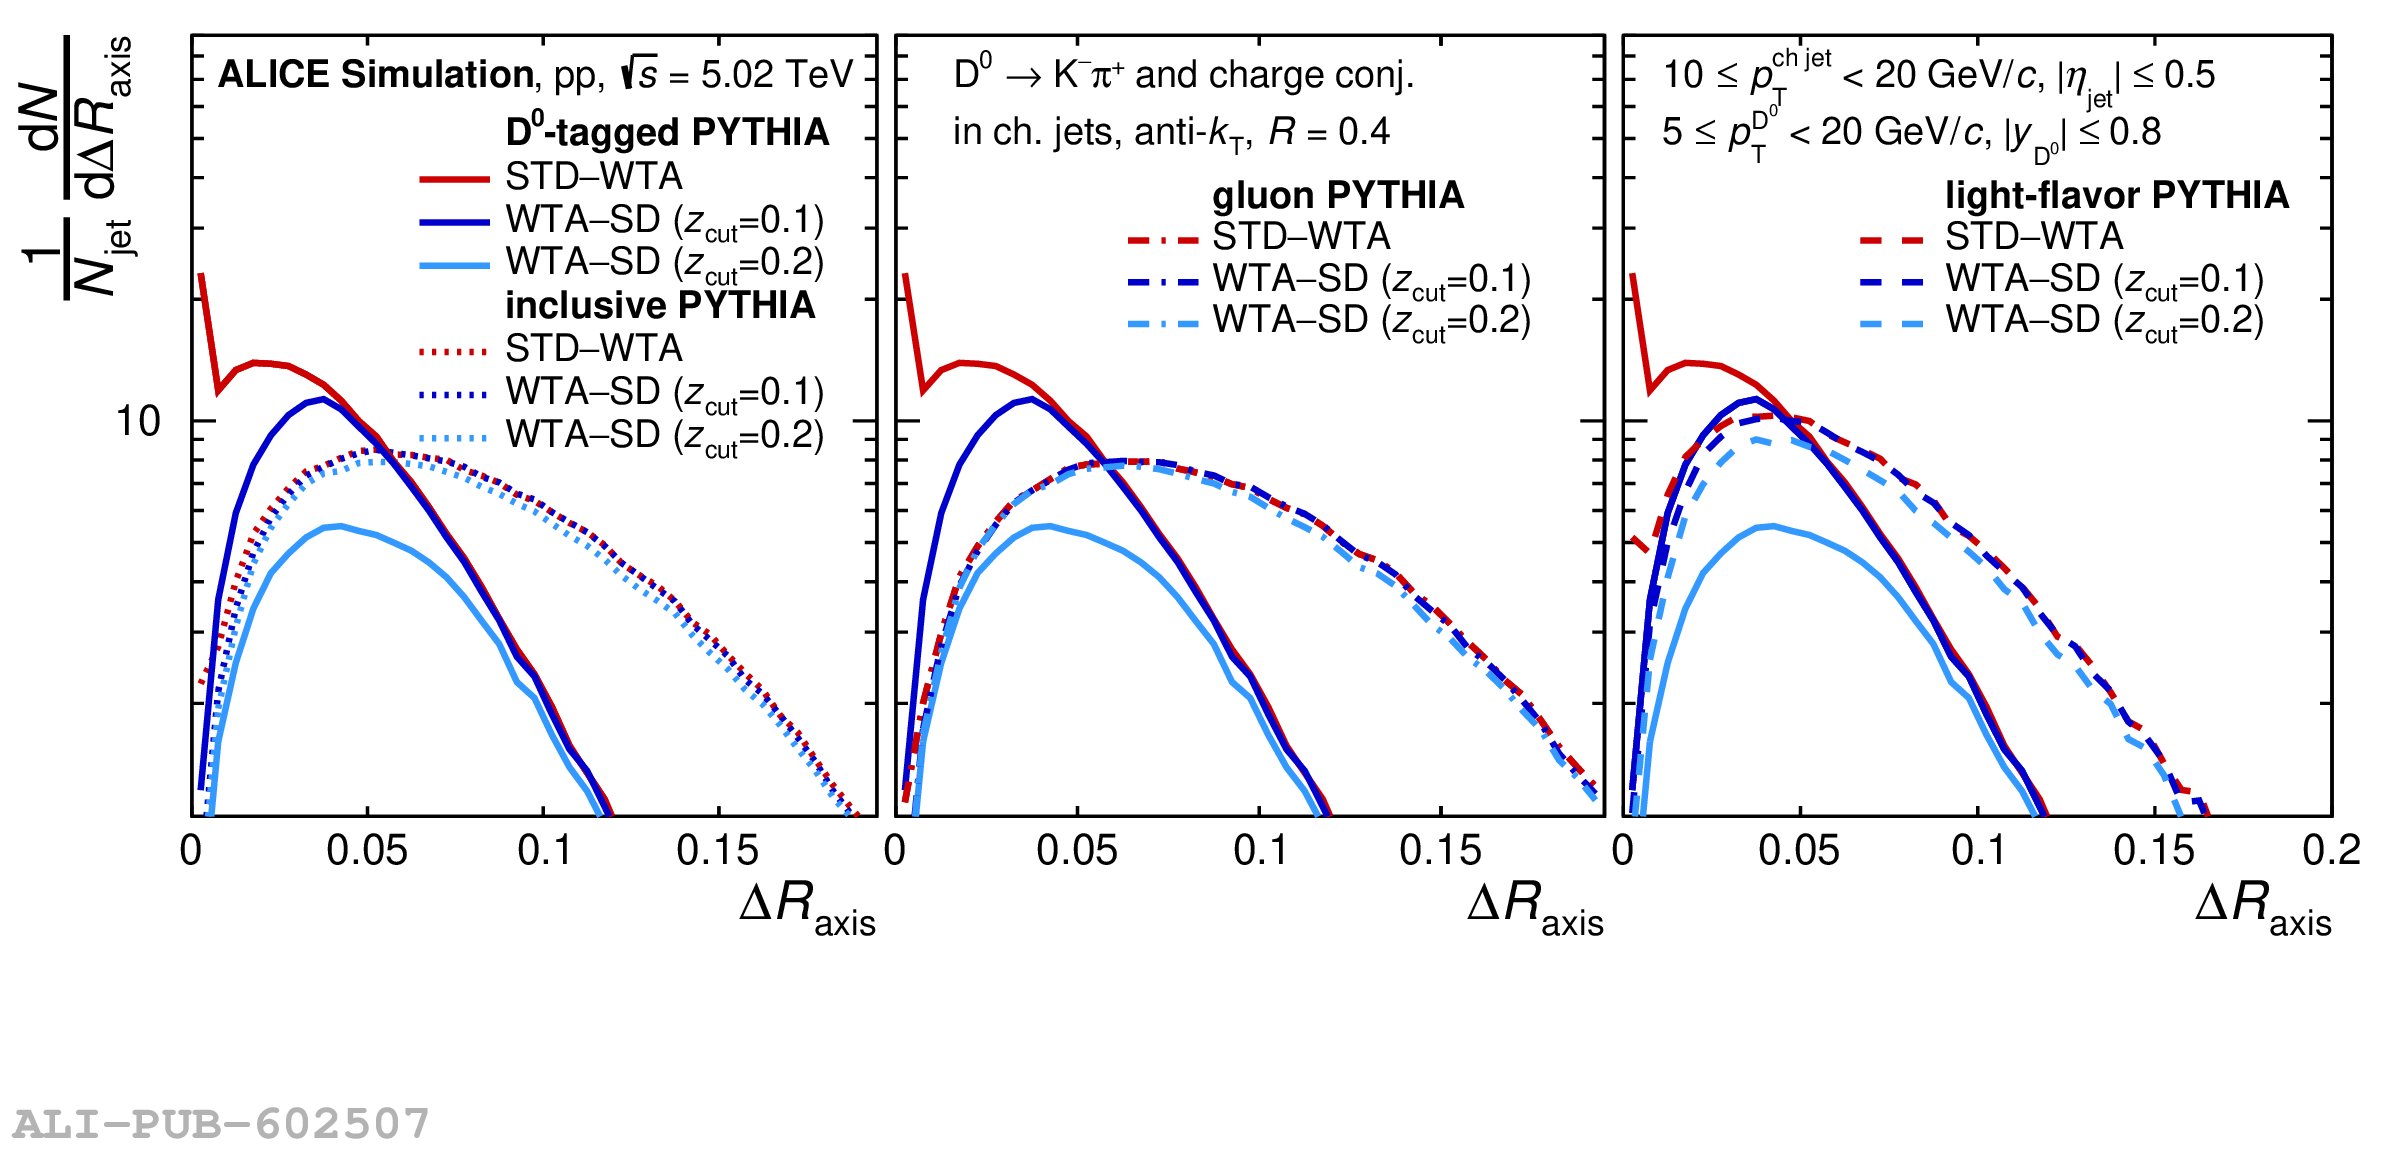 |