Fully unfolded jet axes difference distributions for \deltaR{SD}{\Dzero} (left) and \deltaR{WTA}{SD} (middle), with grooming parameters $\zcut=0.1$ and $\beta=0$, for \jetptrange{10}{20}. Systematic and statistical uncertainties are represented by color boxes and error bars, respectively, and MC event generator comparisons are shown in the bottom panels. The bottom right panel shows a ratio of the two data distributions. | 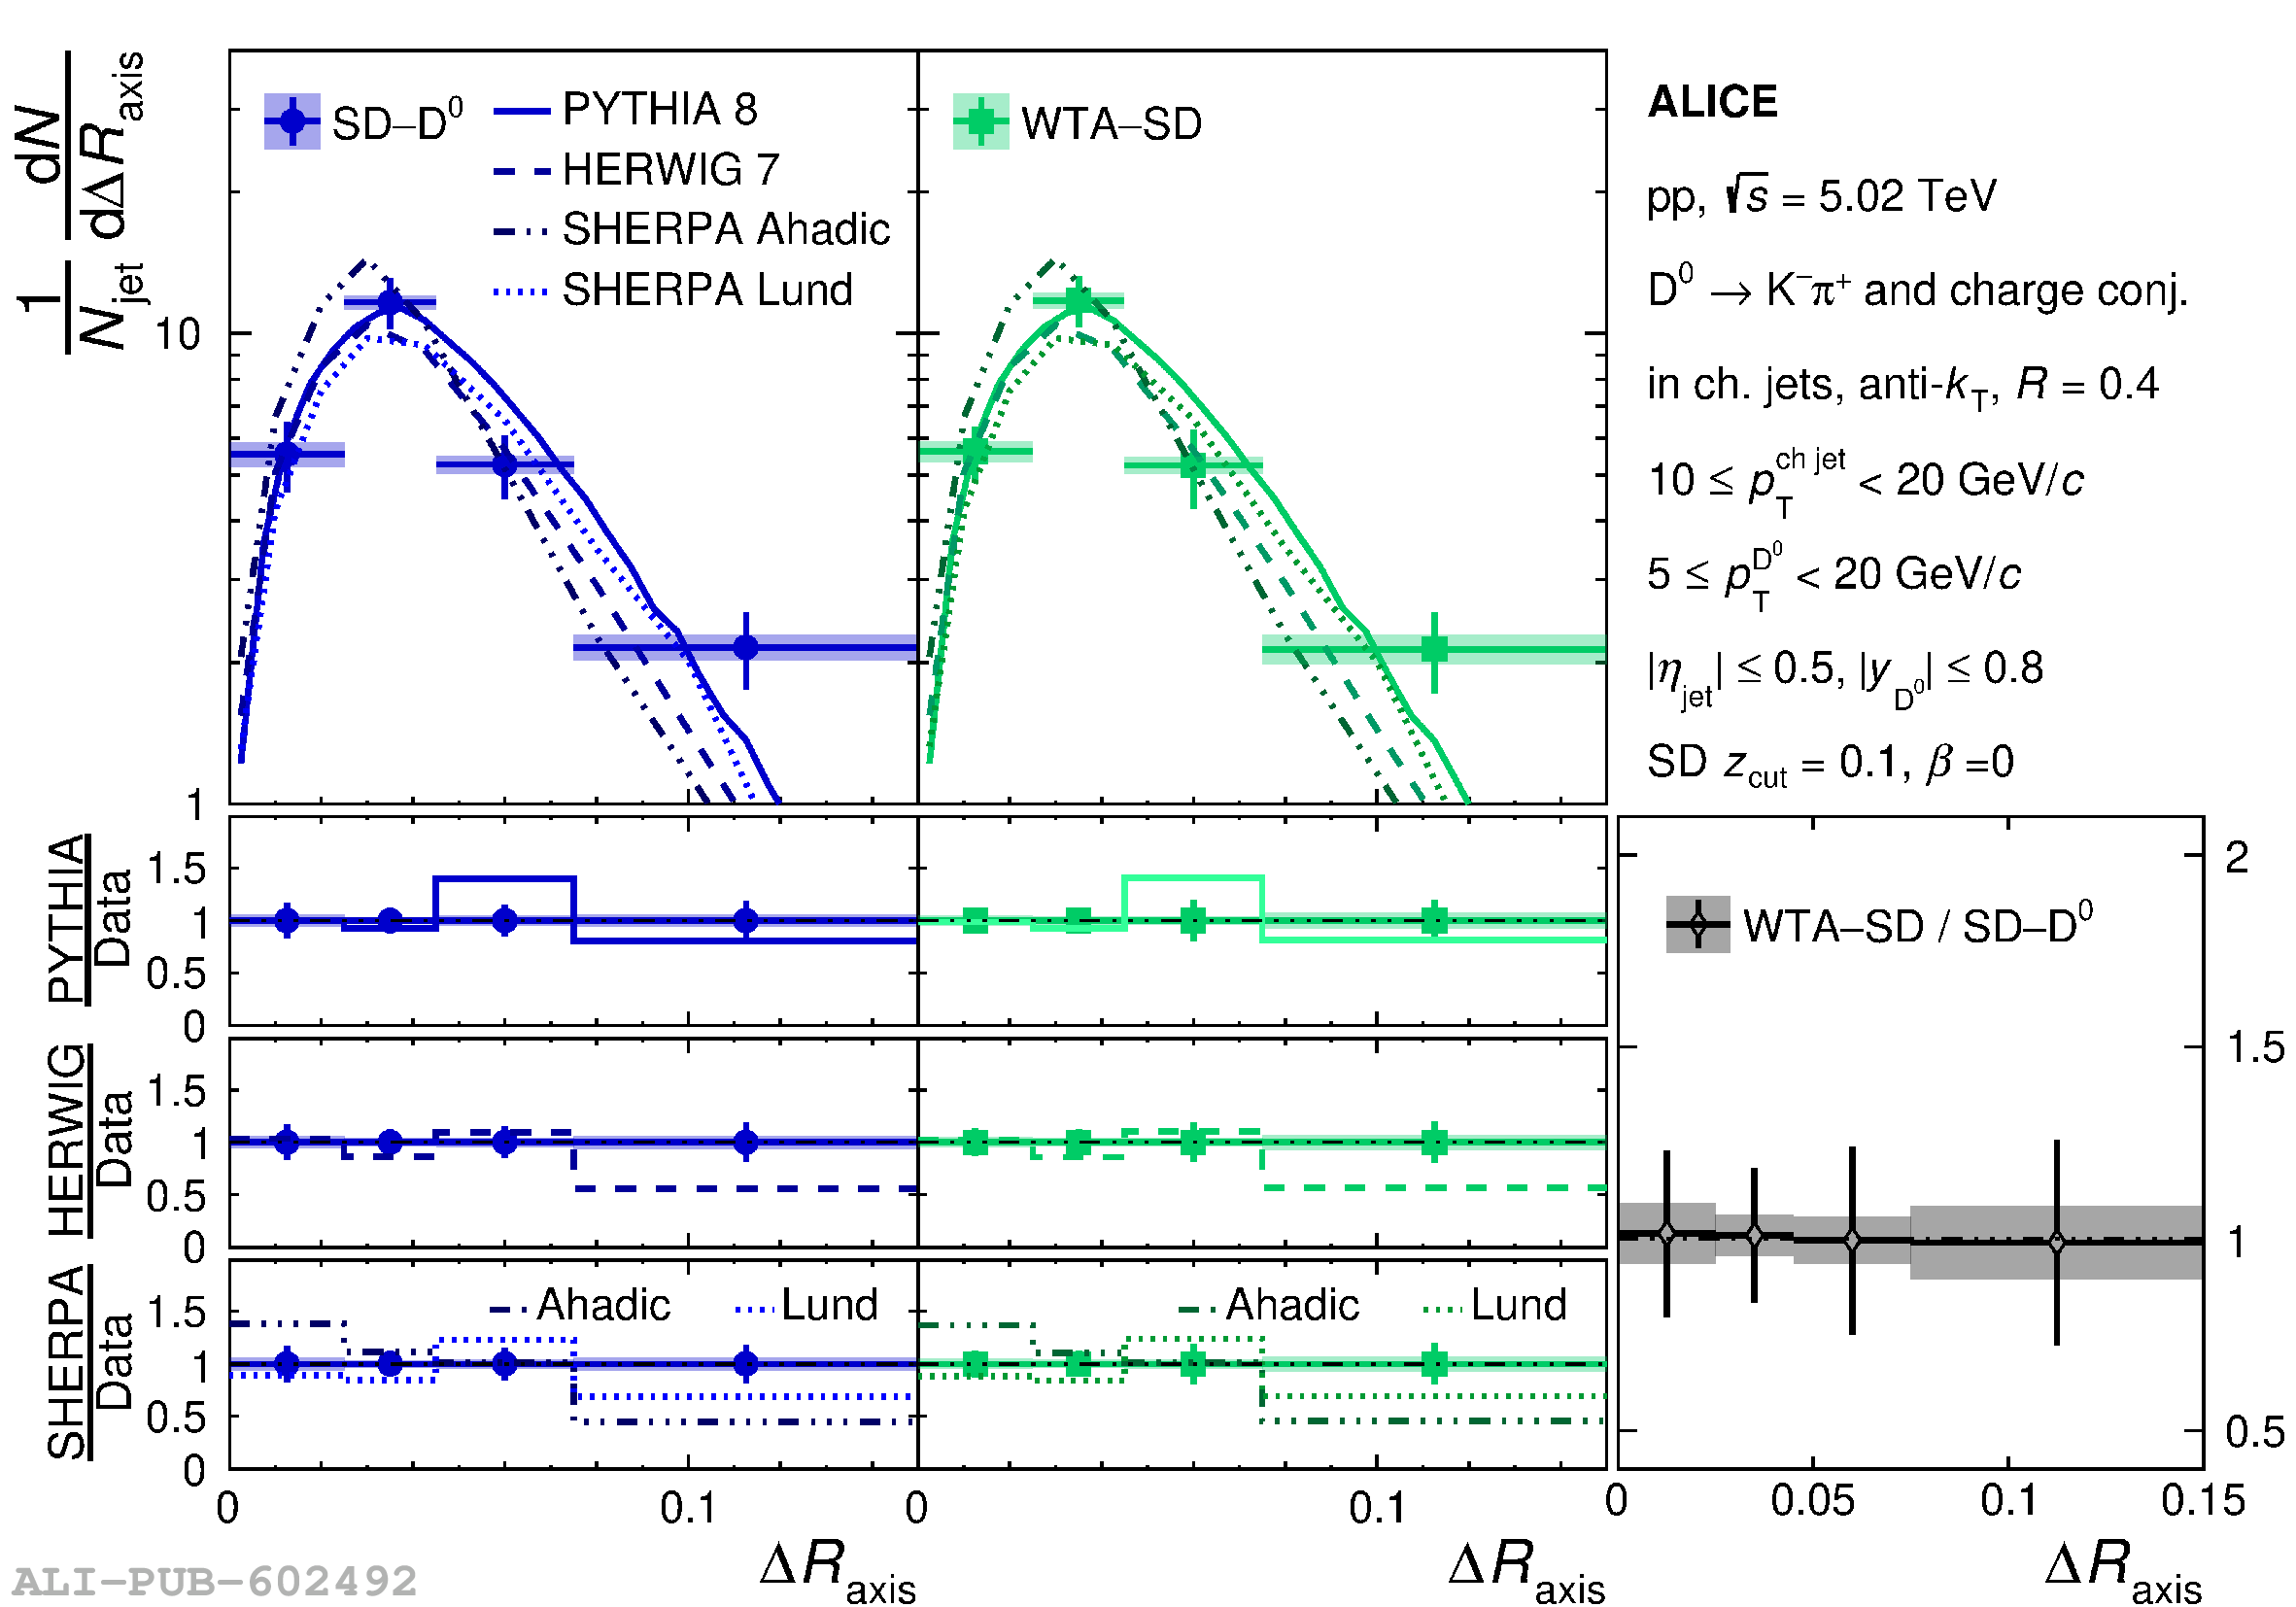 |