Fully unfolded jet axes difference distribution for \deltaR{STD}{\Dzero} (left) and \deltaR{STD}{WTA} (middle) for \jetptrange{10}{20}. Systematic and statistical uncertainties are represented by color boxes and error bars, respectively, and comparisons to MC event generators PYTHIA 8, HERWIG 7, and SHERPA 2 (Ahadic and Lund) are shown in the respective bottom panels. The bottom right panel shows a ratio of the two data distributions. | 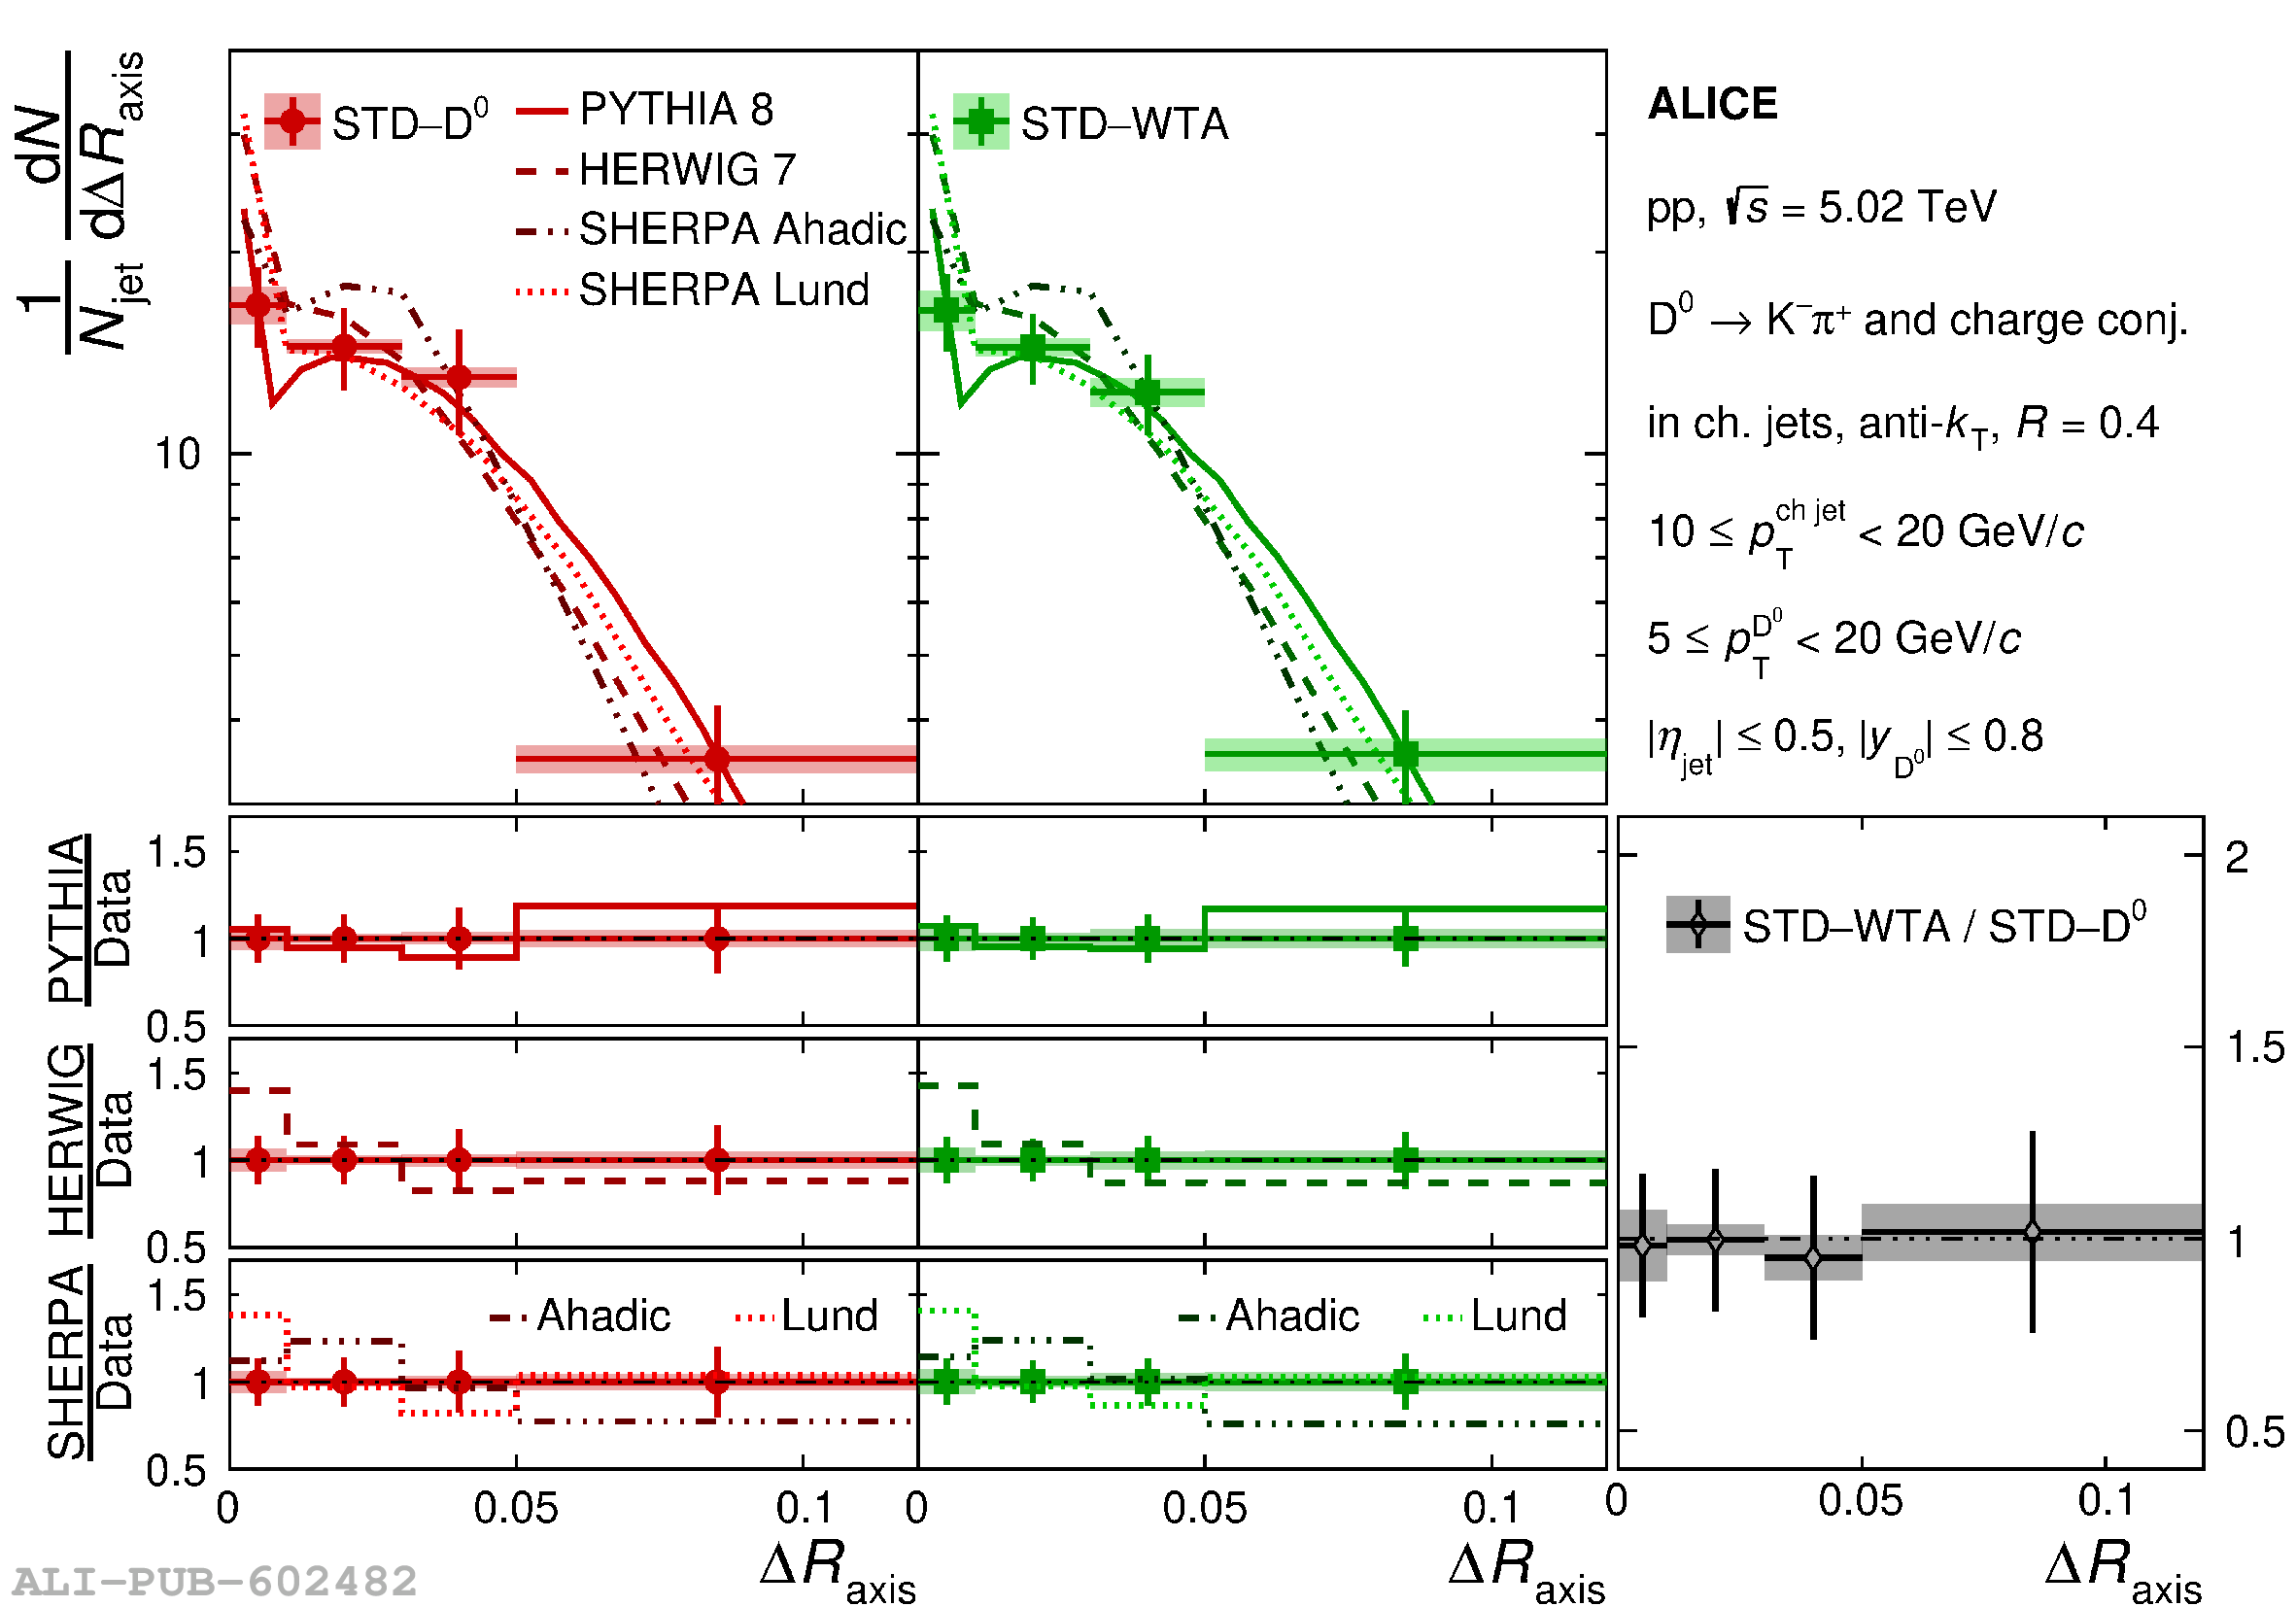 |