Ratio of the simulated non-prompt \Dzero distribution in the detector (detector-level) over the efficiency-corrected data, which includes contributions from the prompt and feed-down \Dzero. The non-prompt \Dzero fraction is shown for \deltaR{STD}{\Dzero} and \deltaR{SD}{\Dzero} ($\zcut=0.1,0.2$ and $\beta=0$). Systematic and statistical uncertainties are represented by the corresponding color boxes and error bars, respectively. | 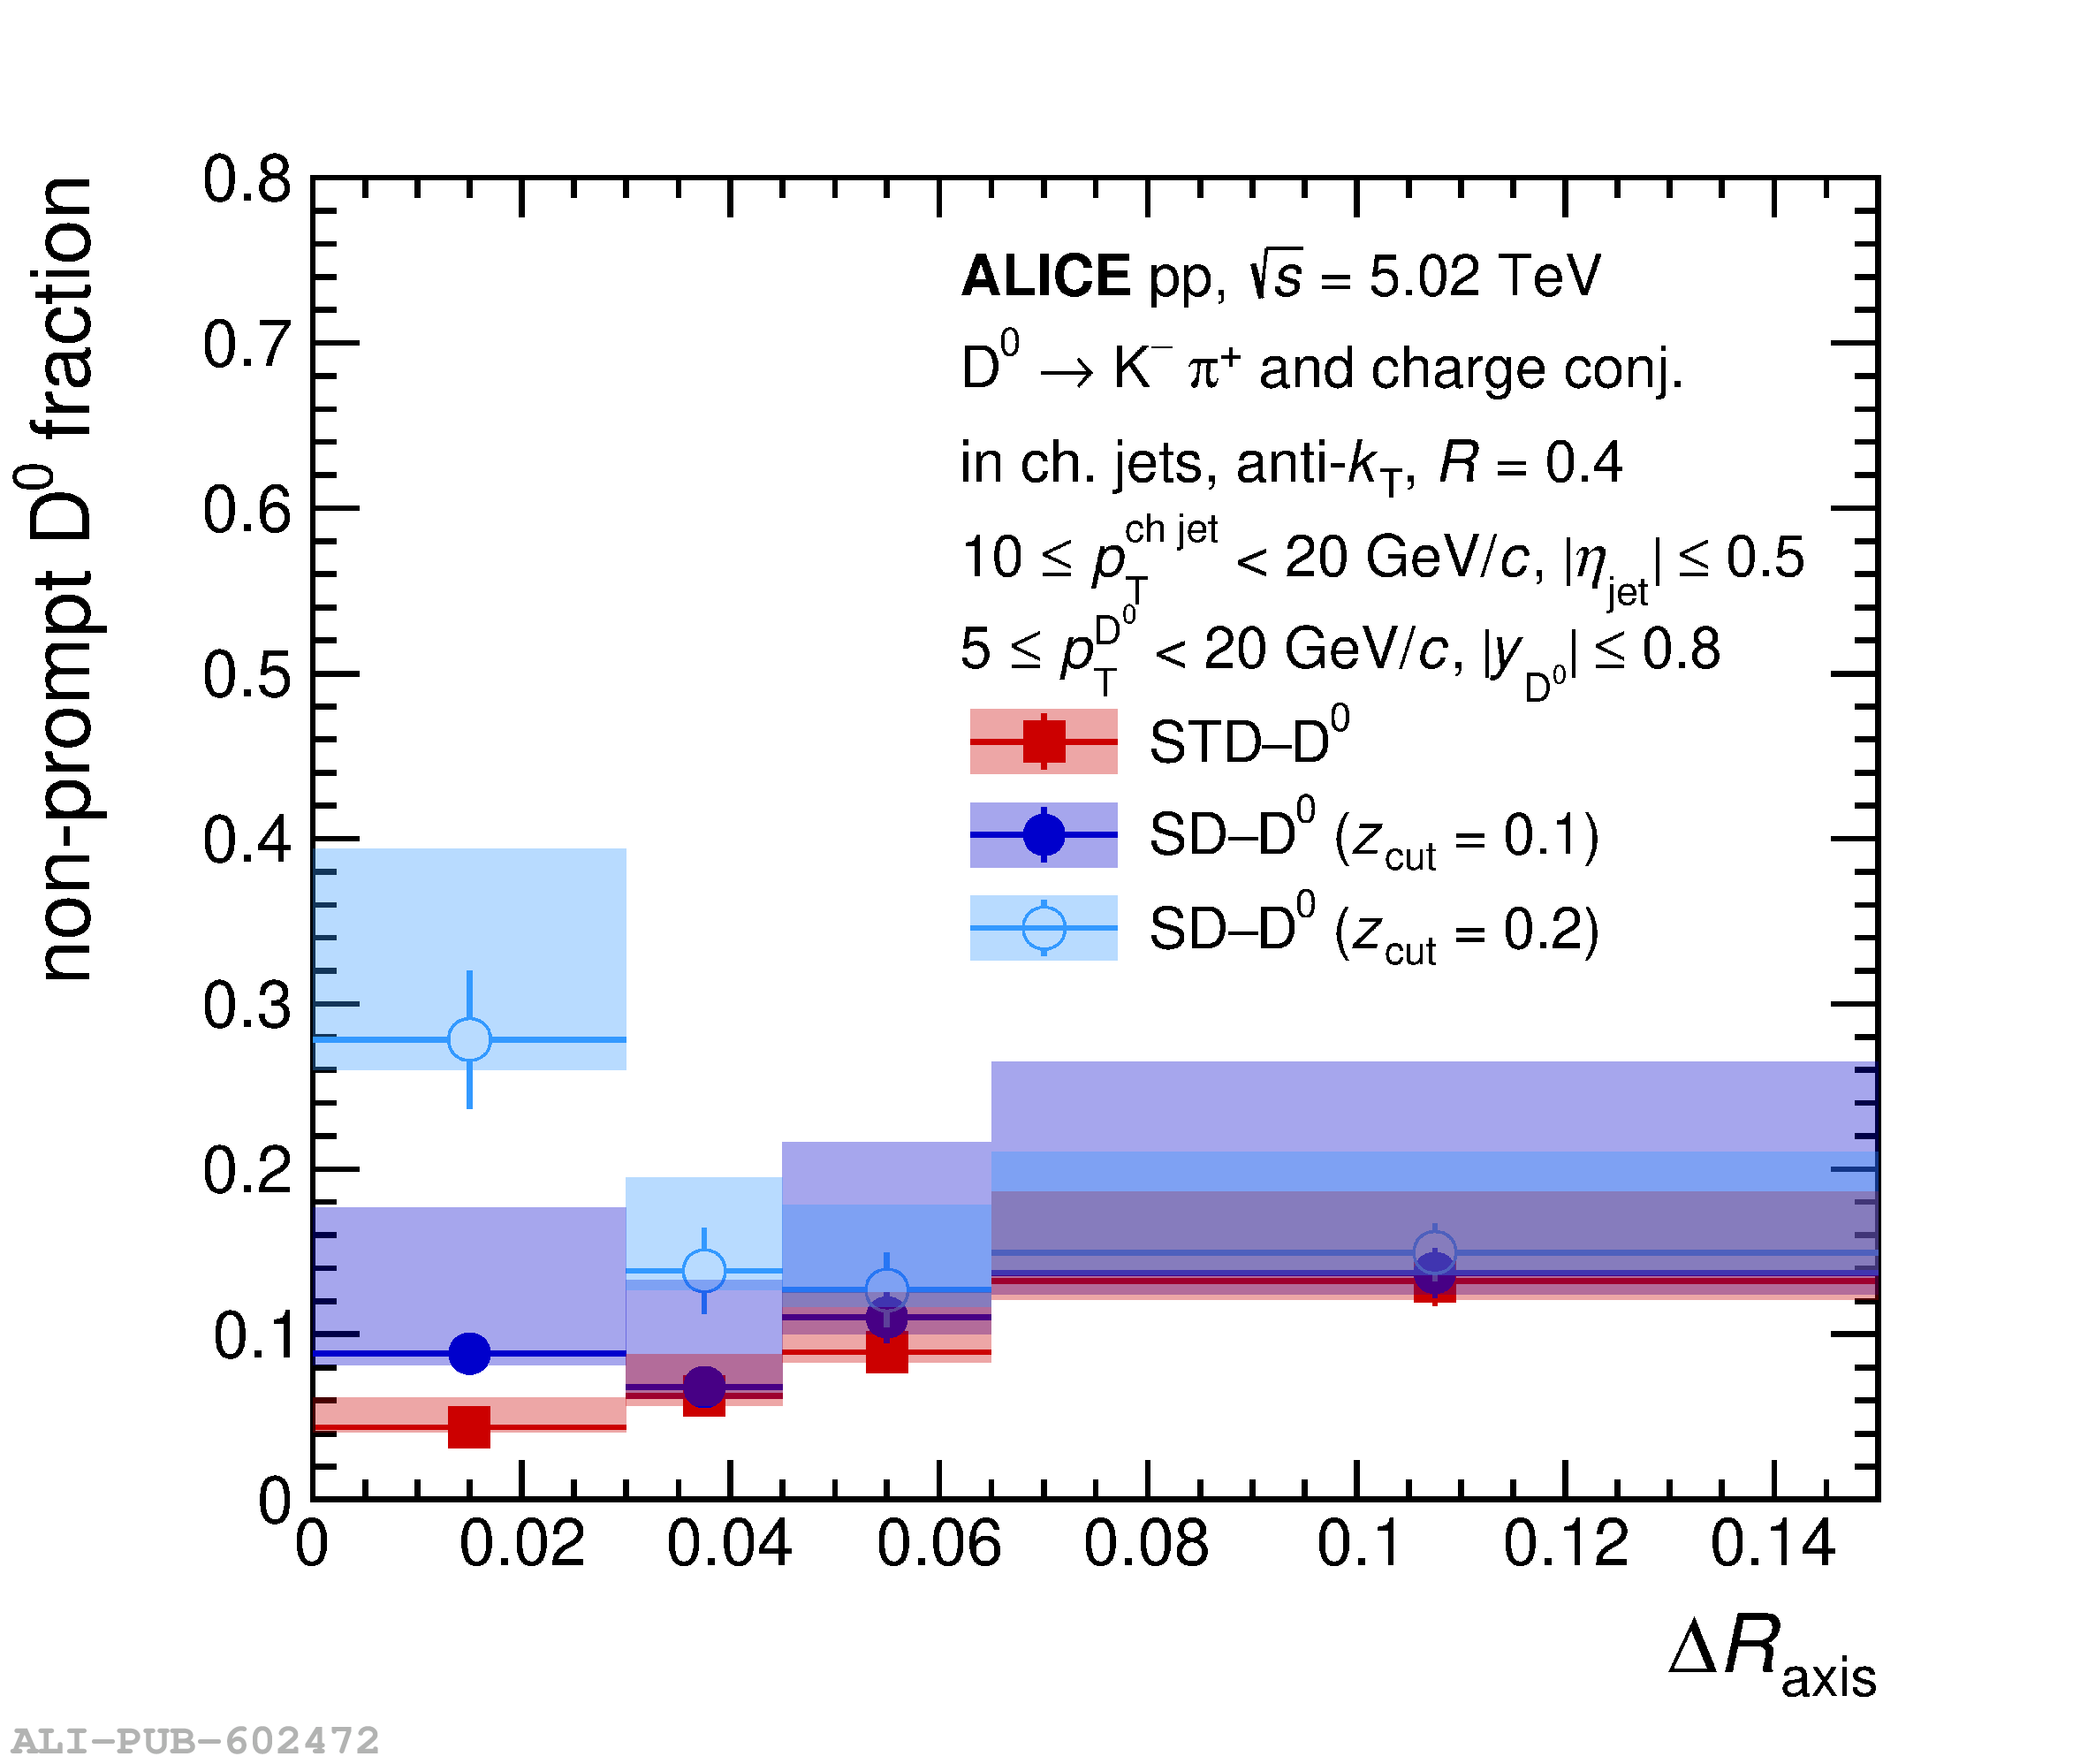 |