Left: the \Dzero-decay candidate invariant-mass distribution for \jetptrange{10}{20} and $8 p_{\rm T}^{\rm D^0} 12$ \GeVc. The total fit function of the signal and background is represented by the blue line. The background fit function is represented by the red line. Right: the raw yields of the \Dzero-tagged jets as a function of \deltaR{STD}{\Dzero} in the signal region and sideband region. | 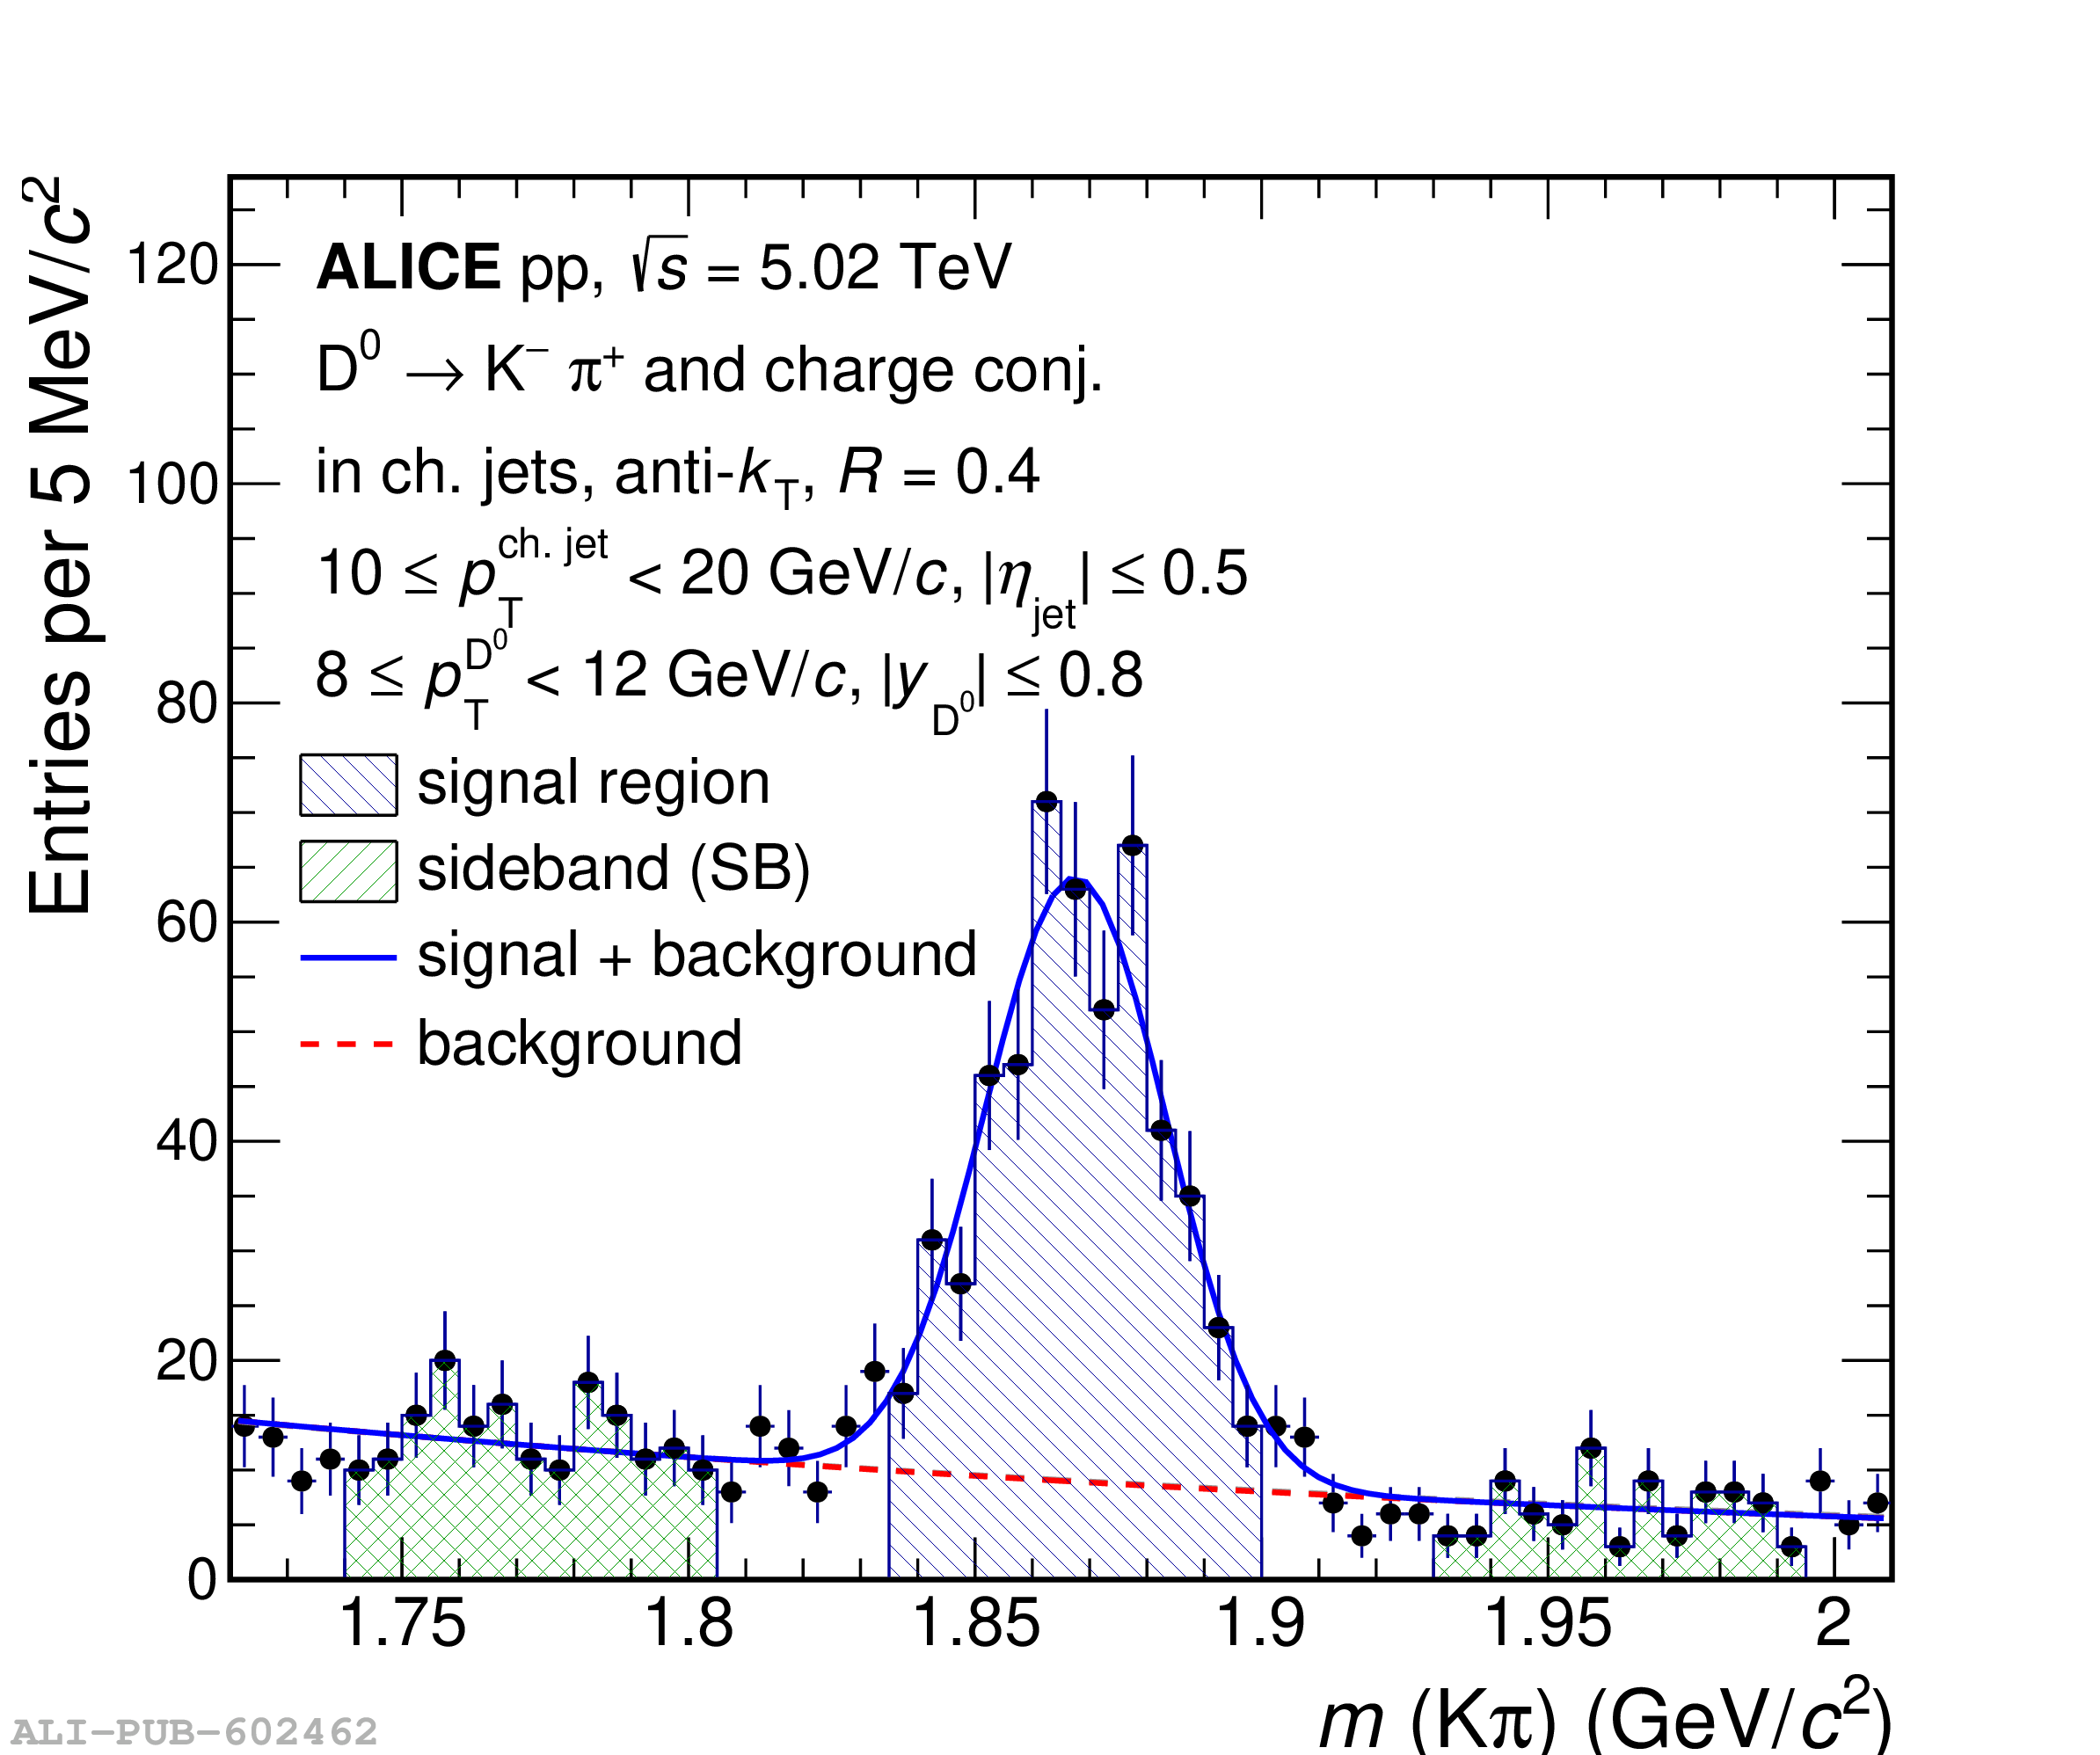 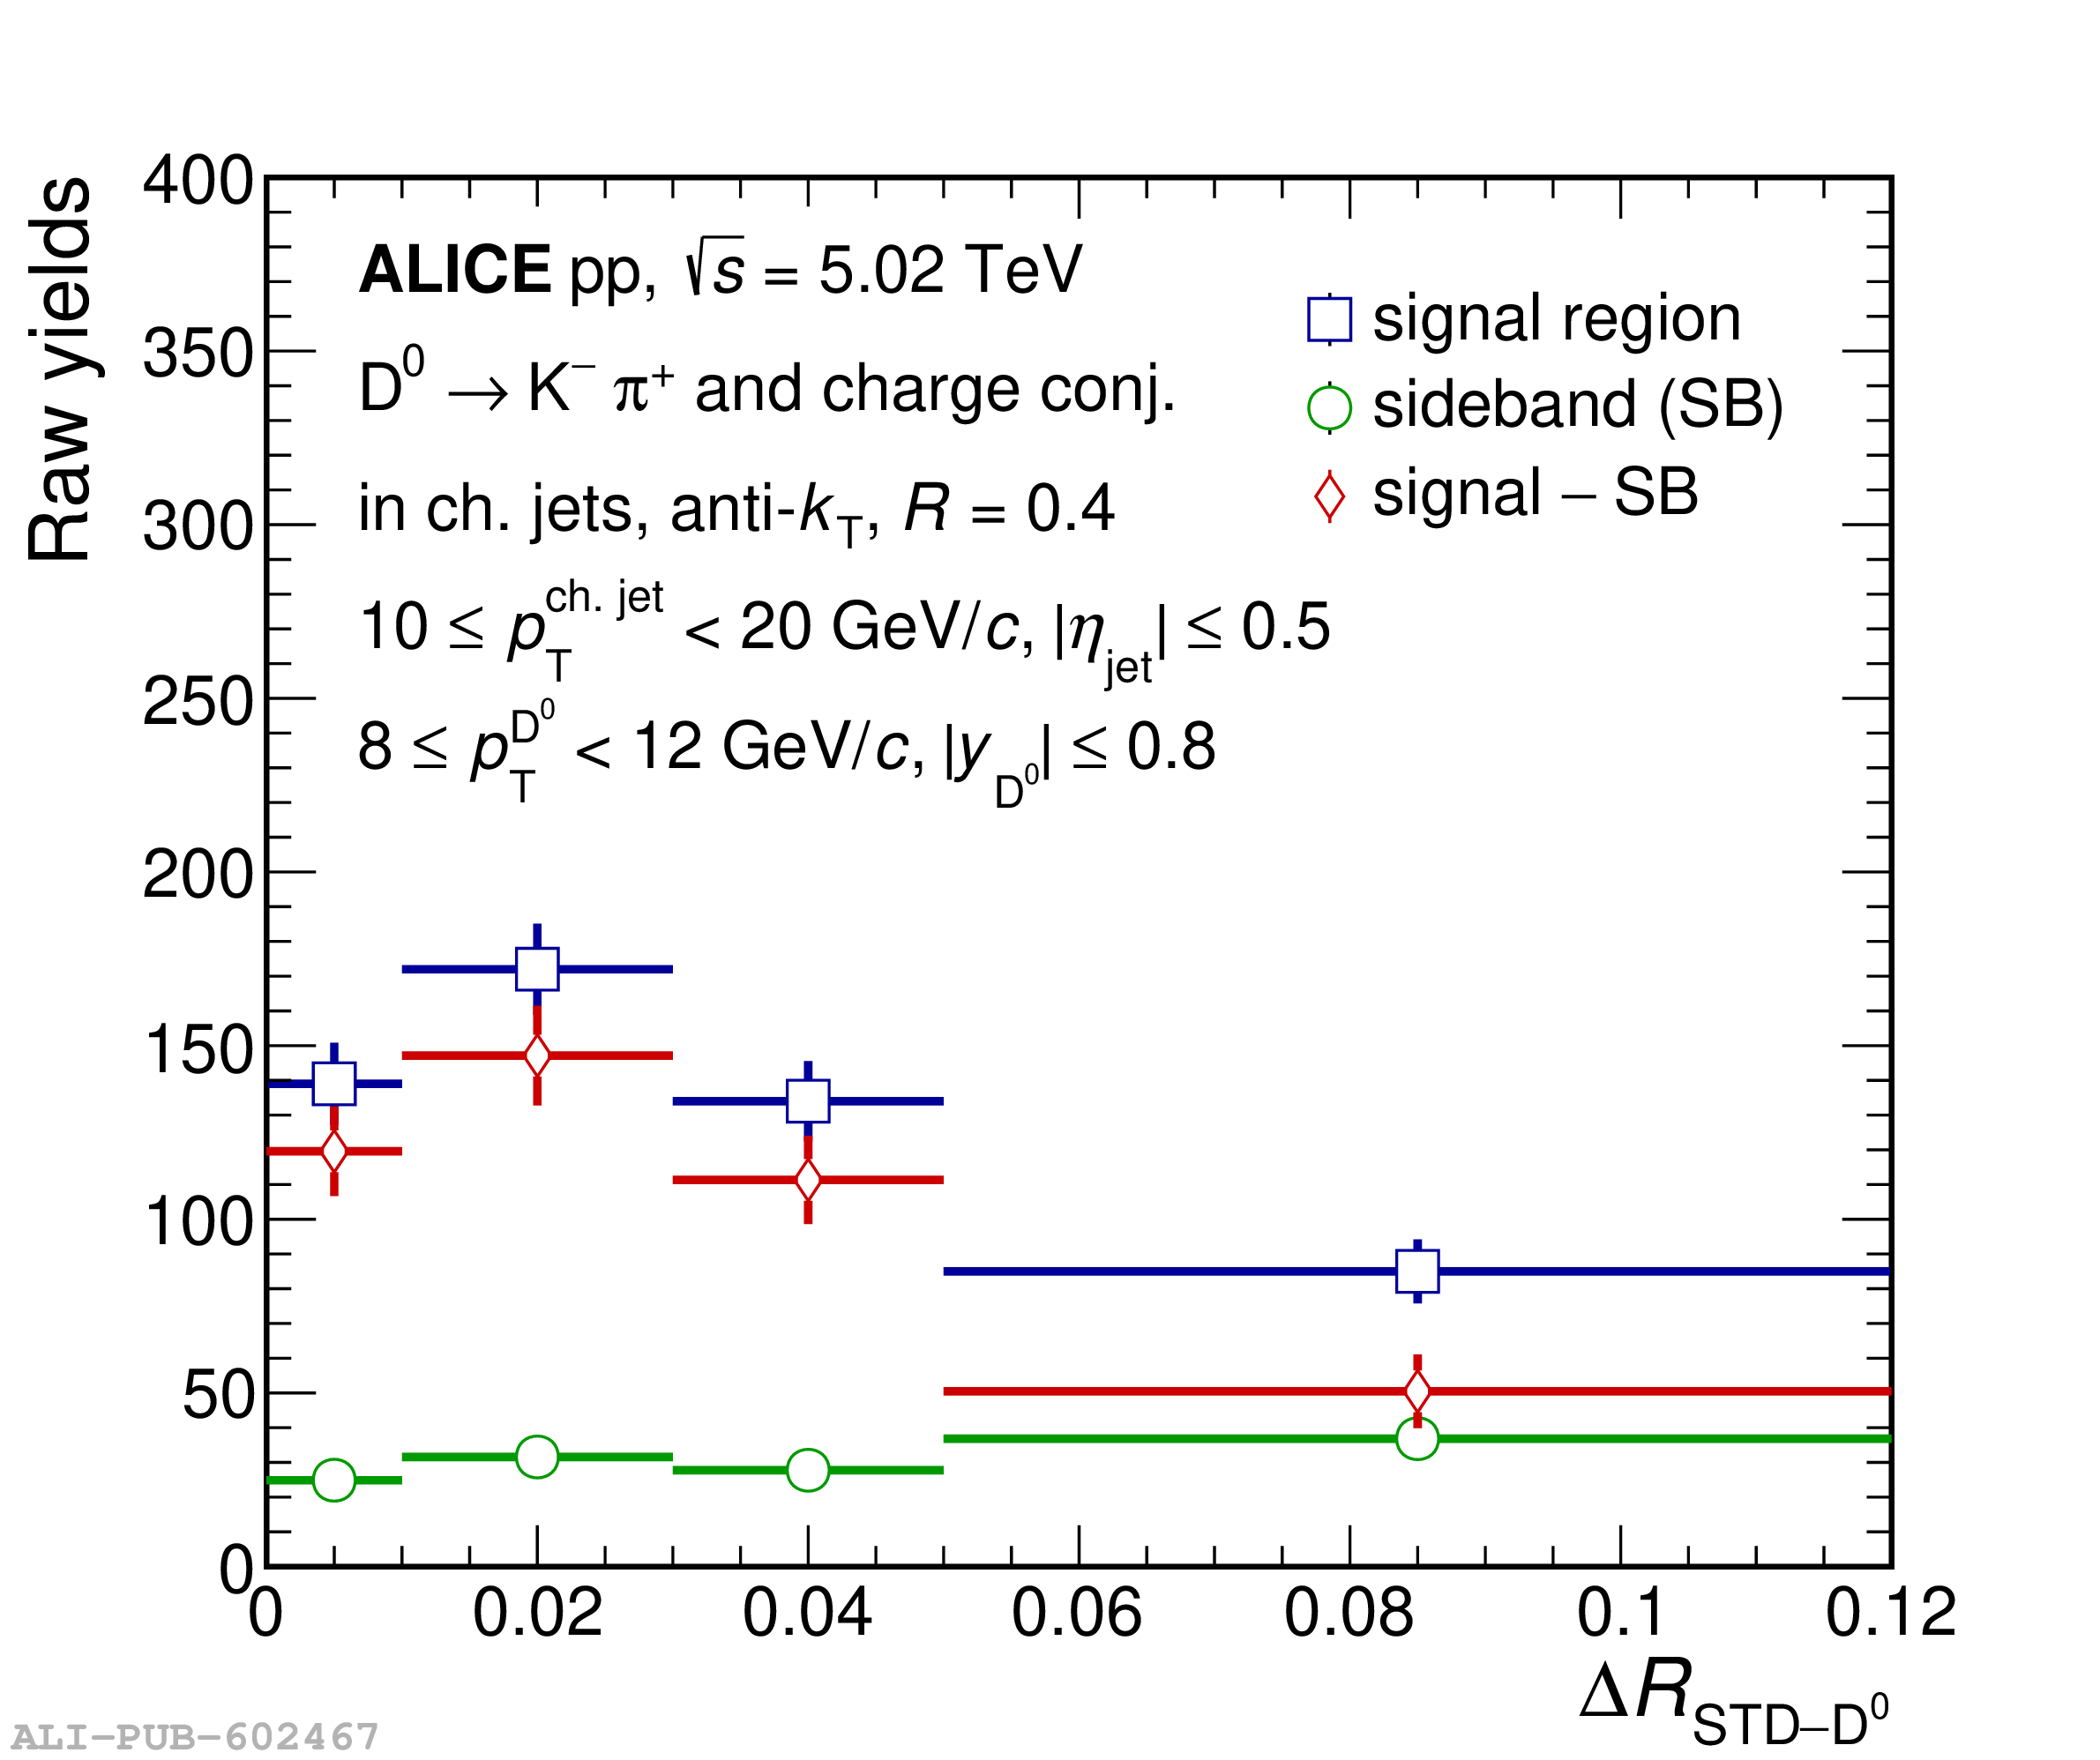 |