The production cross section of electrons from semileptonic decays of beauty hadrons was measured at mid-rapidity (|y| < 0.8) in the transverse momentum range 1 < $p_{\rm T}$ < 8 Gev/c with the ALICE experiment at the CERN LHC in pp collisions at a center of mass energy $\sqrt{s}$ = 7 TeV using an integrated luminosity of 2.2 nb$^{-1}$. Electrons from beauty hadron decays were selected based on the displacement of the decay vertex from the collision vertex. A perturbative QCD calculation agrees with the measurement within uncertainties. The data were extrapolated to the full phase space to determine the total cross section for the production of beauty quark-antiquark pairs.
Phys. Lett. B 721 (2013) 13-23, Phys.Lett. B763 (2016) 507-509 (erratum)
HEP Data
e-Print: arXiv:1208.1902 | PDF | inSPIRE
CERN-PH-EP-2012-229
Figure 1
(a) $d_{\mathrm 0}$ distributions of electrons from beauty and charm hadron decays as well as from decays of light hadrons and from photon conversions obtained from PYTHIA simulations in the electron $\pt$ range $1 < \pt < 6$ Gev/$c$. The distributions were normalized to the same integrated yield. (b) Ratios of the measured and the simulated $d_{\mathrm 0}$ distributions of conversion electrons in the ranges $1 < \pt < 2$ Gev/$c$ and $2 < \pt < 6$ Gev/$c$ (points shifted in $d_{\mathrm 0}$ by 10 $\mu$m for better visibility). | 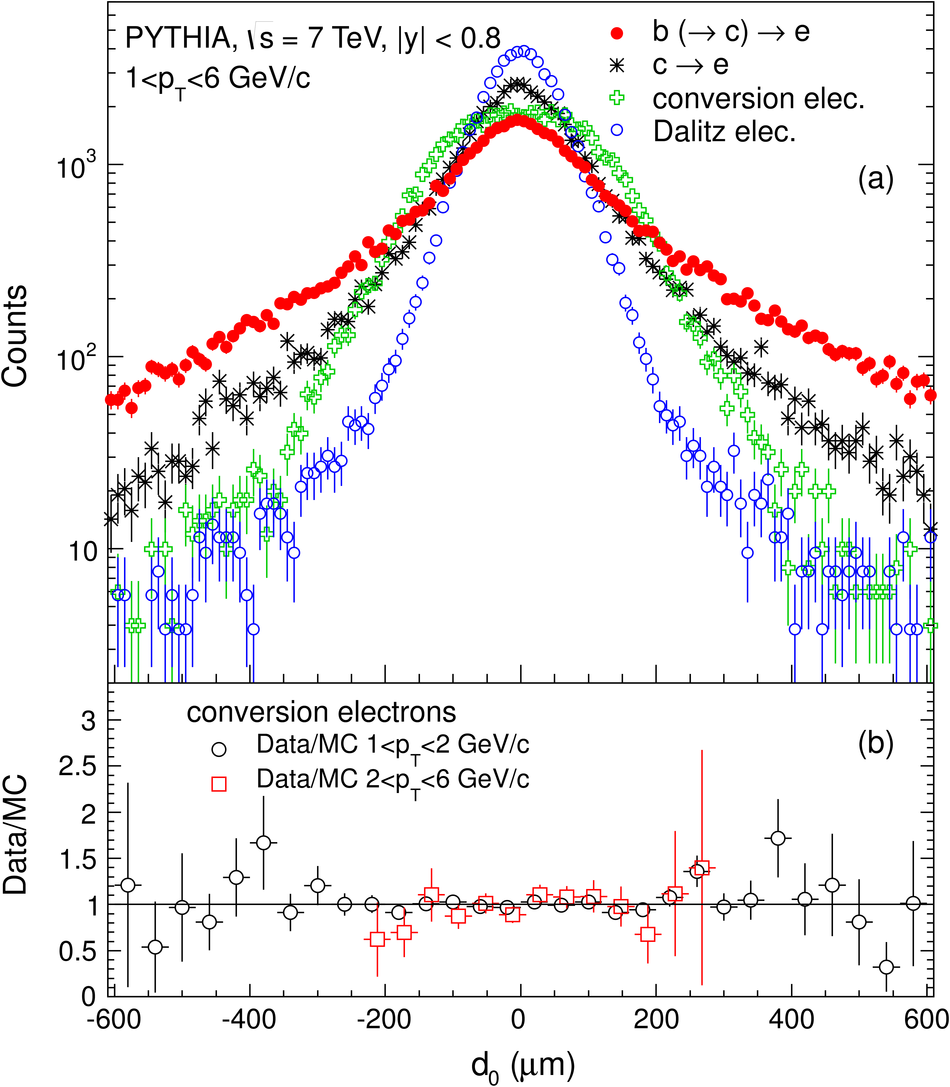 |
Figure 2
(a) Distribution of $d_{\mathrm 0} \times$ charge for electron candidates after all analysis cuts (except that on $d_{\mathrm 0}$) superimposed to the best-fit result. The fit function is defined as the sum of the Monte Carlo $d_{\mathrm 0}$ distribution of beauty electrons and those of electrons from all other sources, the normalizations being the free parameters in the fit. The error bars represent the statistical uncertainties (b) Differences between the data and the best fit result divided by the statistical error. | 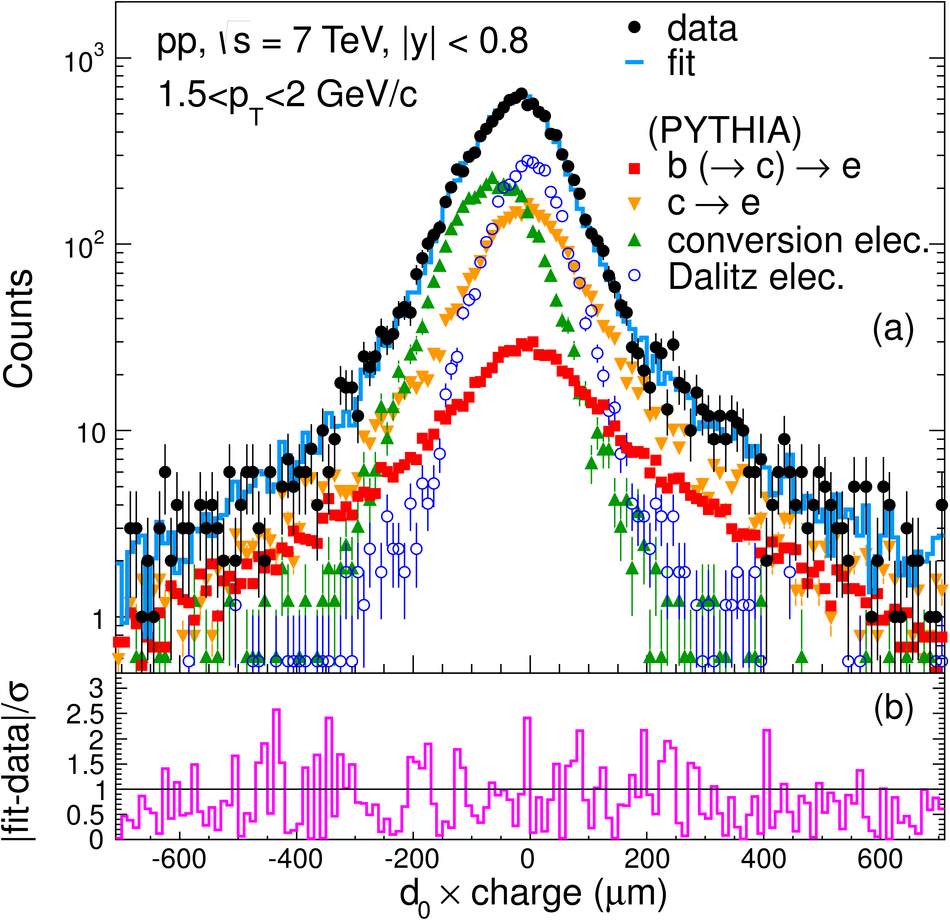 |
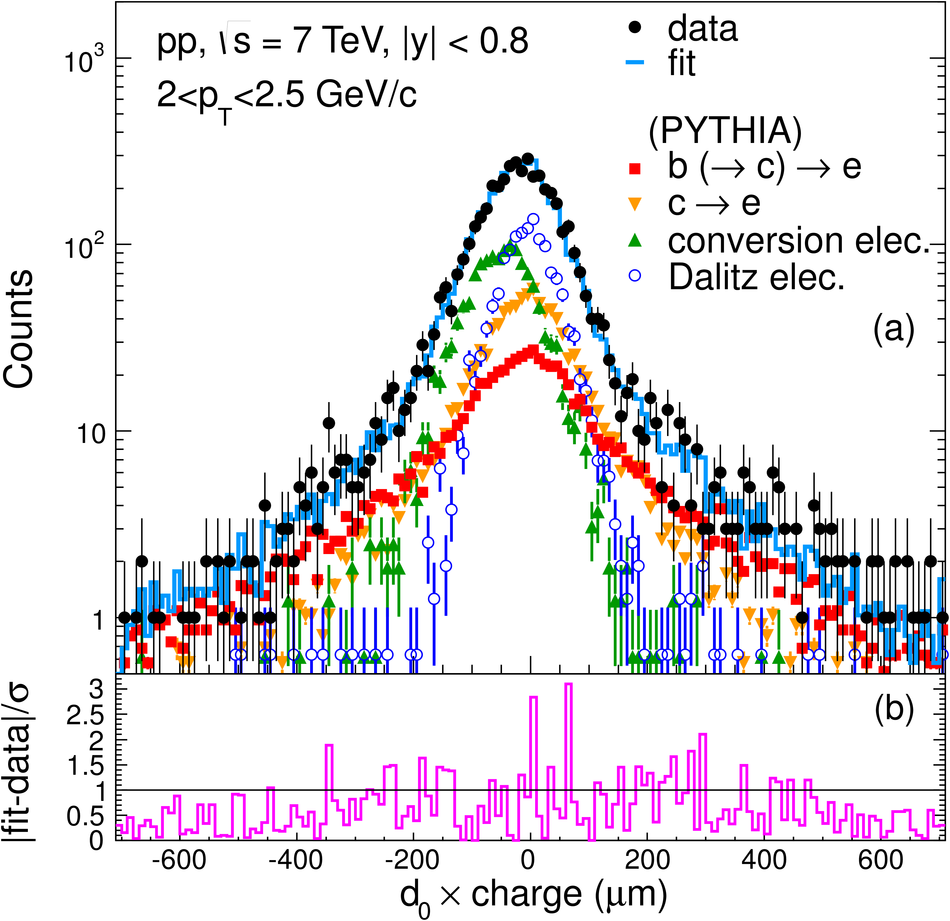
Figure 3
The signal (black solid circle) and the background yields after the application of the track selection criteria including the one on $d_{\mathrm 0}$. The background electrons (red solid line), i.e. the sum of the electrons from charm hadron decays, from Dalitz and dilepton decays of light mesons, and from photon conversions, were subtracted from the inclusive electron spectrum (black open circle). The error bars represent the statistical uncertainties. The symbols are plotted at the center of each bin. | 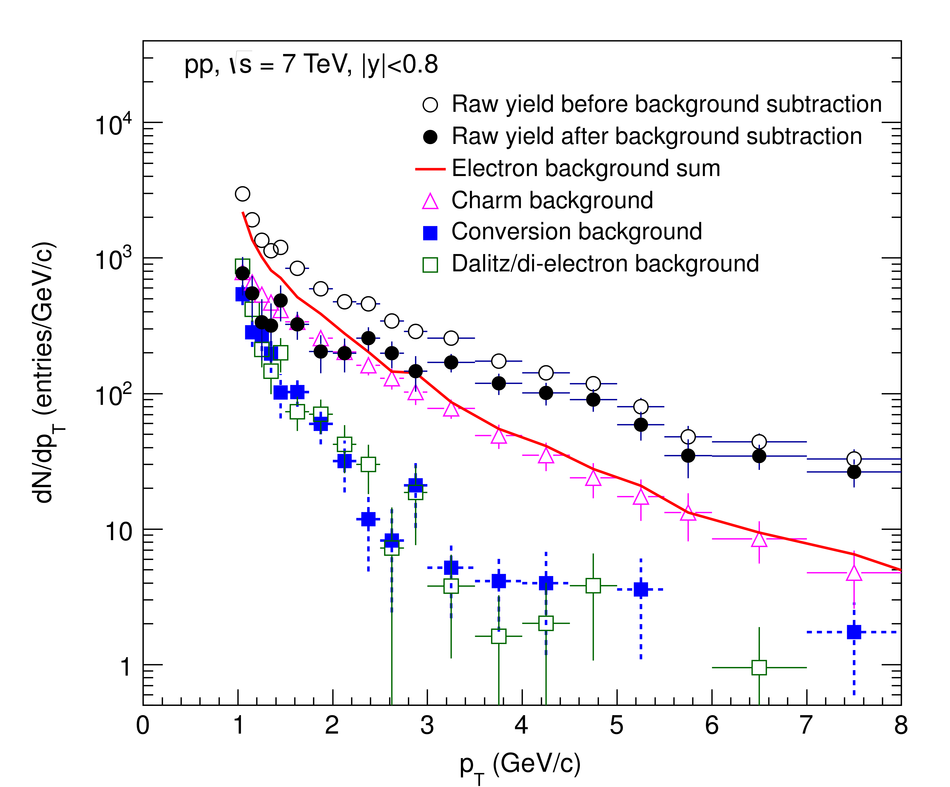 |
Figure 4
Invariant cross sections of electrons from beauty hadron decays measured directly via the transverse impact parameter method and indirectly via subtracting the calculated charm hadron decay contribution from the measured heavy-flavor hadron decay electron spectrum. The error bars (boxes) represent the statistical (systematic) uncertainties. | 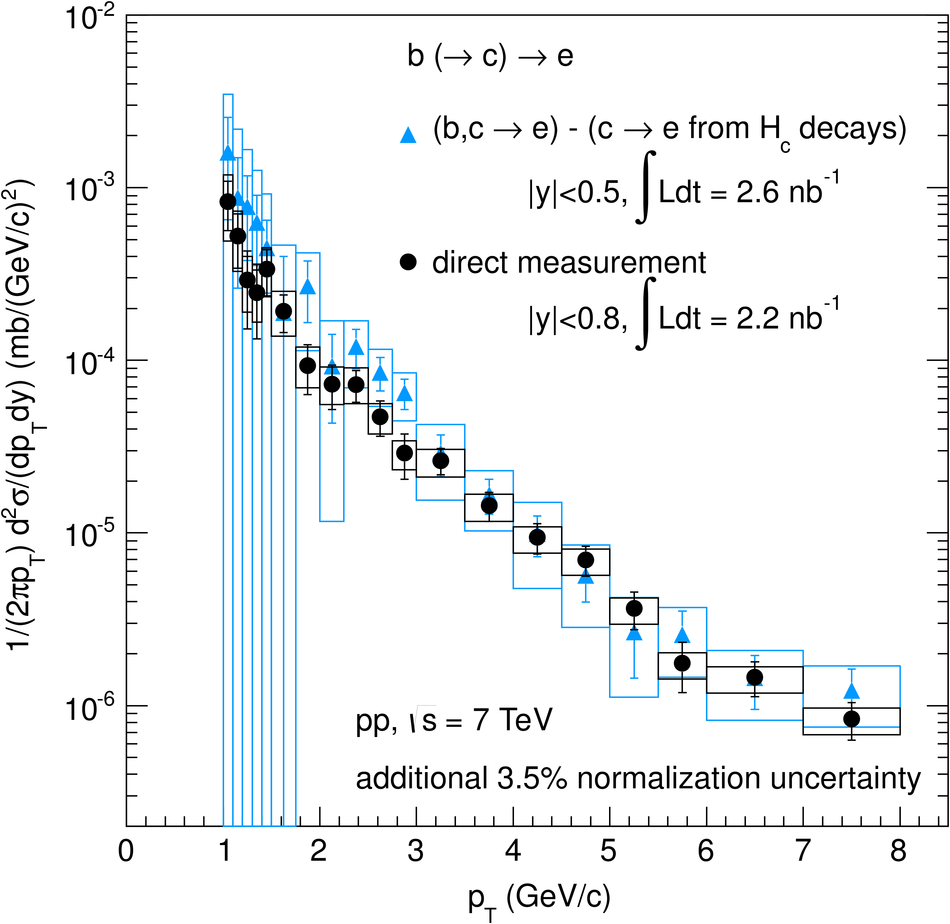 |
Figure 5
(a) $\pt$-differential invariant cross sections of electrons from beauty and from charm hadron decays. The error bars (boxes) represent the statistical (systematic) uncertainties. The solid (dashed) lines indicate the corresponding FONLL predictions (uncertainties). Ratios of the data and the FONLL calculations are shown in (b) and (c) for electrons from beauty and charm hadron decays, respectively, where the dashed lines indicate the FONLL uncertainties. (d) Measured ratio of electrons from beauty and charm hadron decays with error boxes depicting the total uncertainty. | 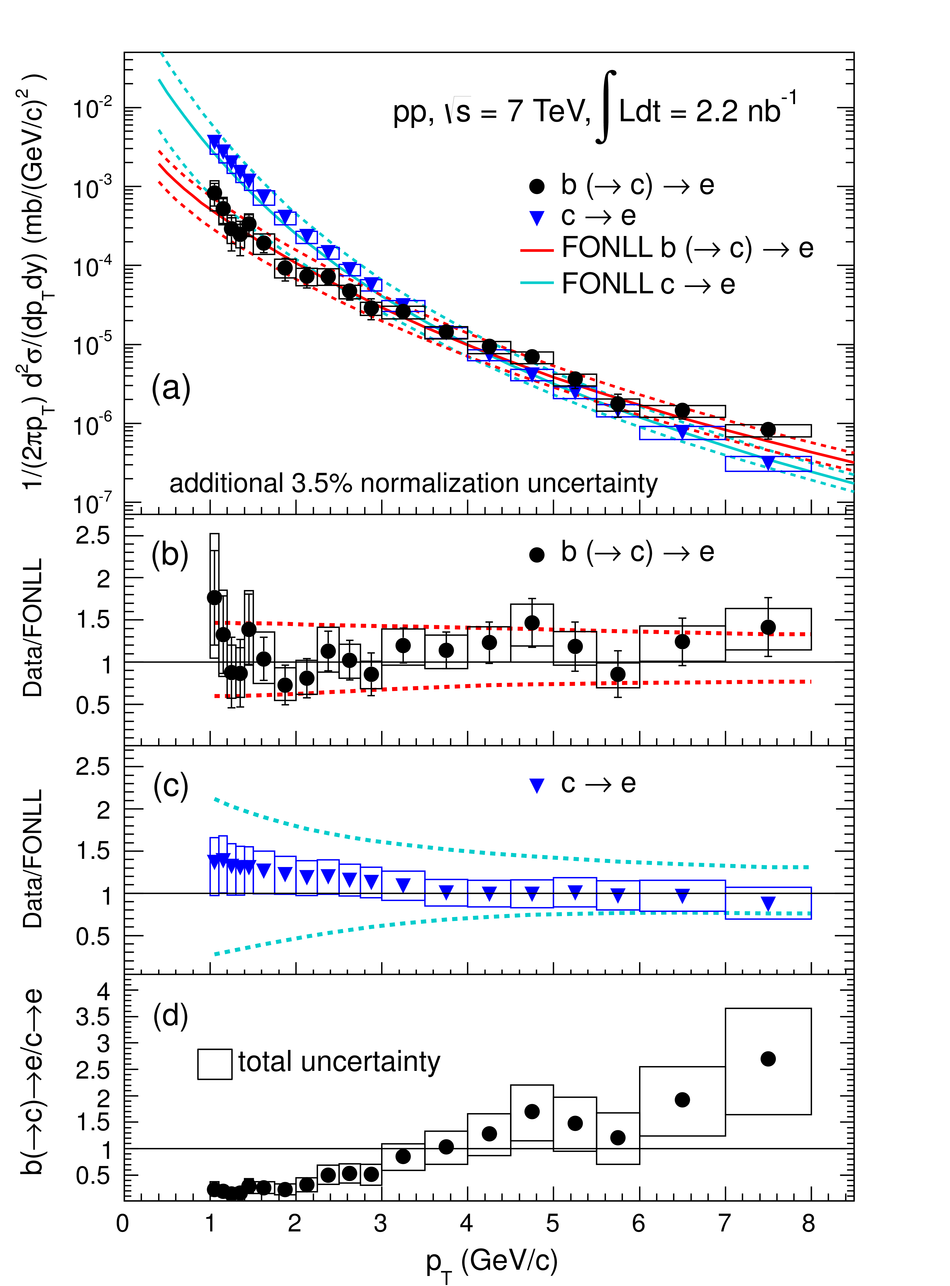 |