A signal consistent with the $Ω$(2012) baryon has been observed with a significance of $15σ$ in pp collisions at $\sqrt{s}=13$ TeV at the LHC. In this paper, the analysis technique is described and measurements of the mass and width of the $Ω$(2012) are reported, along with the first measurement of its transverse-momentum spectrum and yield. This paper corroborates the observation by Belle of this excited $Ω$ state and the observation that the $Ω$(2012) has a rather narrow width for a strongly decaying resonance. The yield measurement is combined with a statistical thermal model calculation of strange baryon yield ratios to obtain estimates of the $Ω{\rm (2012)}^{-} \rightarrow Ξ\overline{\rm K}$ branching ratios. These results will improve our understanding of the internal structure and mass spectrum of excited baryon states and serve as a baseline for searches regarding modifications of these properties in high-temperature media.
Phys. Rev. D 112 (2025) 9, 092002
HEP Data
e-Print: arXiv:2502.18063 | PDF | inSPIRE
CERN-EP-2025-027
Figure group
Figure 1
Invariant-mass distributions of $\Xi$K$^0_{\rm s}$ pairs with $p_{\rm T} >2.5$ GeV/$c$ and $|y|< 0.8$ in HM-triggered pp collisions at $\sqrt{s}=13$ TeV. (a) Same-event distribution plotted with normalized mixed-event combinatorial background. (b) Background-subtracted distribution fitted with residual background polynomial and Voigt peak. (c) Same-event distribution fitted with summed background function and Voigt peak. | 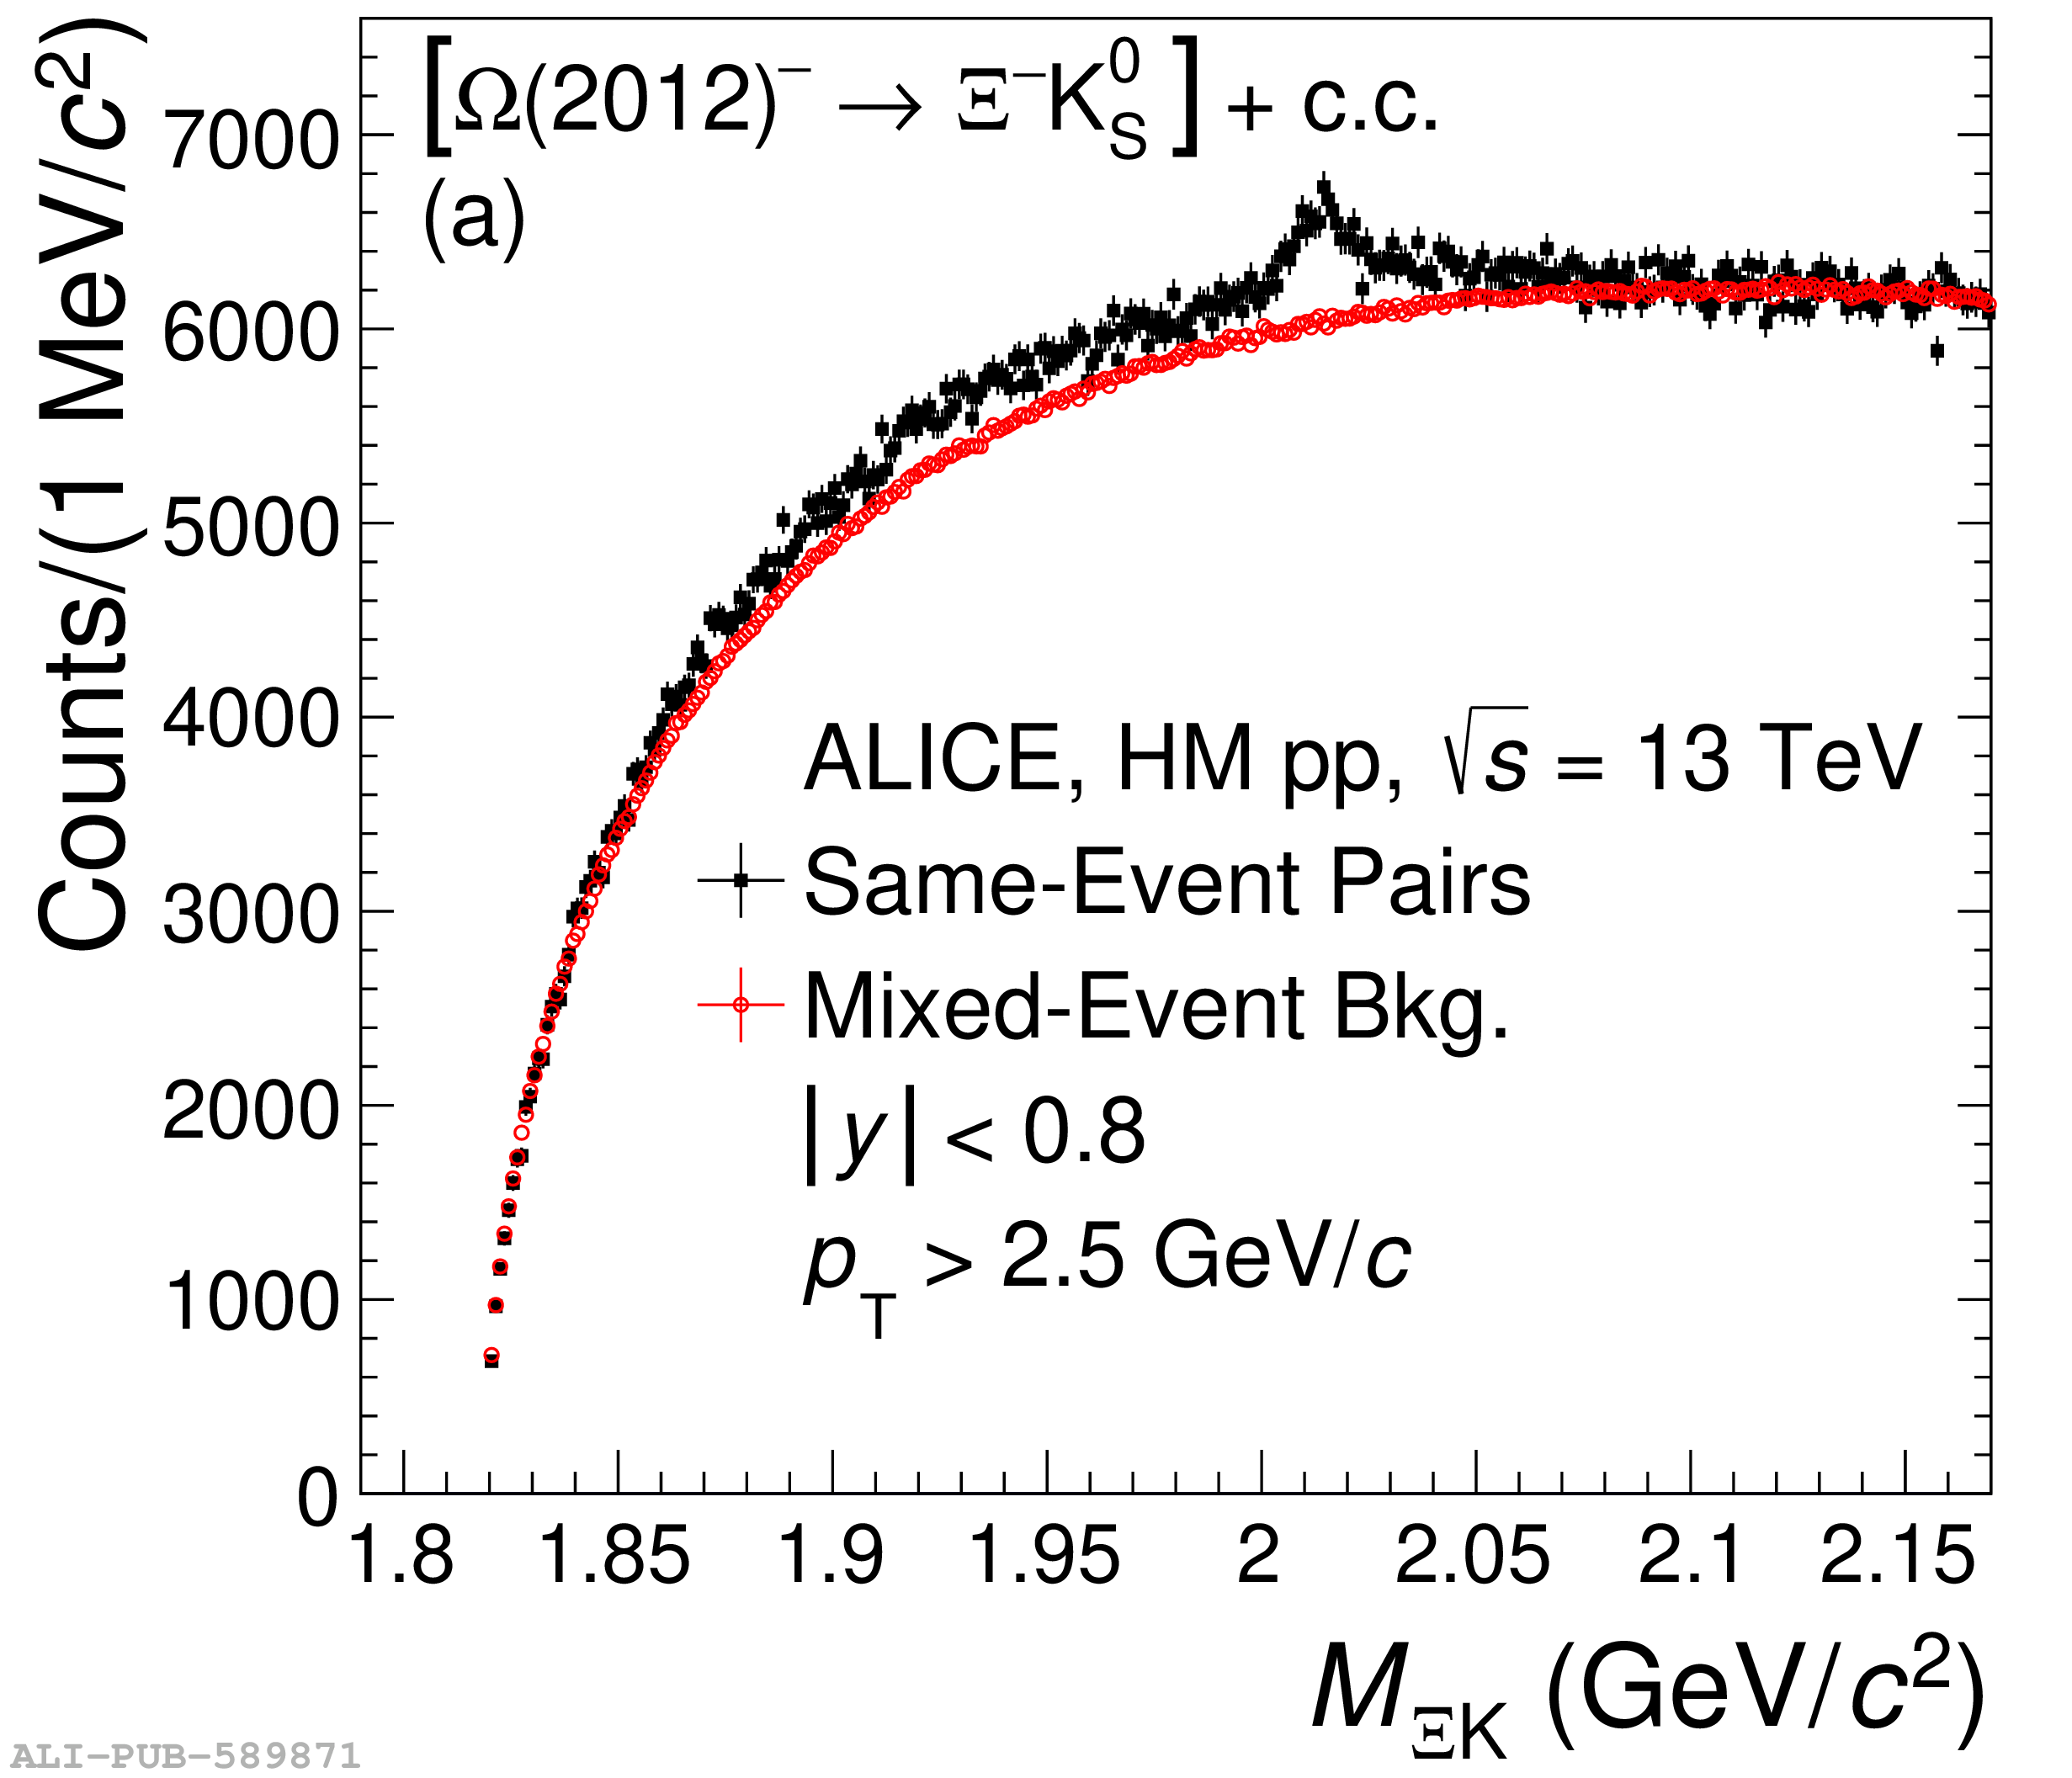 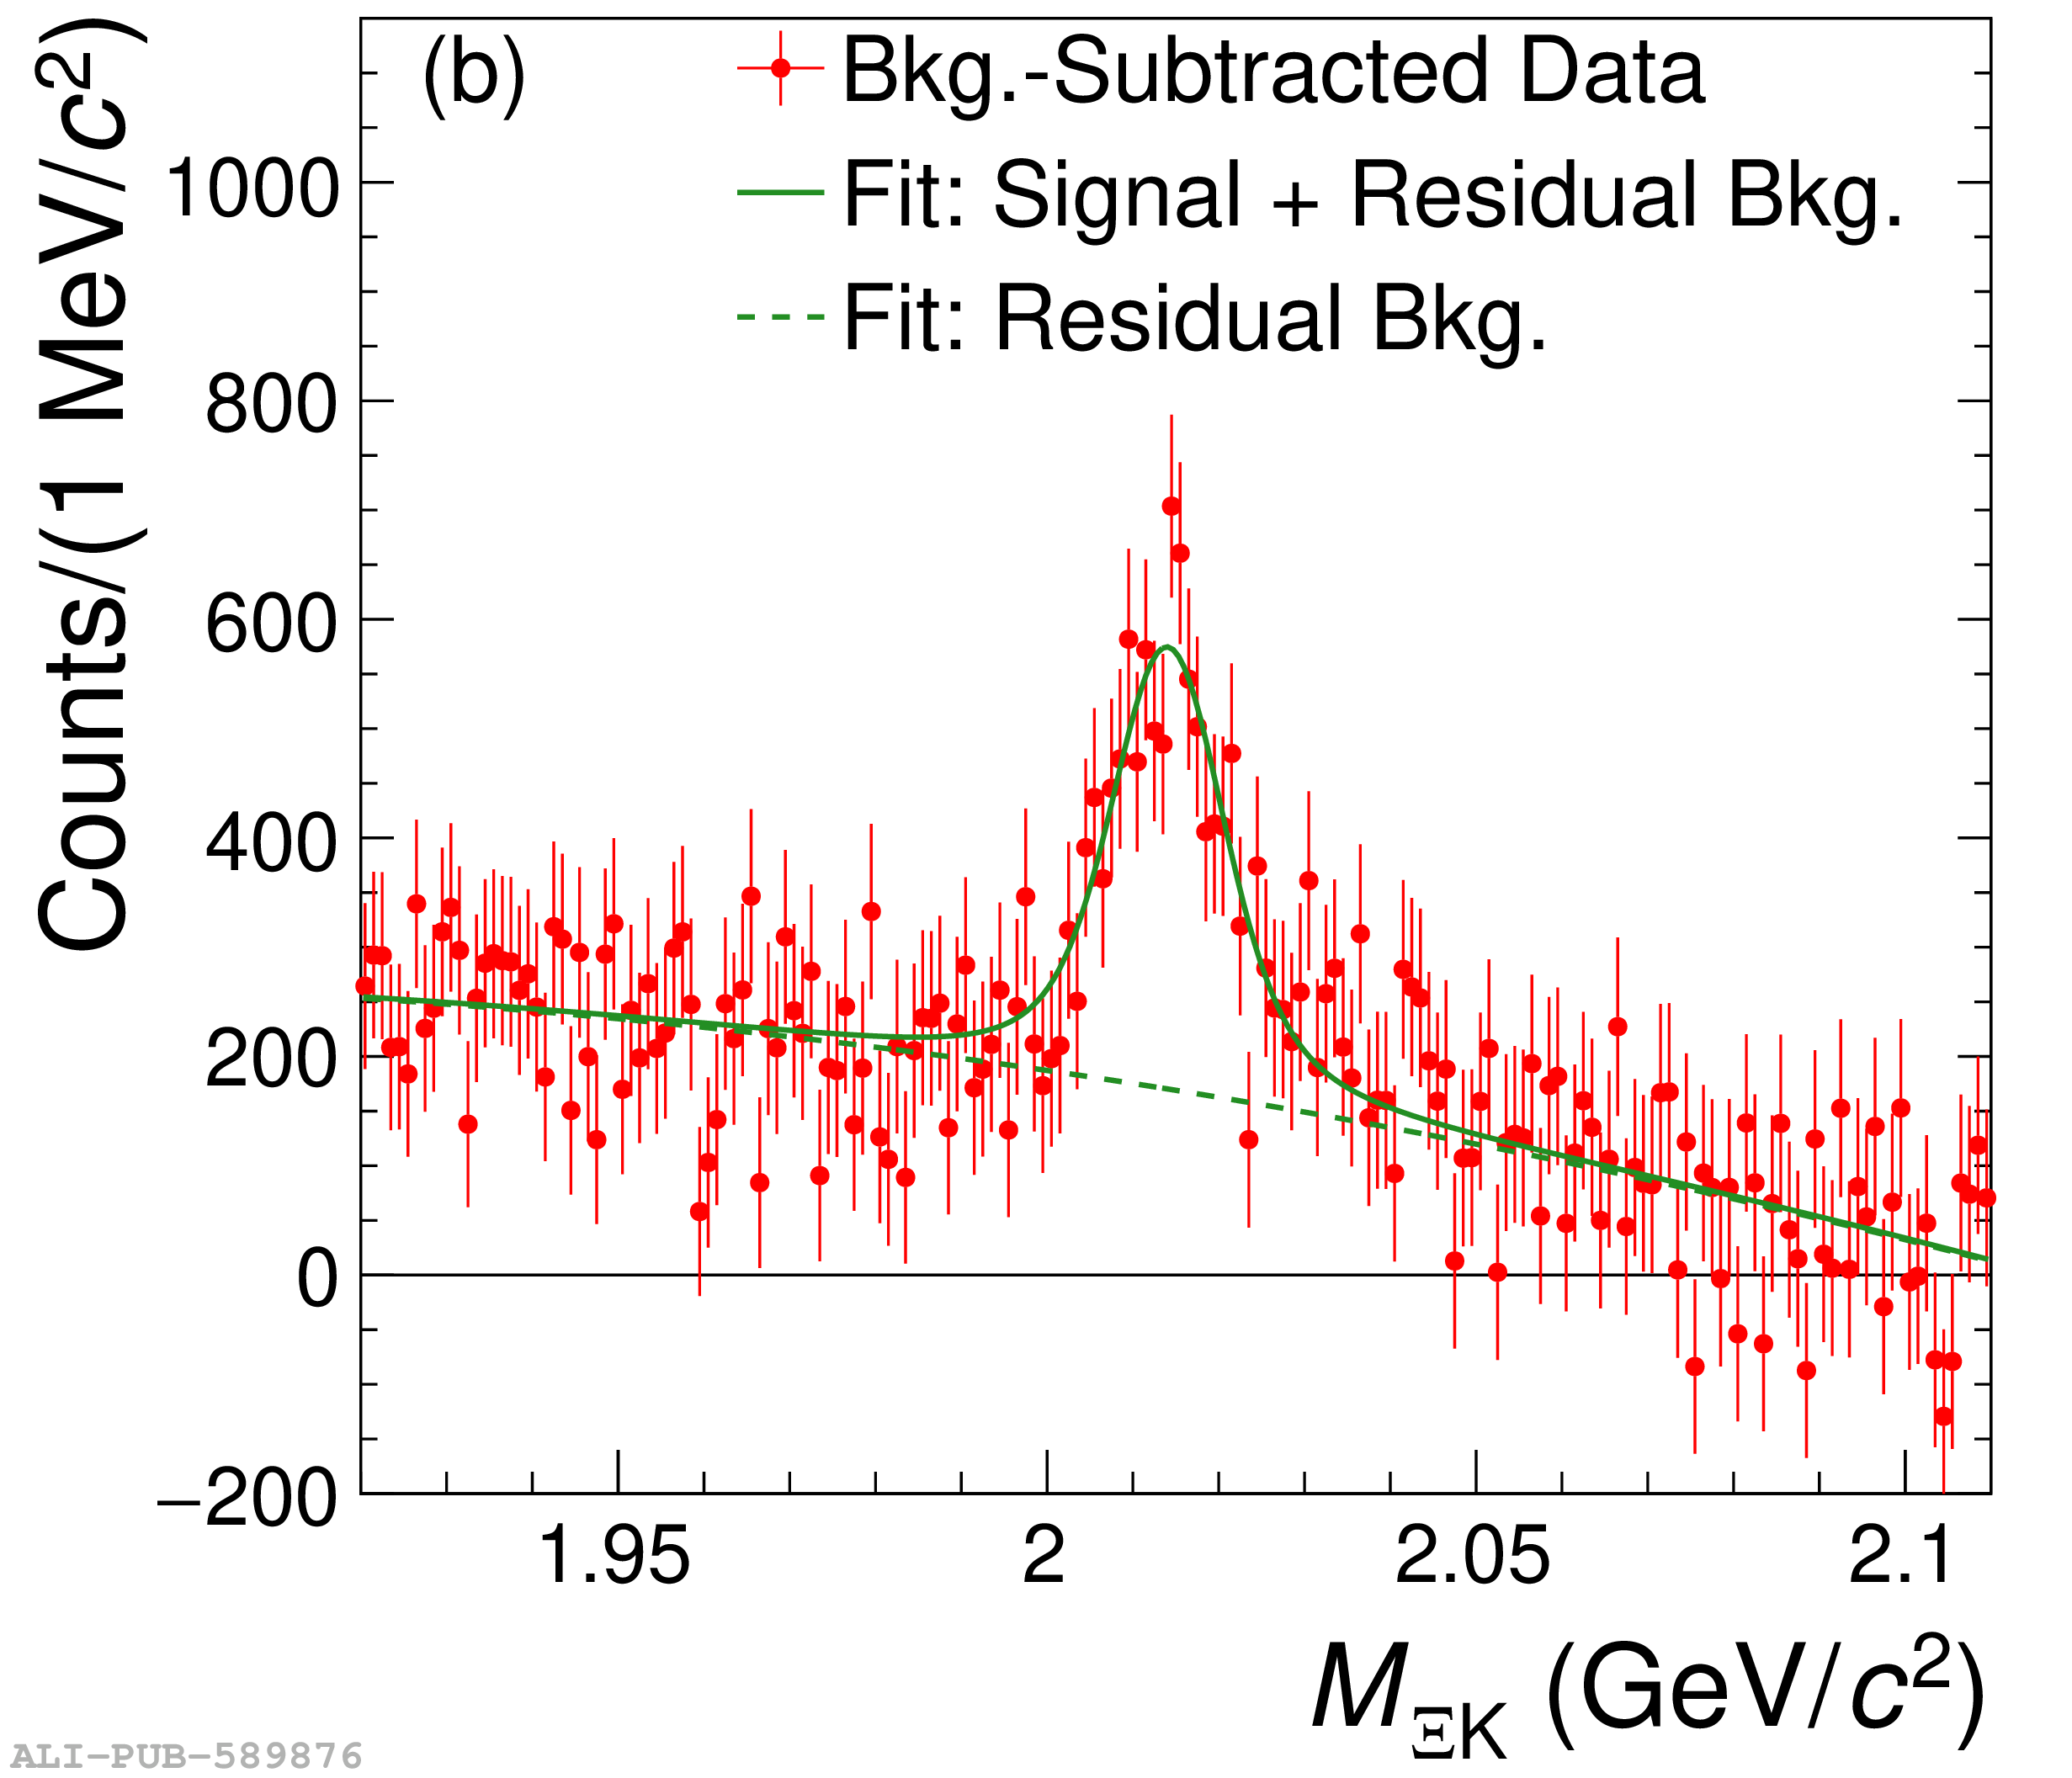 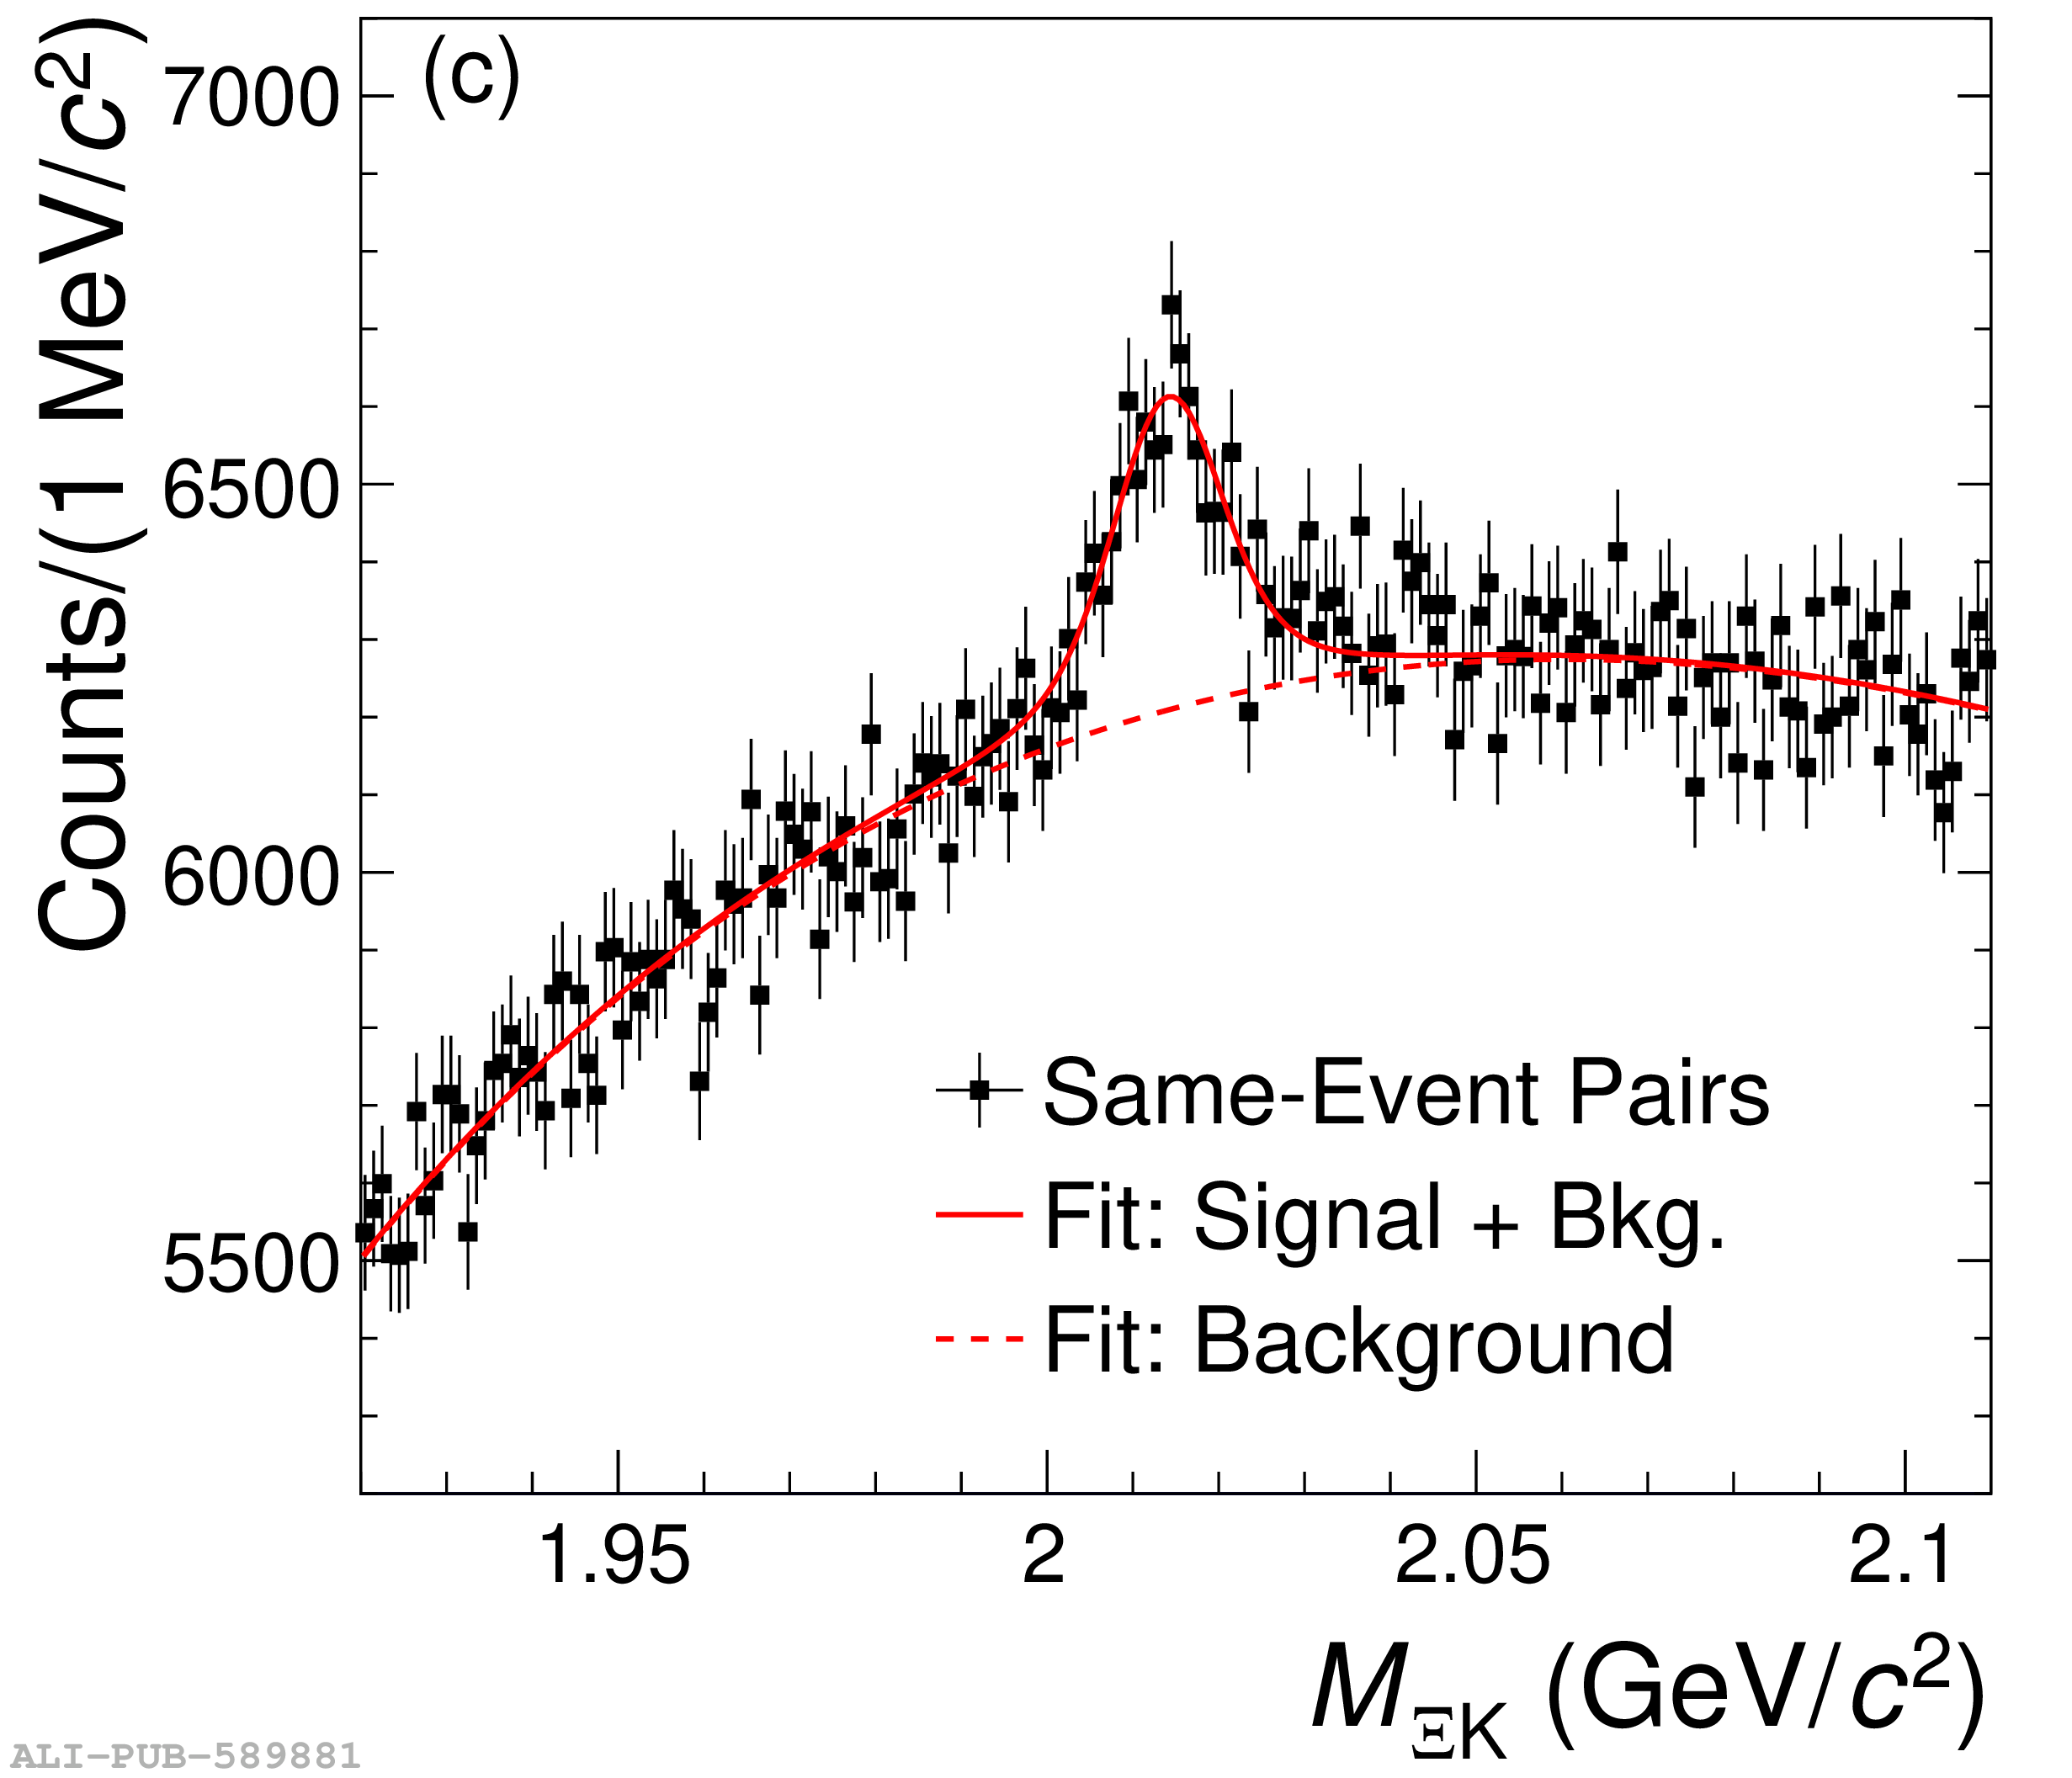 |
Figure 2
Product of the acceptance and efficiency ($A\times\epsilon$) for $\Omega(2012)$ baryons within the rapidity range $|y|< 0.8$ in pp collisions at $\sqrt{s}=13$ TeV. The value of $A\times\epsilon$ is shown in the same wide $p_{\rm T}$ bins as used in the measurement of the $p_{\rm T}$ spectrum in the real data (after the $p_{\rm T}$-weighting procedure) and also in fine $p_{\rm T}$ bins. Only statistical uncertainties are shown. | 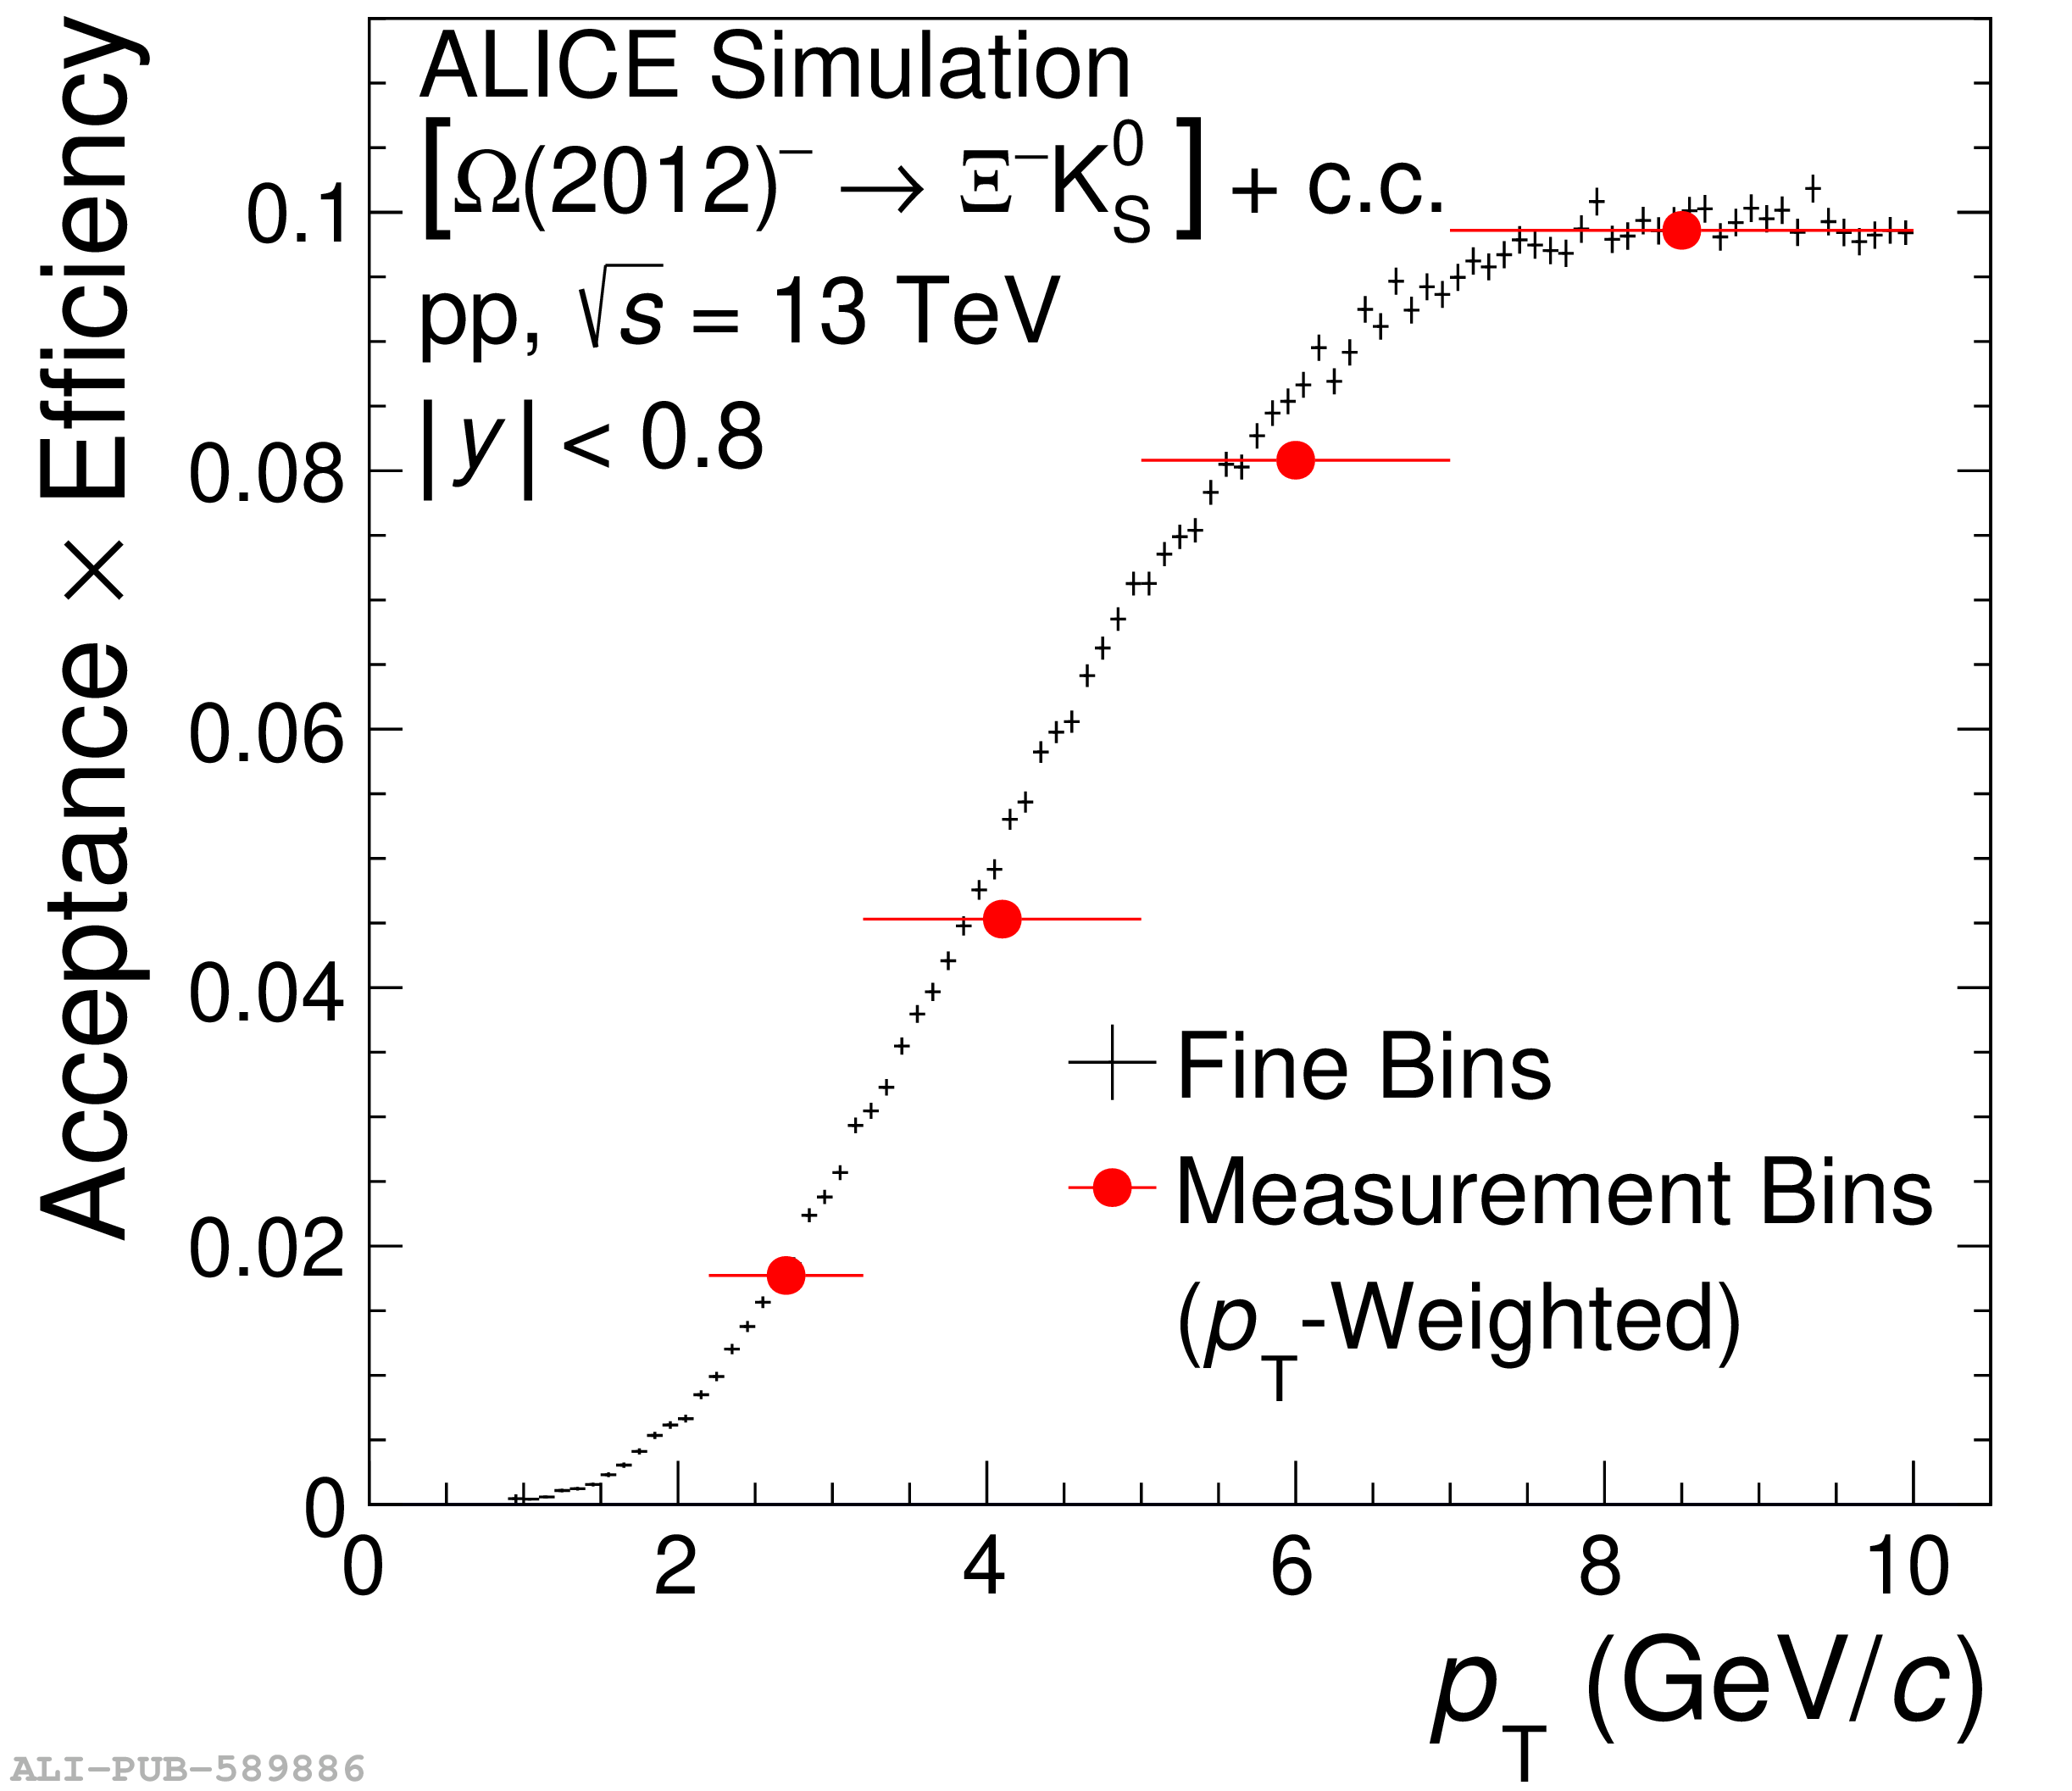 |
Figure 4
(a) $p_{\rm T}$ spectrum of the $\Omega(2012)$ in HM pp collisions at $\sqrt{s}=13$ TeV (not corrected for the unmeasured branching ratio BR for the studied decay channel). Vertical bars represent statistical uncertainties, empty boxes represent the total systematic uncertainties, and shaded boxes represent the portion of the systematic uncertainties that is uncorrelated between $p_{\rm T}$ intervals (only slightly smaller than the total systematic uncertainties). The data points are plotted at the center of each $p_{\rm T}$ interval and the horizontal bars and boxes span the entire width of each $p_{\rm T}$ interval. The curve is the parameterized spectrum for the $\Omega(2012)$ baryon. The shaded band surrounding the curve indicates the region spanned by the envelope of alternate functions used to describe the spectrum, which affect the extrapolation of the yield to low $p_{\rm T}$. The horizontal dashed lines labeled "Function Integral" show the integral of the parameterized spectrum over each of the four measured $p_{\rm T}$ intervals. (b) The horizontal dashed lines show the ratio of the parameterized yield to the measured $\Omega(2012)$ yield in each of the four $p_{\rm T}$ intervals. The bars and boxes indicate the fractional uncertainties (statistical, total systematic, and $p_{\rm T}$-uncorrelated systematic) of the measured data. | 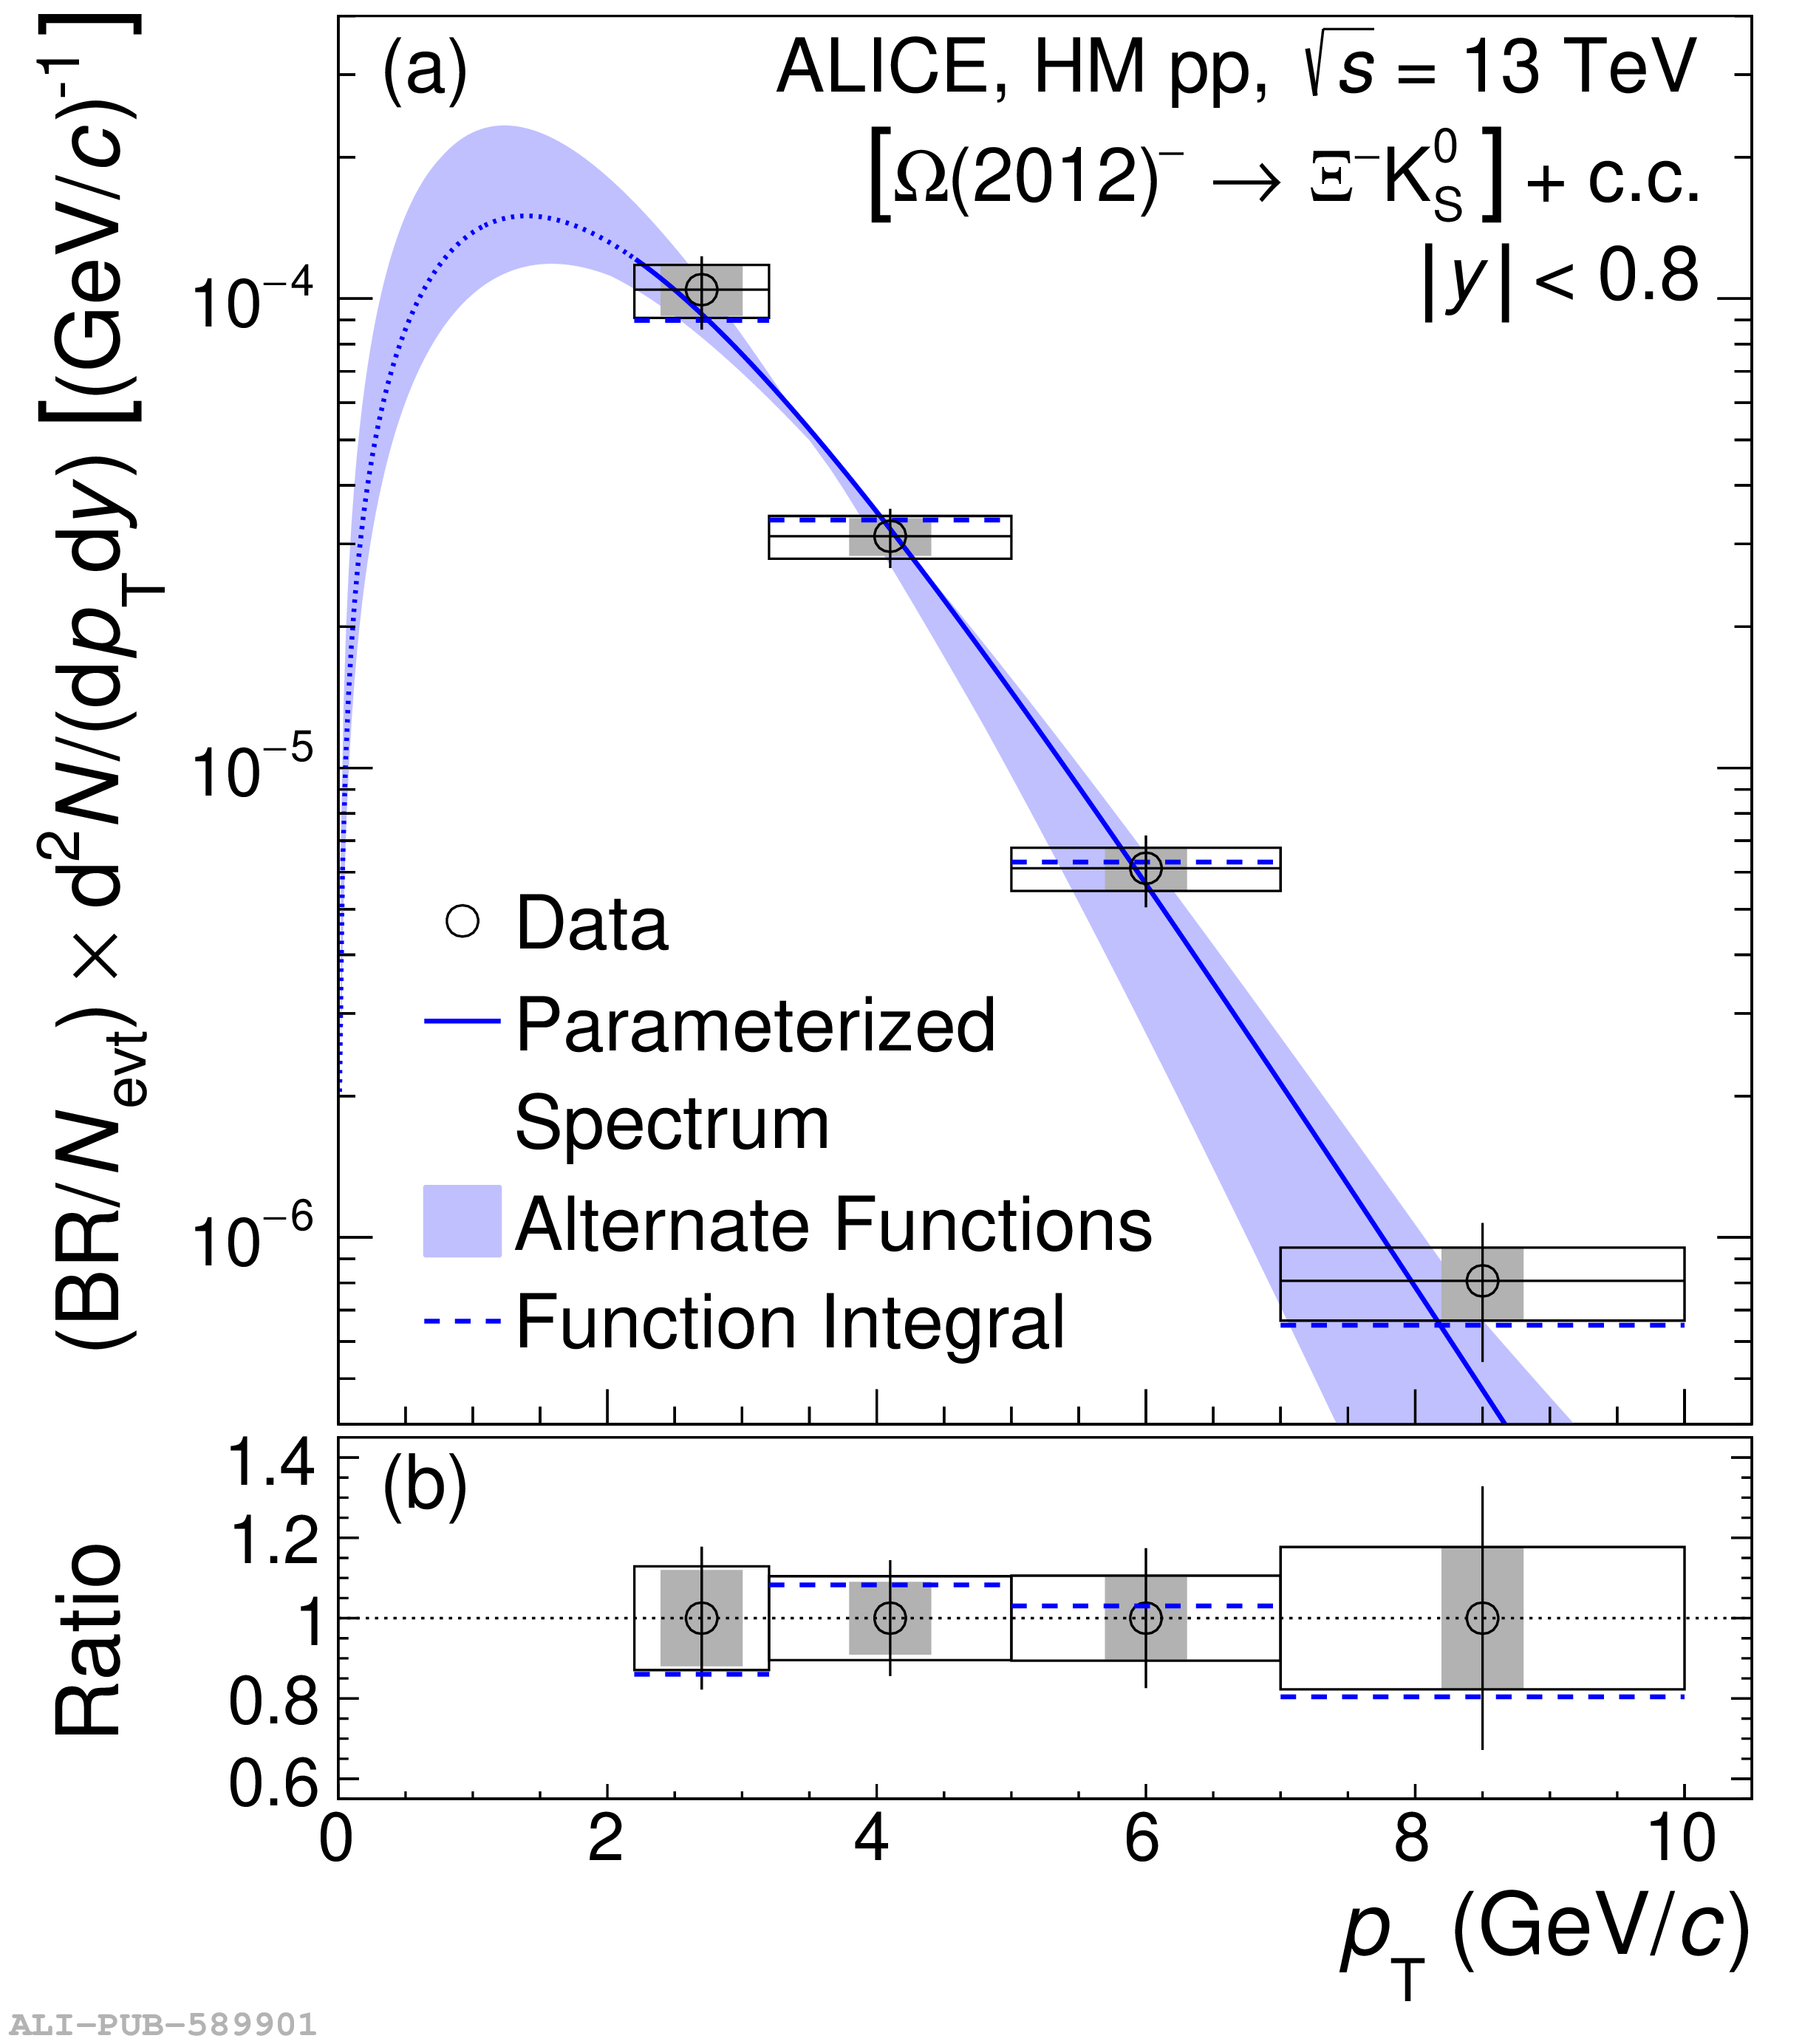 |