Self-normalized yield of $\Upsilon$(nS) states as a function of self-normalized charged-particle multiplicity, $p_{\rm{T}}$-integrated, compared to 3-pomeron CGC approach , PYTHIA 8.2 and CPP . The vertical error bars represent the statistical uncertainty, while the systematic uncertainties are depicted as boxes The dashed line represents a linear function with the slope equal to unity. | 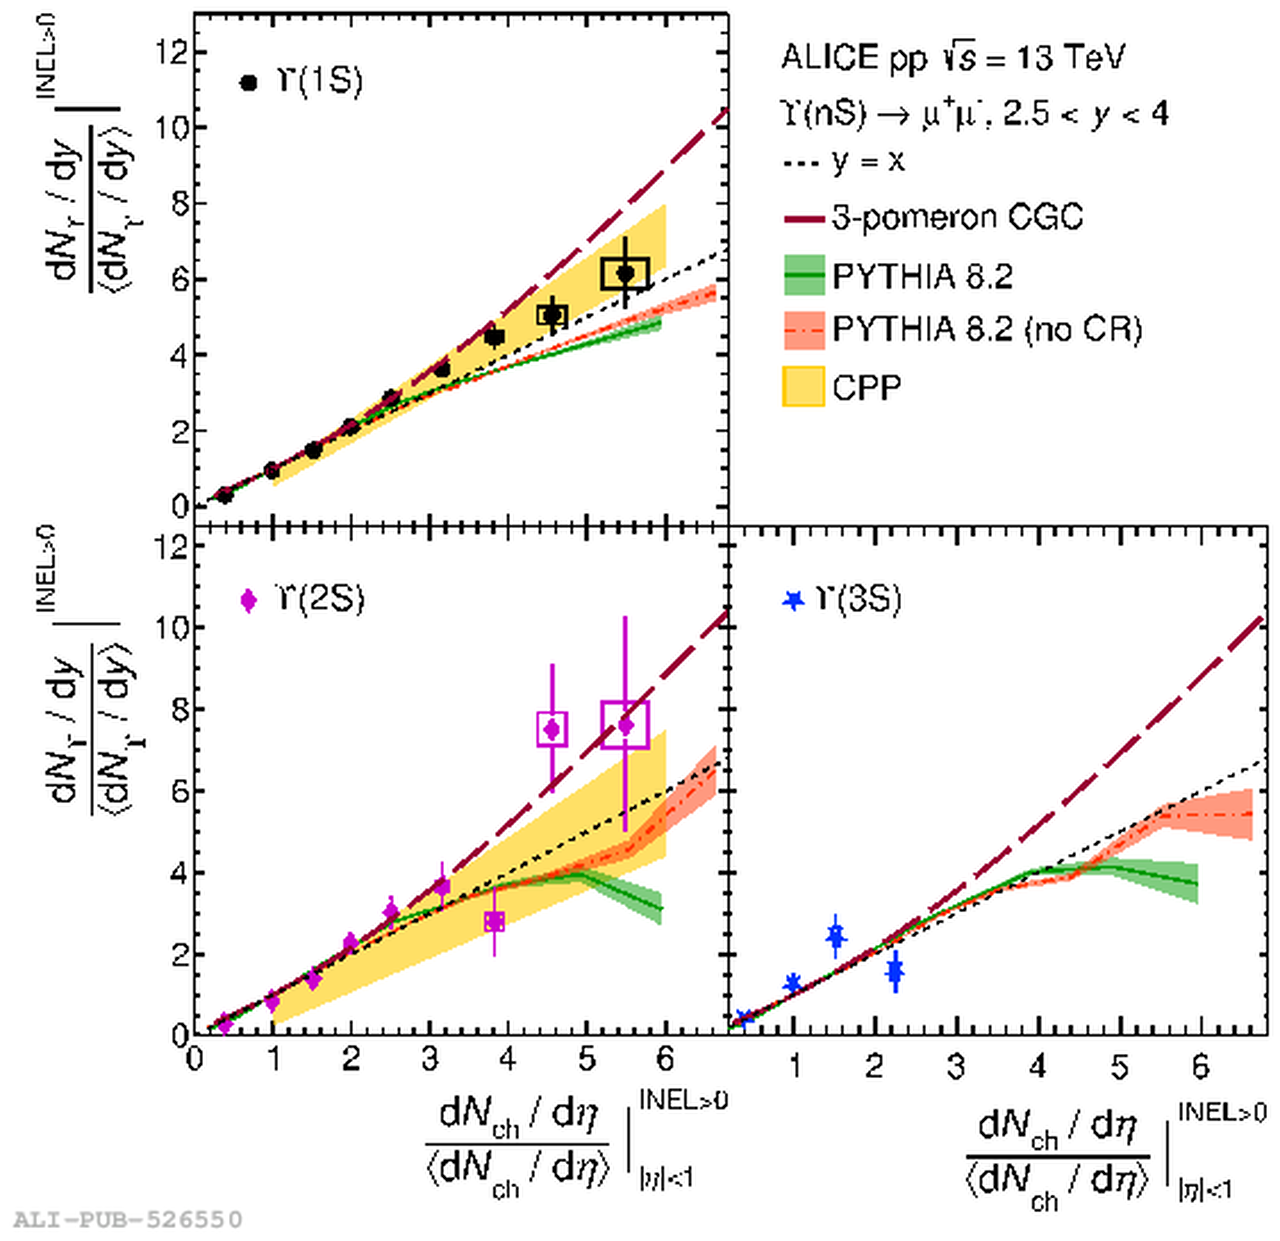 |