Yield ratio of ${}_Λ^{3}\mathrm{H}$ to ${}^{3}\mathrm{He}$ together with theoretical predictions as a function of multiplicity. In the left panel, the results of this analysis are compared with the ALICE measurement at $\sqrt{s_{\mathrm{NN}}}$ = 2.76 TeV . Vertical lines are used for the statistical uncertainties and the height of the boxes for the systematic ones. The width of the boxes refers to the uncertainties of multiplicity. For each centrality interval the $\langle \mathrm{d}N_\mathrm{ch}/\mathrm{d}\eta\rangle$ is taken from Ref. [73] and the ${}^{3}\mathrm{He}$ yield from Ref. [51]. The dense orange dashed line represents the expectation of SHM, while the other three sets of lines stand for coalescence model with different $B_\Lambda$ hypotheses. The coalescence prediction with world average $B_\Lambda$ is displayed with a 1$\sigma$ uncertainty as the filled area, both lines and shadowed areas are linear interpolations of the available model calculations . In the right panel, the results of recent STAR measurement are shown for comparison . | 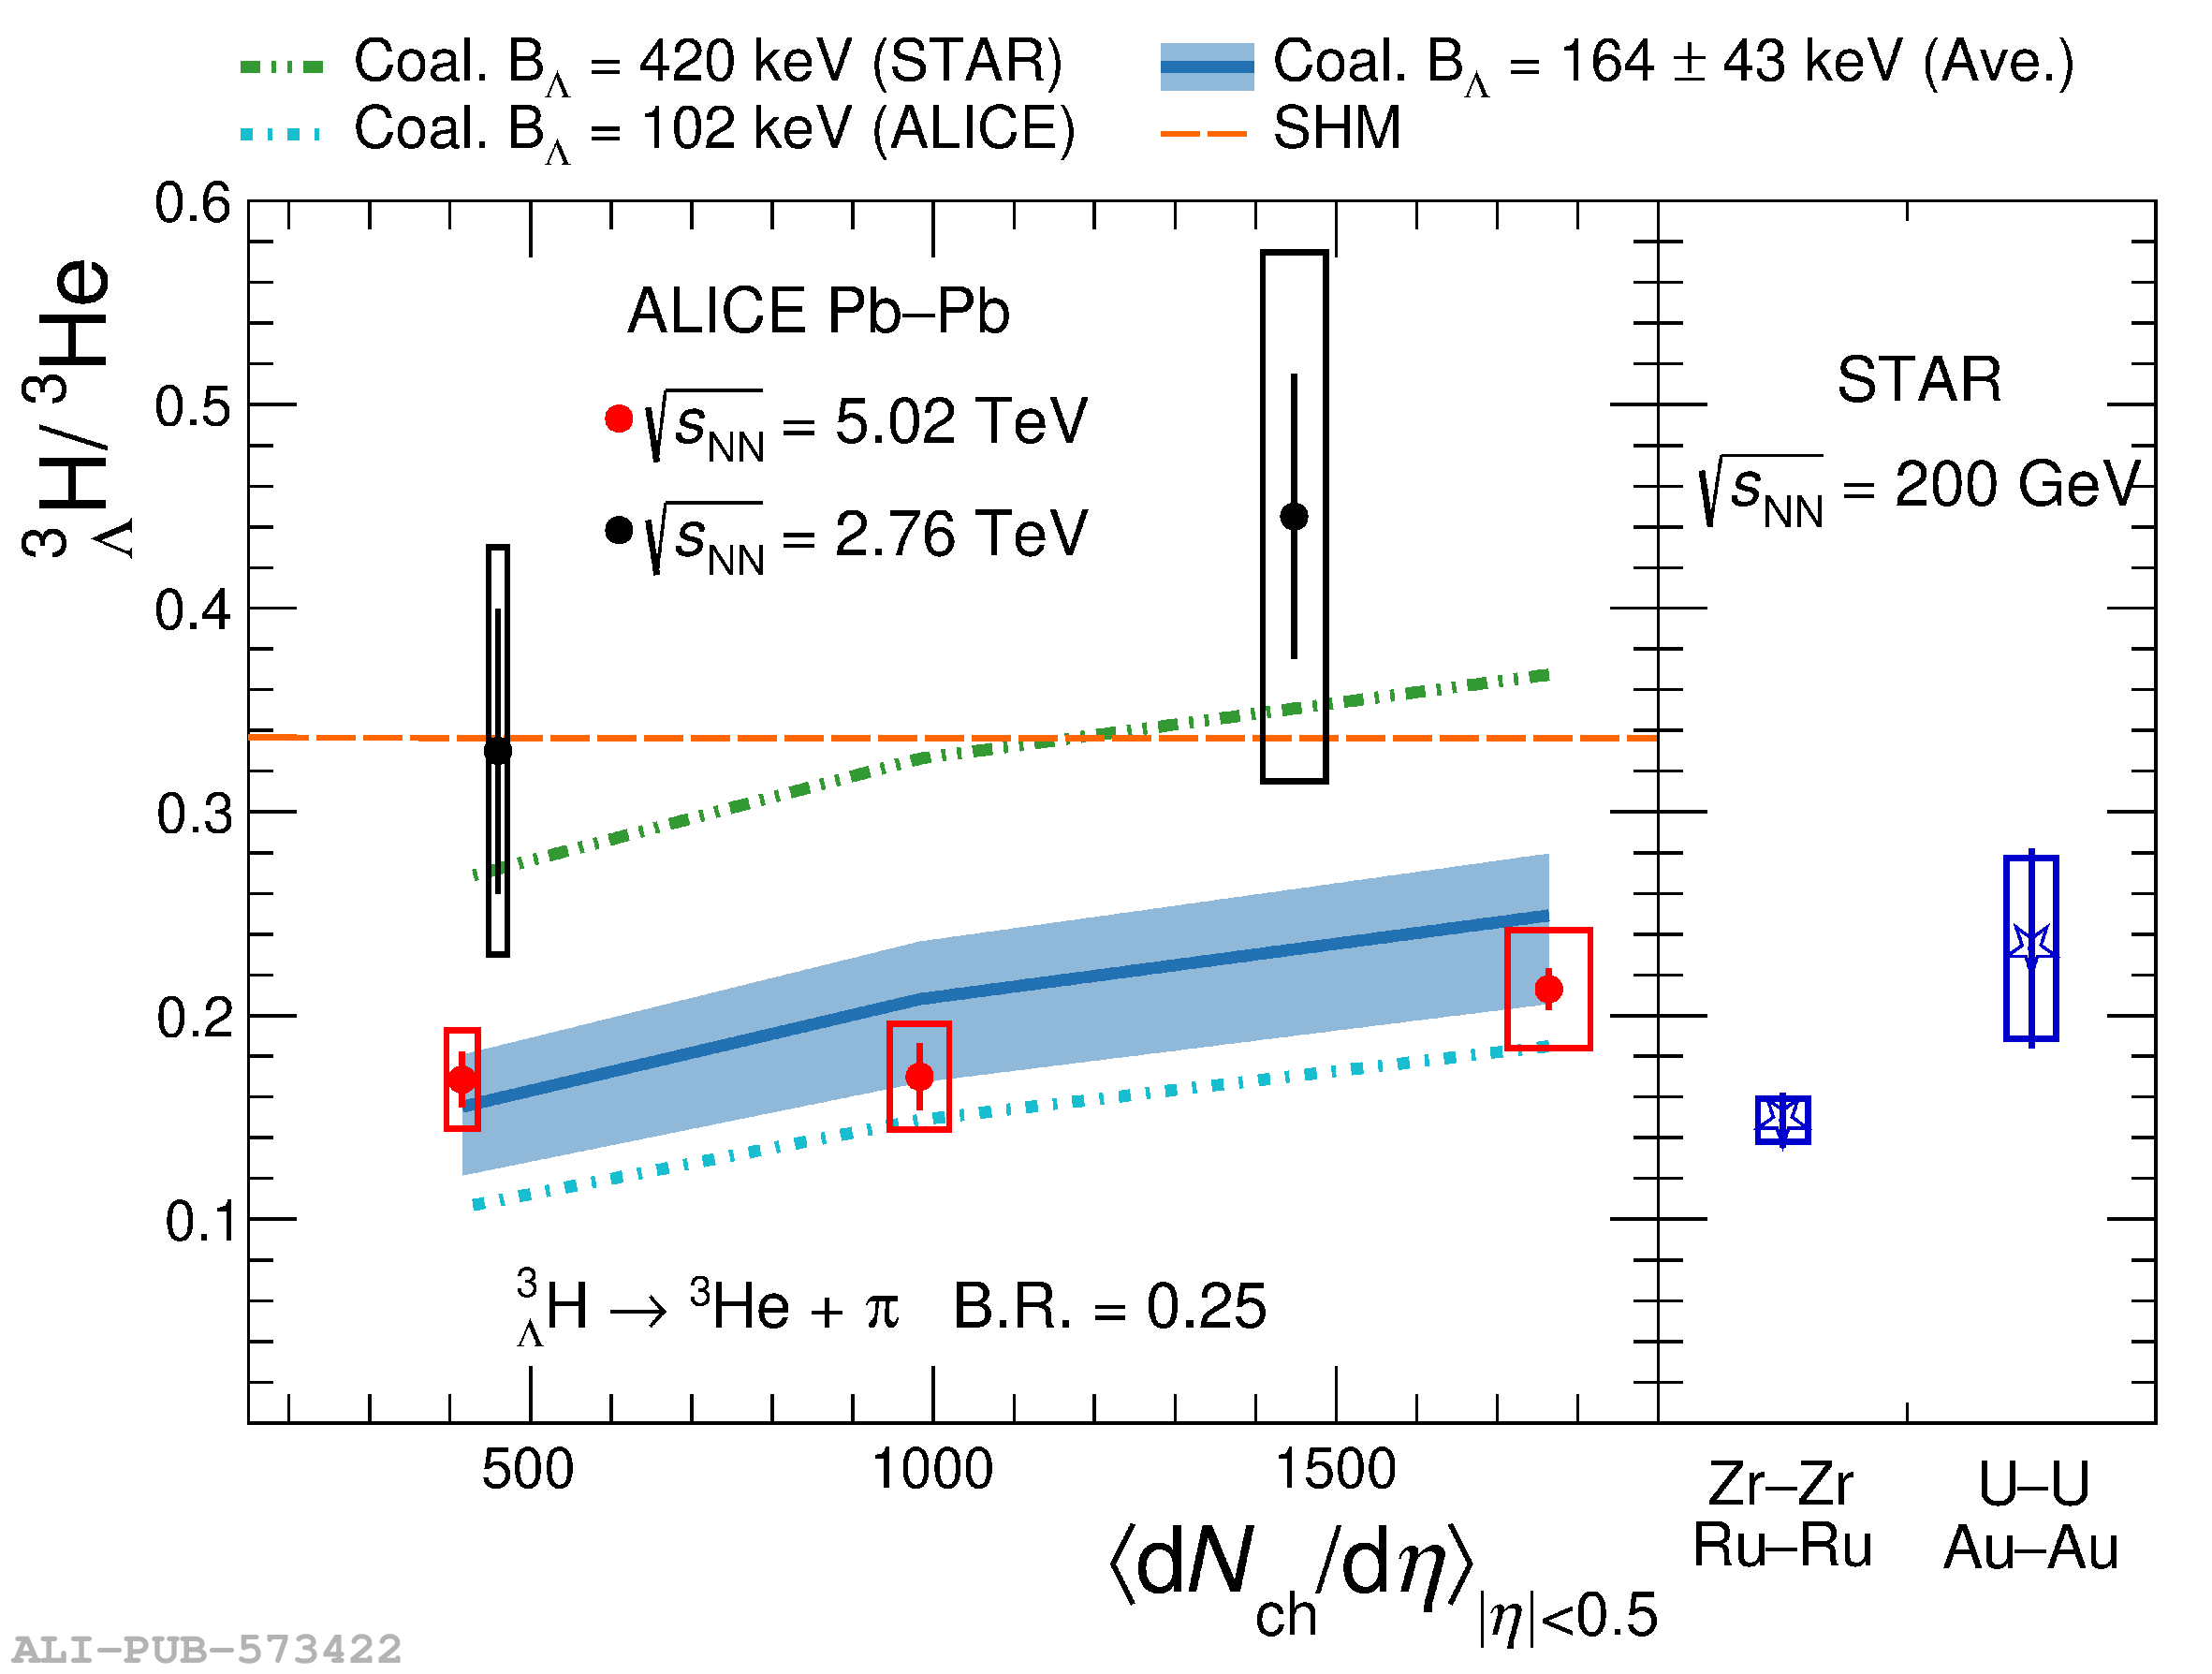 |