Light neutral-meson production in pp collisions at $\sqrt{s}$ = 13 TeV

The momentum-differential invariant cross sections of ${\pi^{0}}$ and $\eta$ mesons are reported for pp collisions at $\sqrt{s}$ = 13 TeV at midrapidity ($|y|<~0.8$). The measurement is performed in a broad transverse-momentum range of $0.2<~p_{\rm T}<~200$ GeV/$c$ and $0.4<~p_{\rm T}<~60$ GeV/$c$ for the ${\pi^{0}}$ and $\eta$, respectively, extending the $p_{\rm T}$ coverage of previous measurements. Transverse-mass-scaling violation of up to 60% at low transverse momentum has been observed, agreeing with measurements at lower collision energies. Transverse Bjorken $x$ ($x_{\rm T}$) scaling of the ${\pi^{0}}$ cross sections at LHC energies is fulfilled with a power-law exponent of $n$ = 5.01$\pm$0.05, consistent with values obtained for charged pions at similar collision energies. The data is compared to predictions from next-to-leading order perturbative QCD calculations, where the ${\pi^{0}}$ spectrum is best described using the CT18 parton distribution function and the NNFF1.0 or BDSS fragmentation function. Expectations from PYTHIA8 and EPOS LHC overestimate the spectrum for the ${\pi^{0}}$ and are not able to describe the shape and magnitude of the $\eta$ spectrum. The charged-particle multiplicity dependent ${\pi^{0}}$ and $\eta$ $p_{\rm T}$ spectra show the expected hardening with increasing multiplicity. This is demonstrated across a broad transverse-momentum range and up to events with a charged-particle multiplicity exceeding five times the mean value in minimum bias collisions. The absolute magnitude of the $\eta/\pi^{0}$ ratio shows a dependence on the charged-particle multiplicity for $p_{\rm T}<~4$ GeV/$c$, qualitatively described by PYTHIA8 and EPOS LHC due to a rising contribution from feed-down of heavier particles to the ${\pi^{0}}$ spectrum.


Submitted to: JHEP
e-Print: arXiv:2411.09560 | PDF | inSPIRE
CERN-EP-2024-304
Figure group

Figure 1

Trigger rejection factors for the \ac{EMC}-L1 $\gamma$ (low) (green), \ac{EMC}-L1 $\gamma$ (high) (cyan) and the PHOS-PHI7 (red) trigger as a function of the cluster energy.

Figure 2

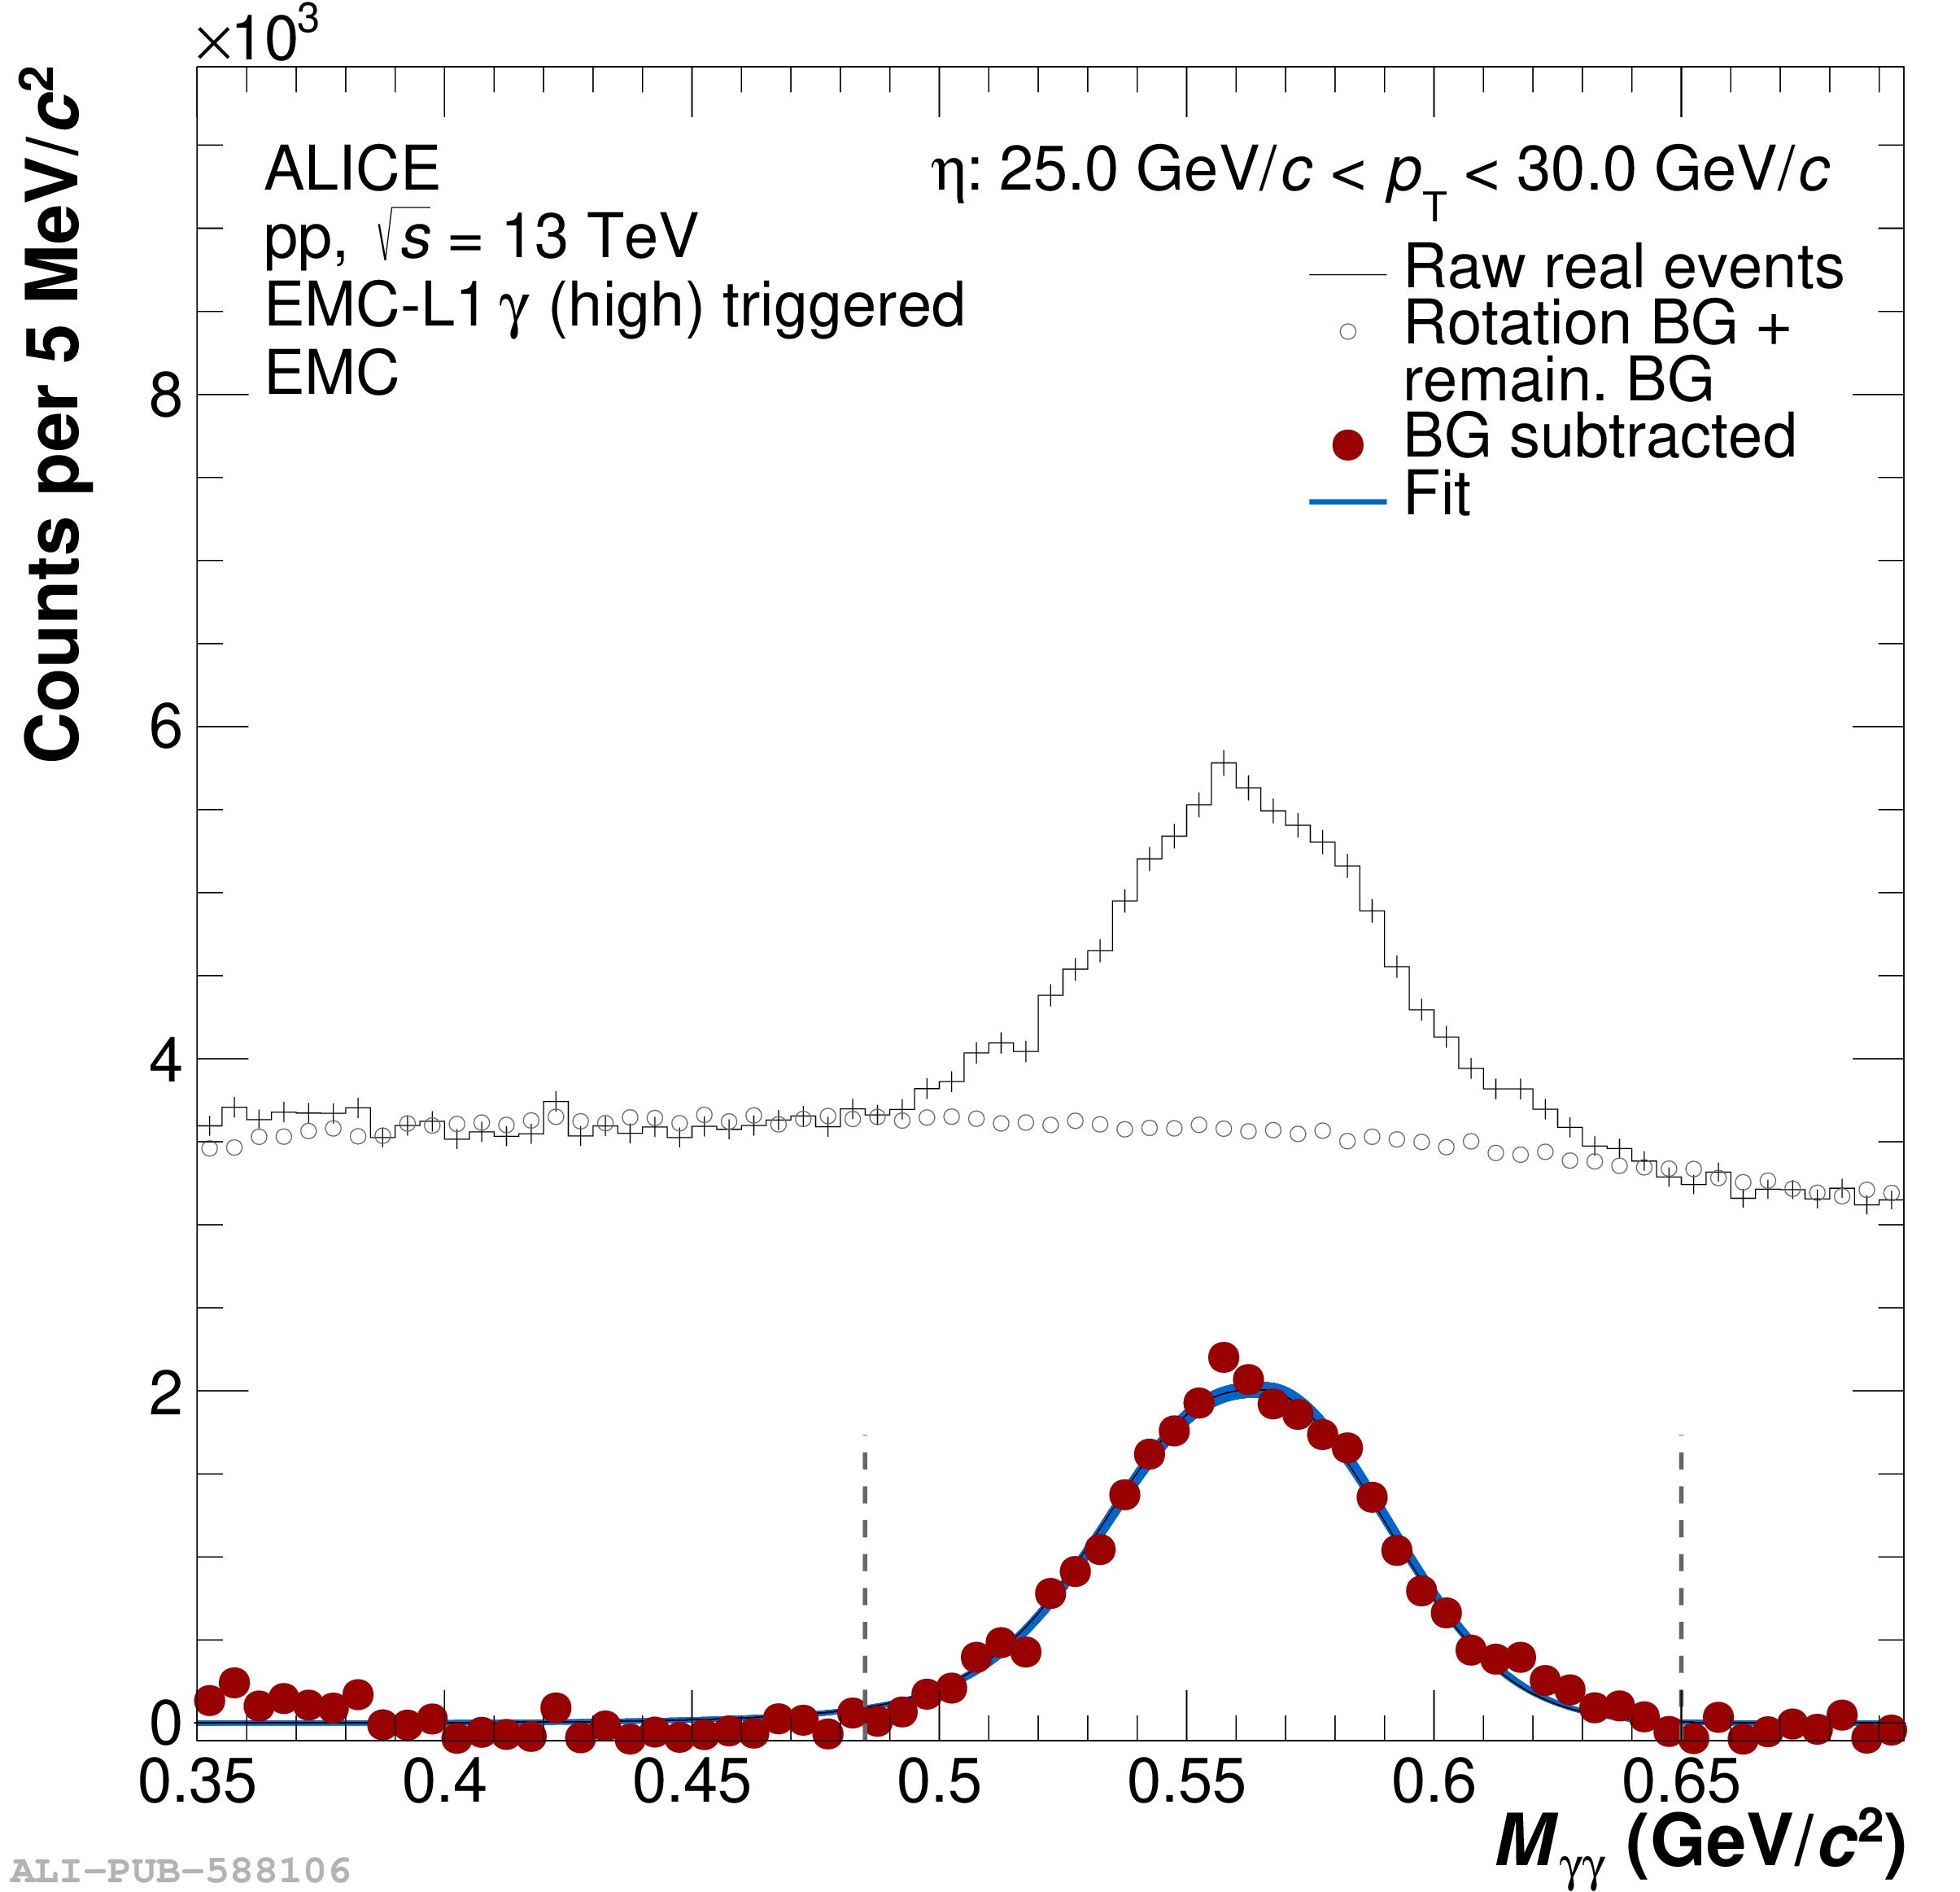
Invariant mass distribution of \g\g pairs around the \piz (left) and \et (right) rest mass for the \ac{PCM} and \ac{EMC} reconstruction methods, respectively. The extracted meson peak is shown in red, with the parametrization in blue and its uncertainty represented by a blue band.

Figure 3

Peak position (a) and peak width (b) as a function of \pT for the \piz (left) and \et (right) for all reconstruction techniques and for data in closed markers and \ac{MC} simulation in open markers. The values are extracted from a fit of the meson peak.

Figure 4

Distribution of \ShowerShape for \ac{EMC} (left) and in \ac{PHOS} (right) clusters in \ac{MC} simulation. Clusters with a leading contribution from decay photons from \piz are shown in black together with different background contributions in colored markers.

Figure 5

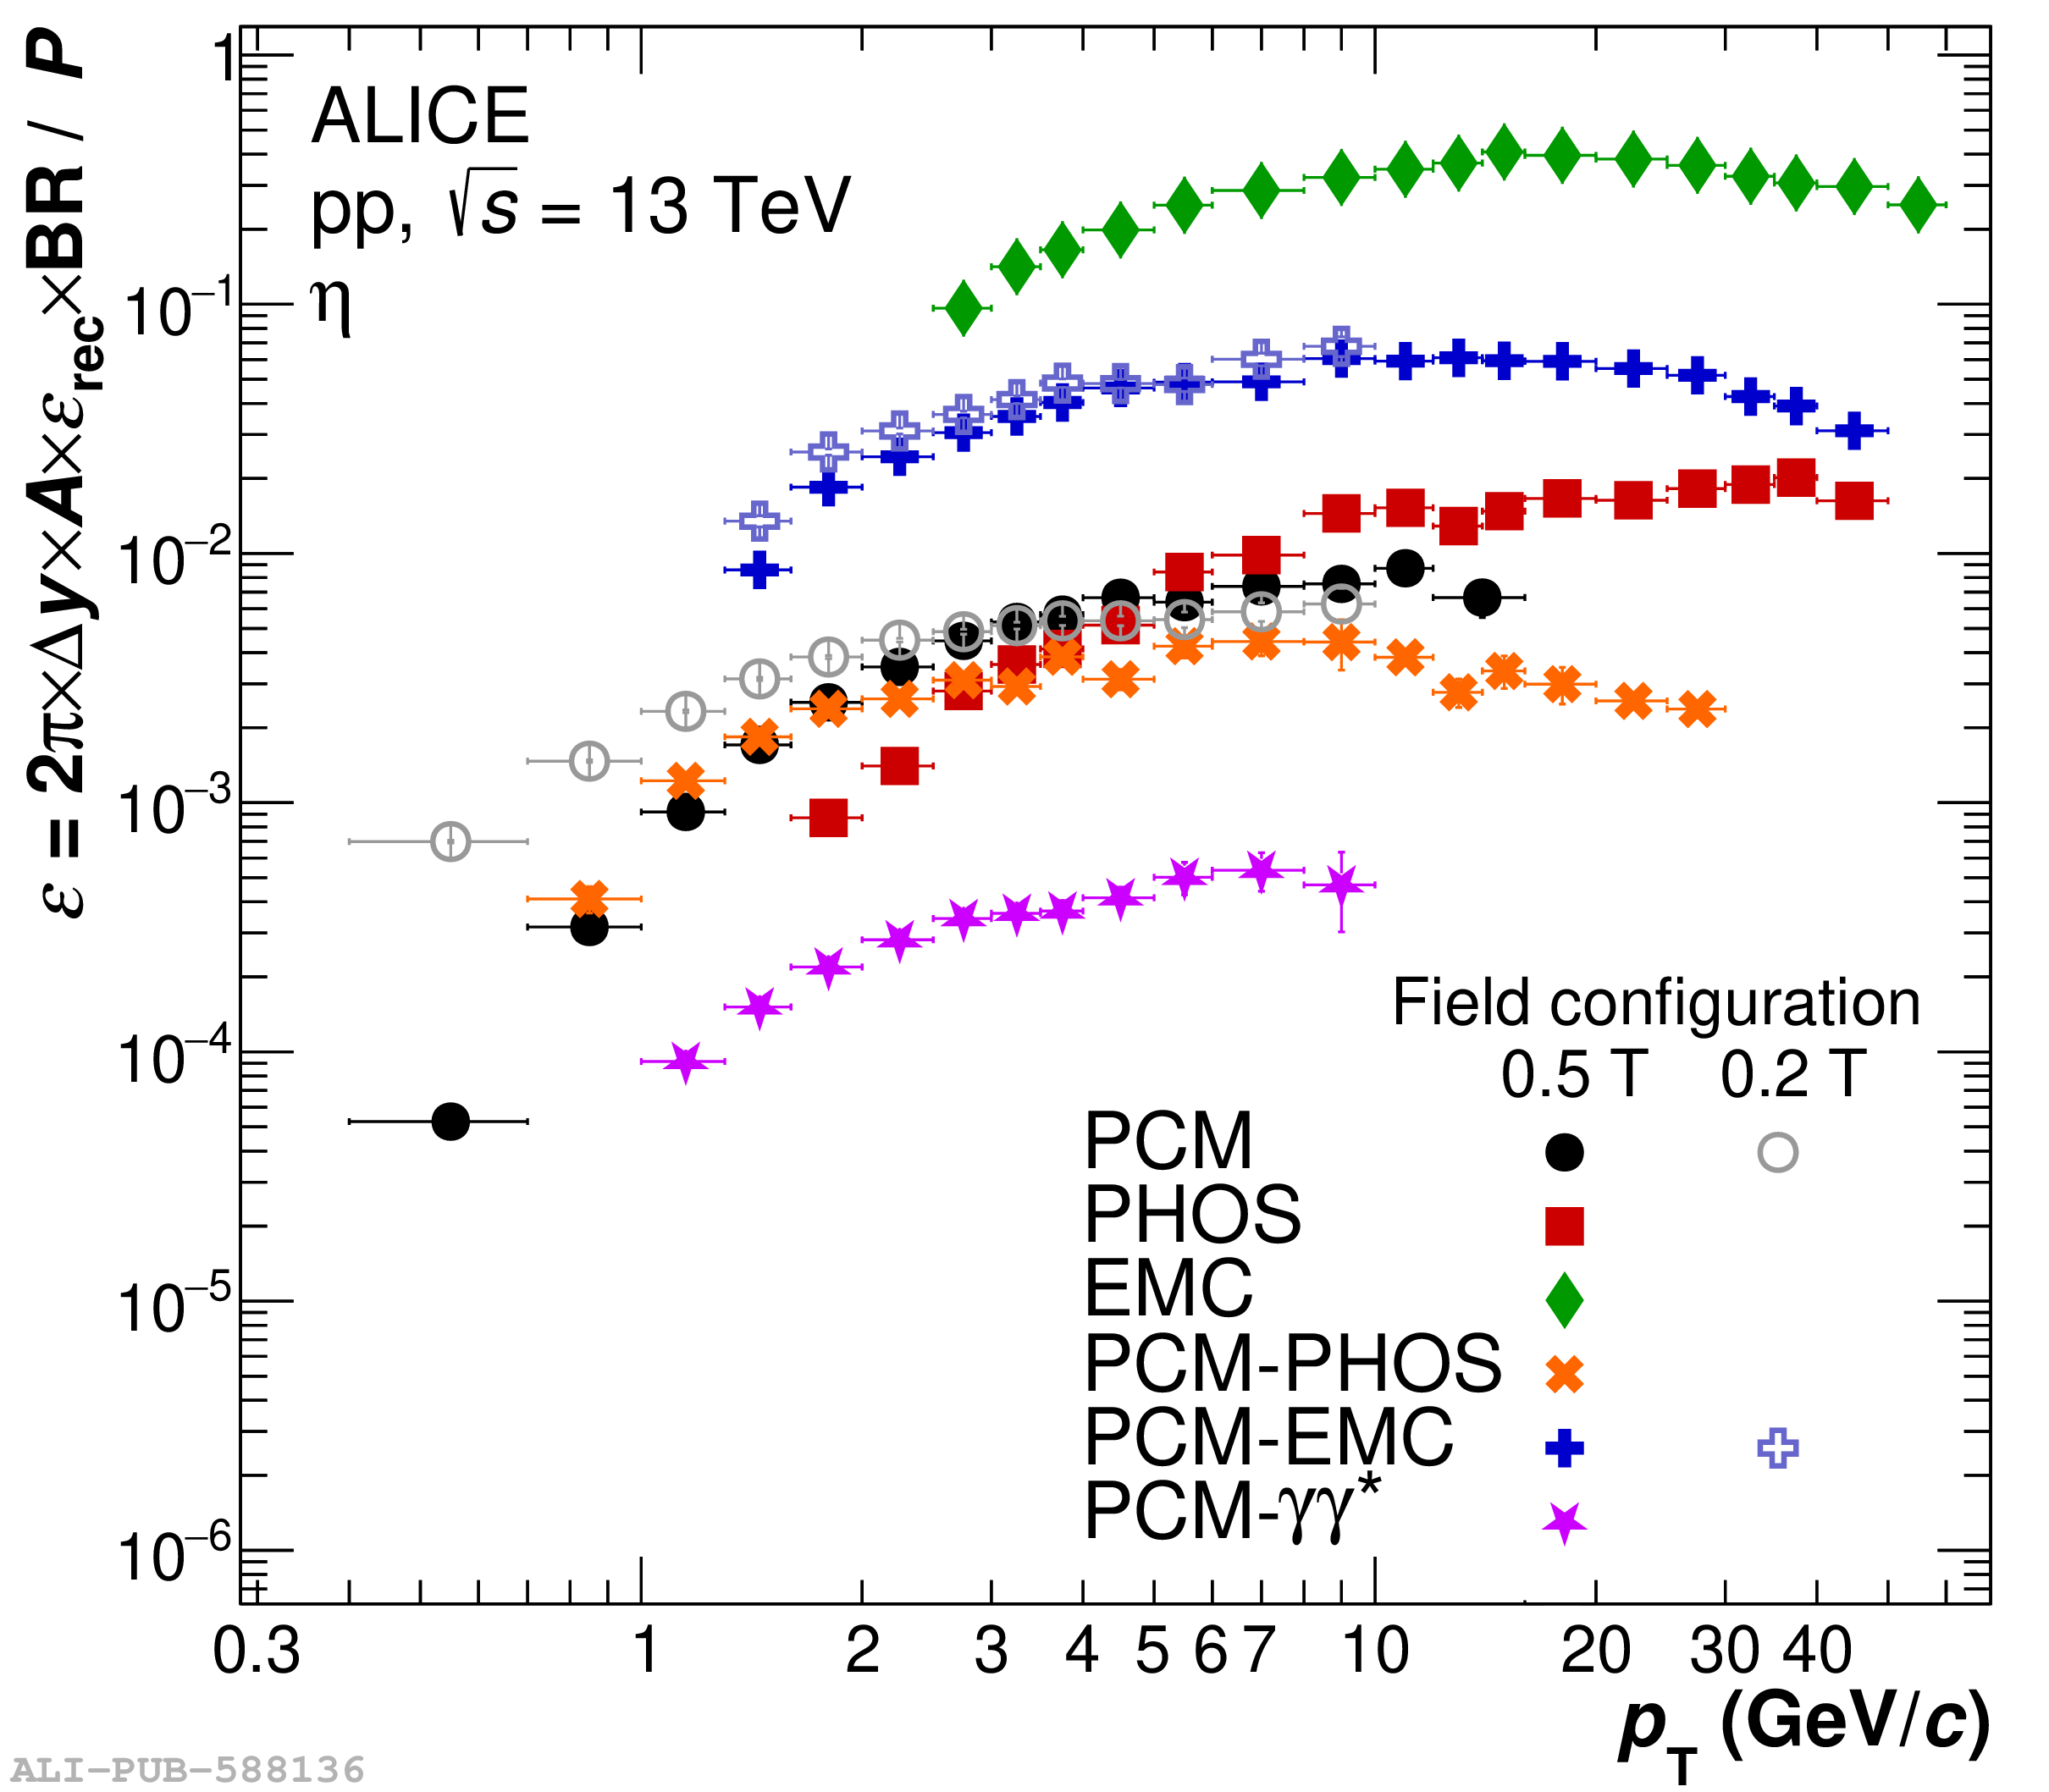
Correction factor for the \piz (left) and \et (right), including the reconstruction efficiency, acceptance, purity, branching-ratio and normalization for the azimuthal angle $\varphi$ and rapidity $y$ coverage, as a function of \pT for the different reconstruction methods.

Figure 6

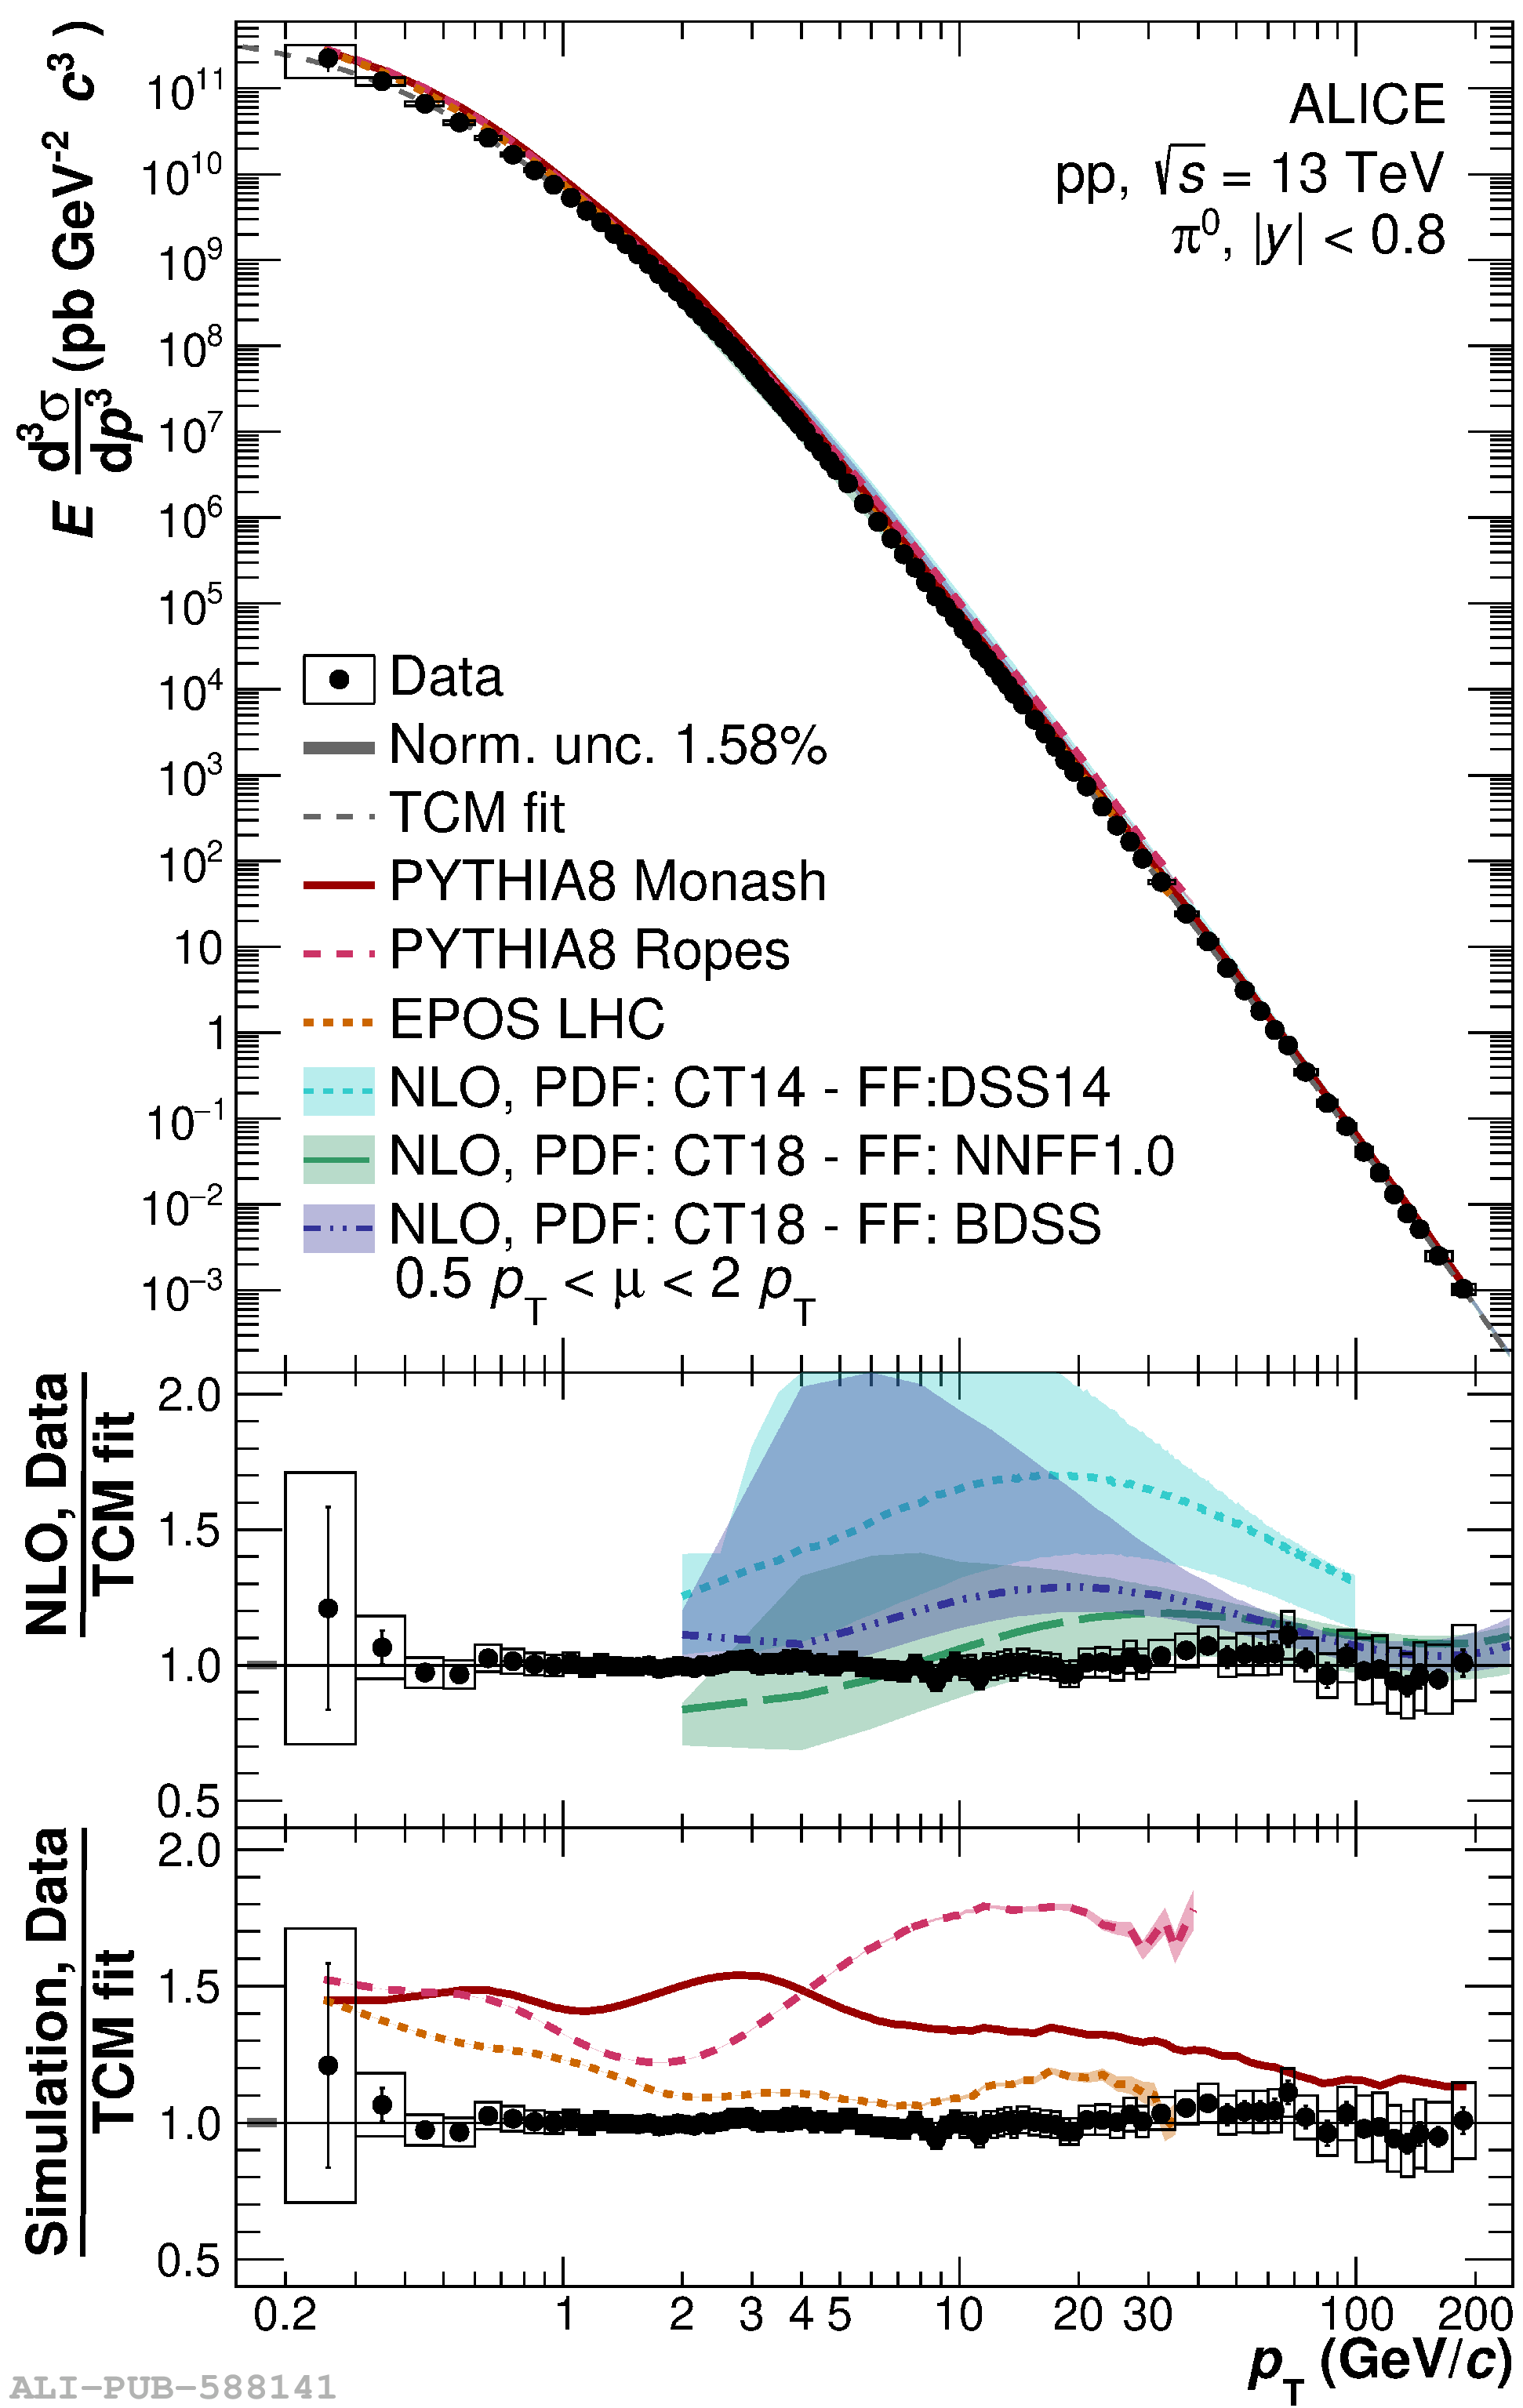
Invariant differential cross section of \piz (left) and \et (right) versus transverse momentum for \pp collisions at \sT. The data are parametrized with a modified \ac{TCM} model (see \Eq{eq:TwoComponentModel}) and compared to predictions from PYTHIA8 Monash, PYTHIA8 Ropes, EPOS LHC and predictions from NLO pQCD calculations using recent PDFs and FFs. Ratio plots of the data and model calculations to the modified \ac{TCM} fit of the data are shown in the lower panels. Statistical error bars are represented by vertical bars, and systematic uncertainties are shown as boxes.

Figure 7

Ratio between each individual \piz (left) and \et (right) invariant differential cross section measurement, and the \ac{TCM} fit to the combined spectrum. The statistical uncertainties are represented as vertical error bars whereas the systematic uncertainties are shown as boxes.

Figure 8

Left: the \etopi ratio as a function of \pT compared to expectations from PYTHIA8, EPOS LHC, and \mT scaling. Right: Ratio of data and model predictions to the respective \mT scaling prediction.

Figure 9

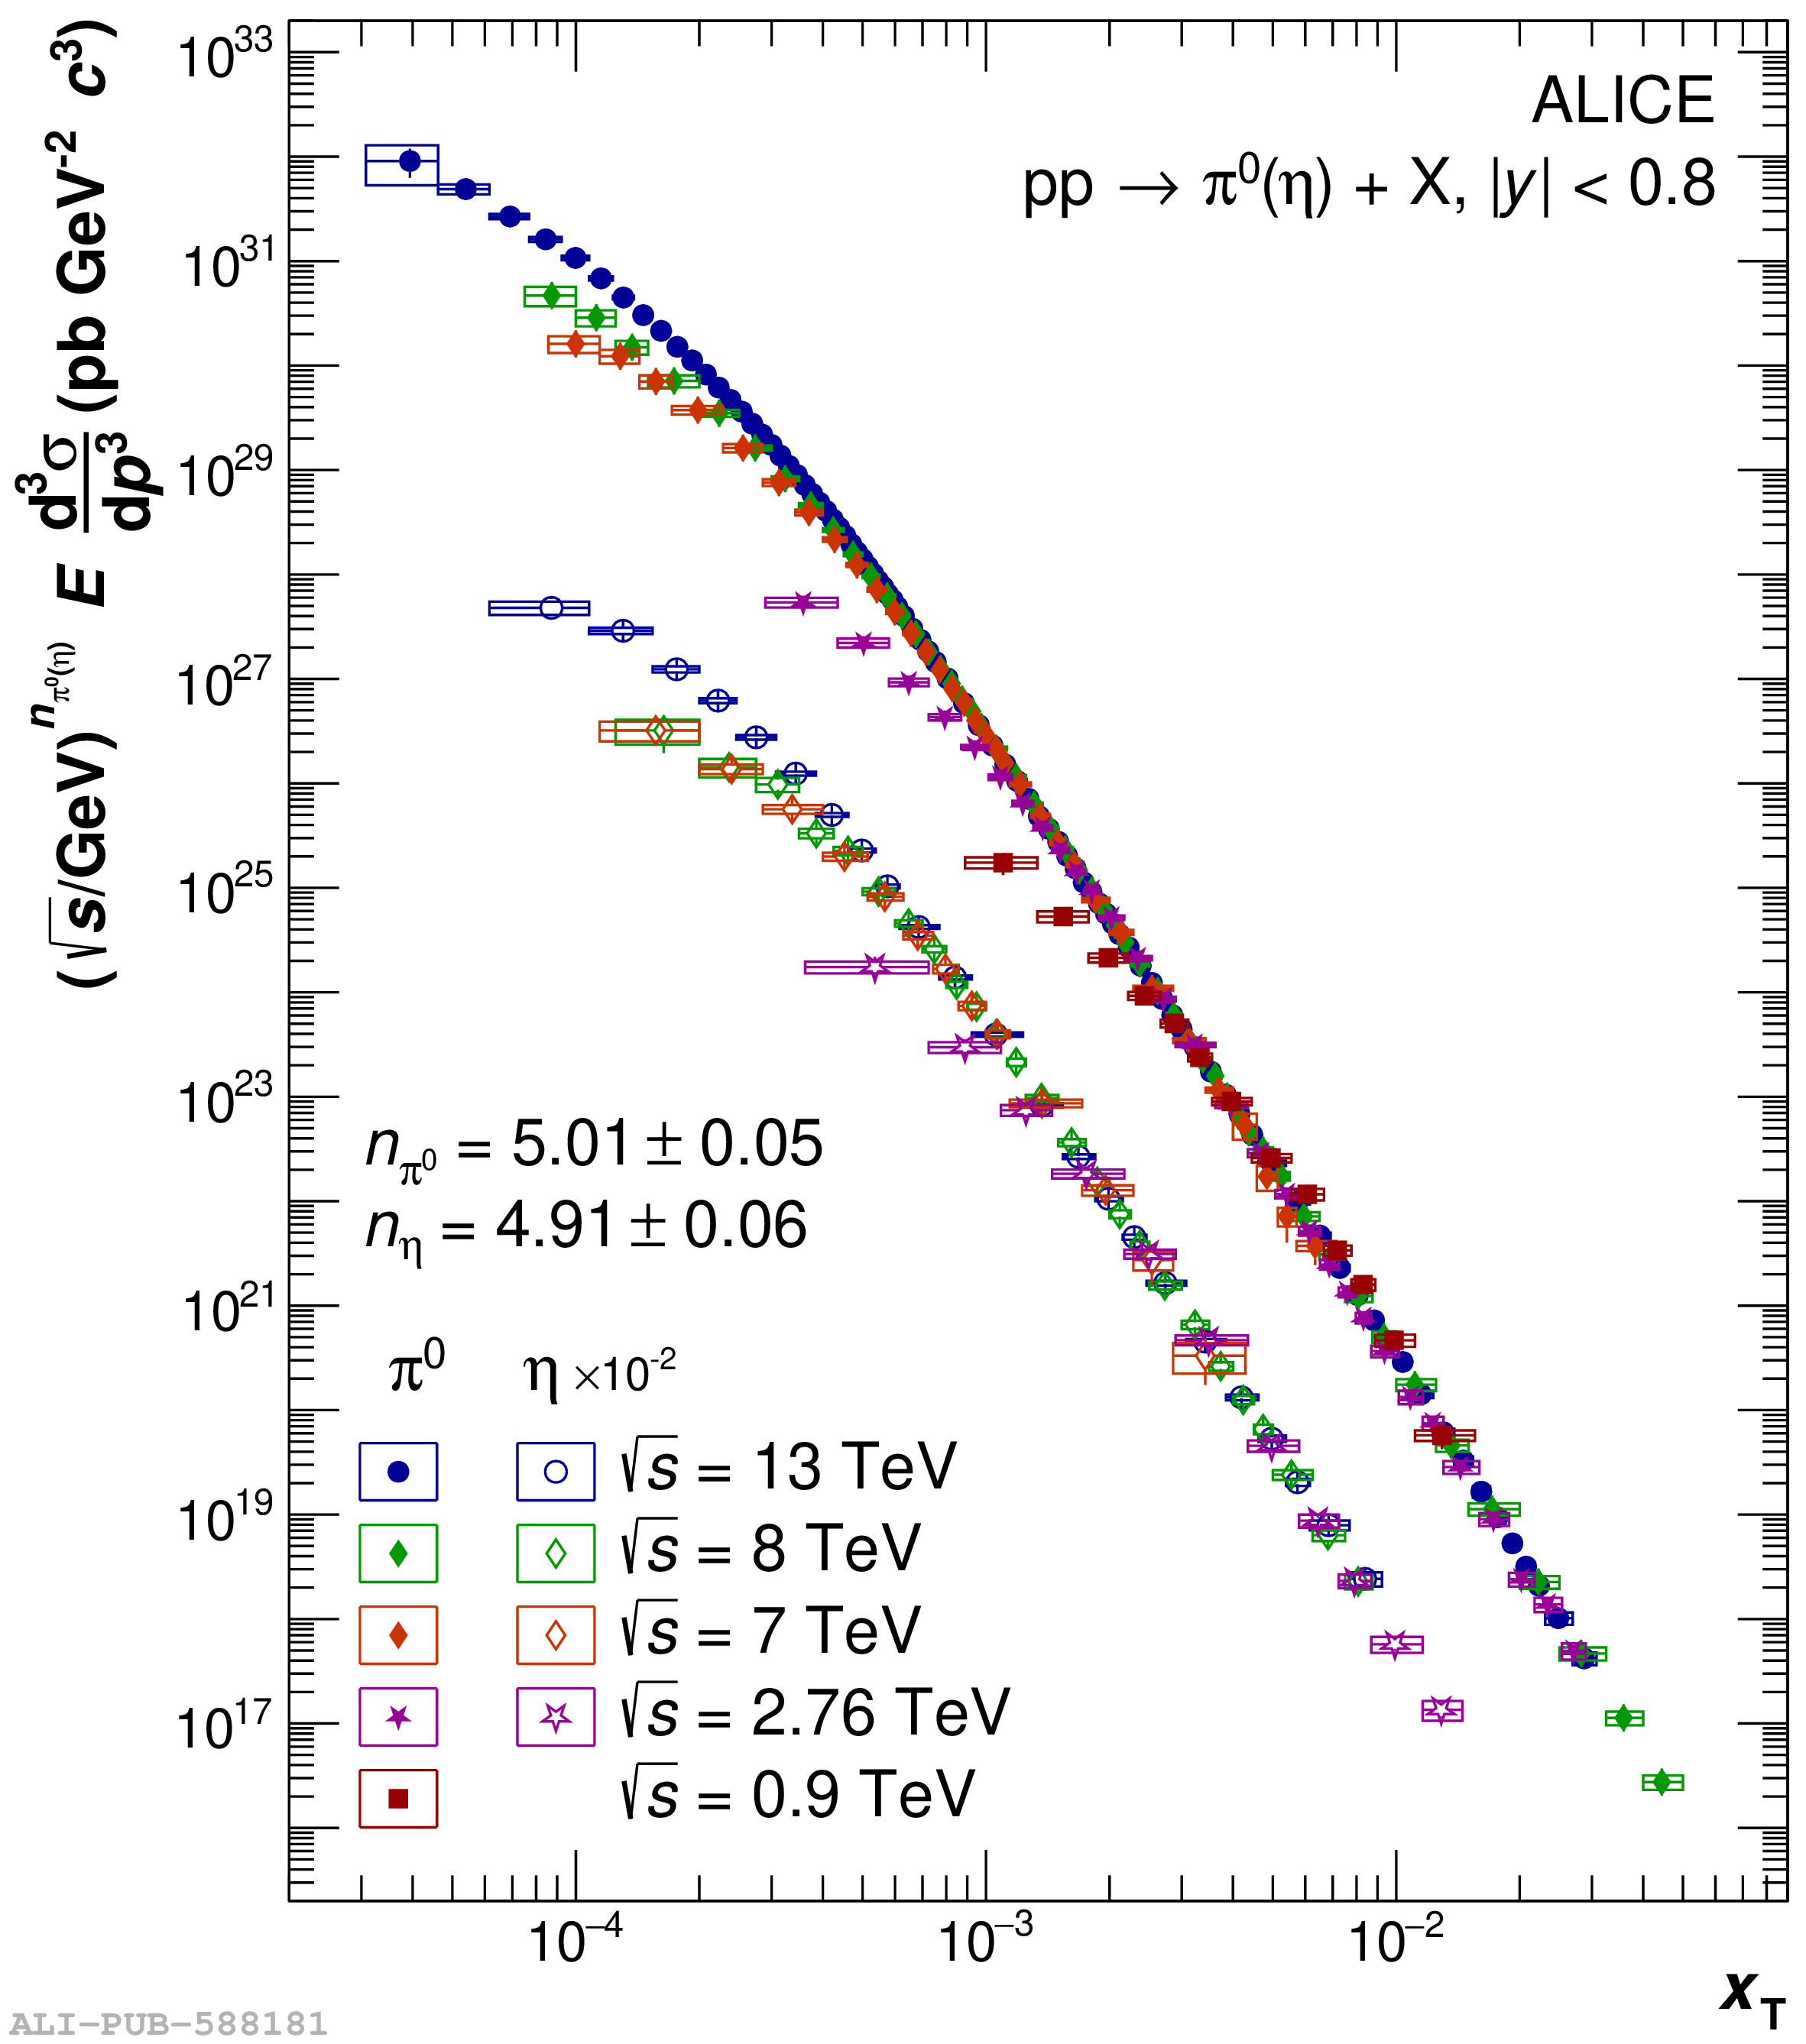
(left) Parameter $n$ as a function of \xT for several \piz (top) and \et (bottom) spectra ratios at different collision energies. (right) Scaled differential invariant cross section of \piz(left) and \et (right) as a function of \xT at different collision energies from \s= 0.9 \TeV to \s = 13 \TeV .

Figure 10

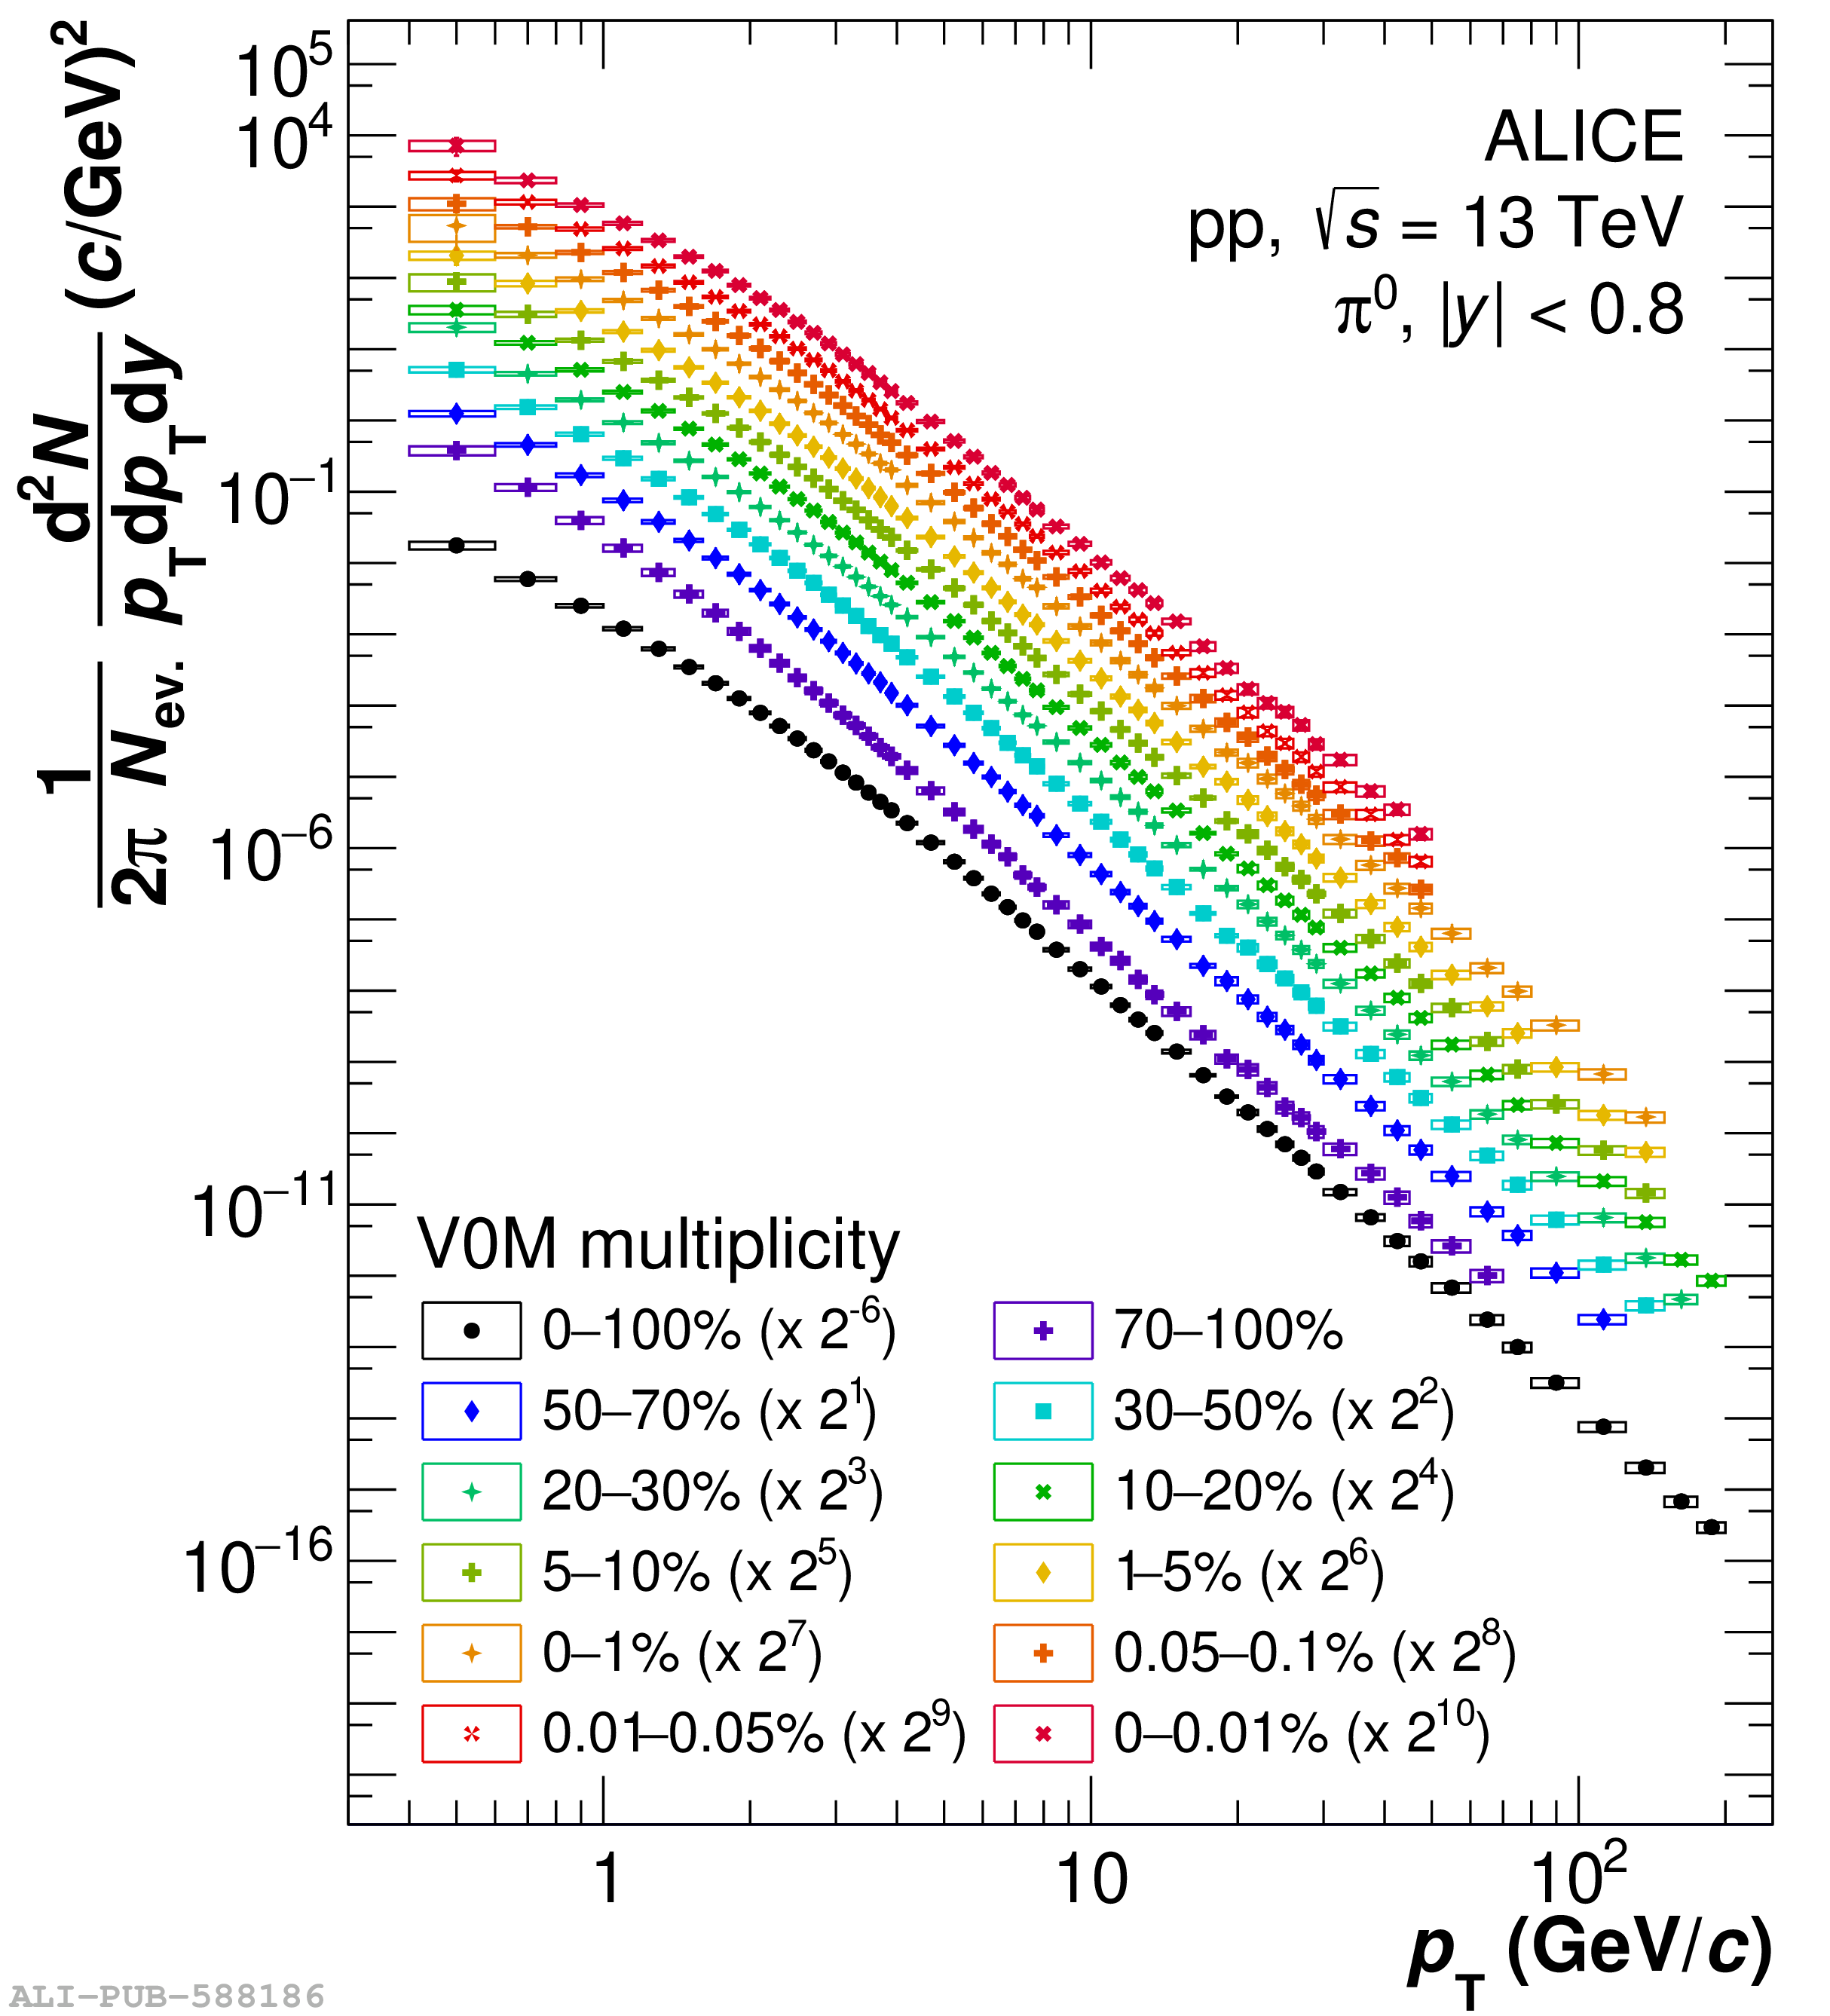
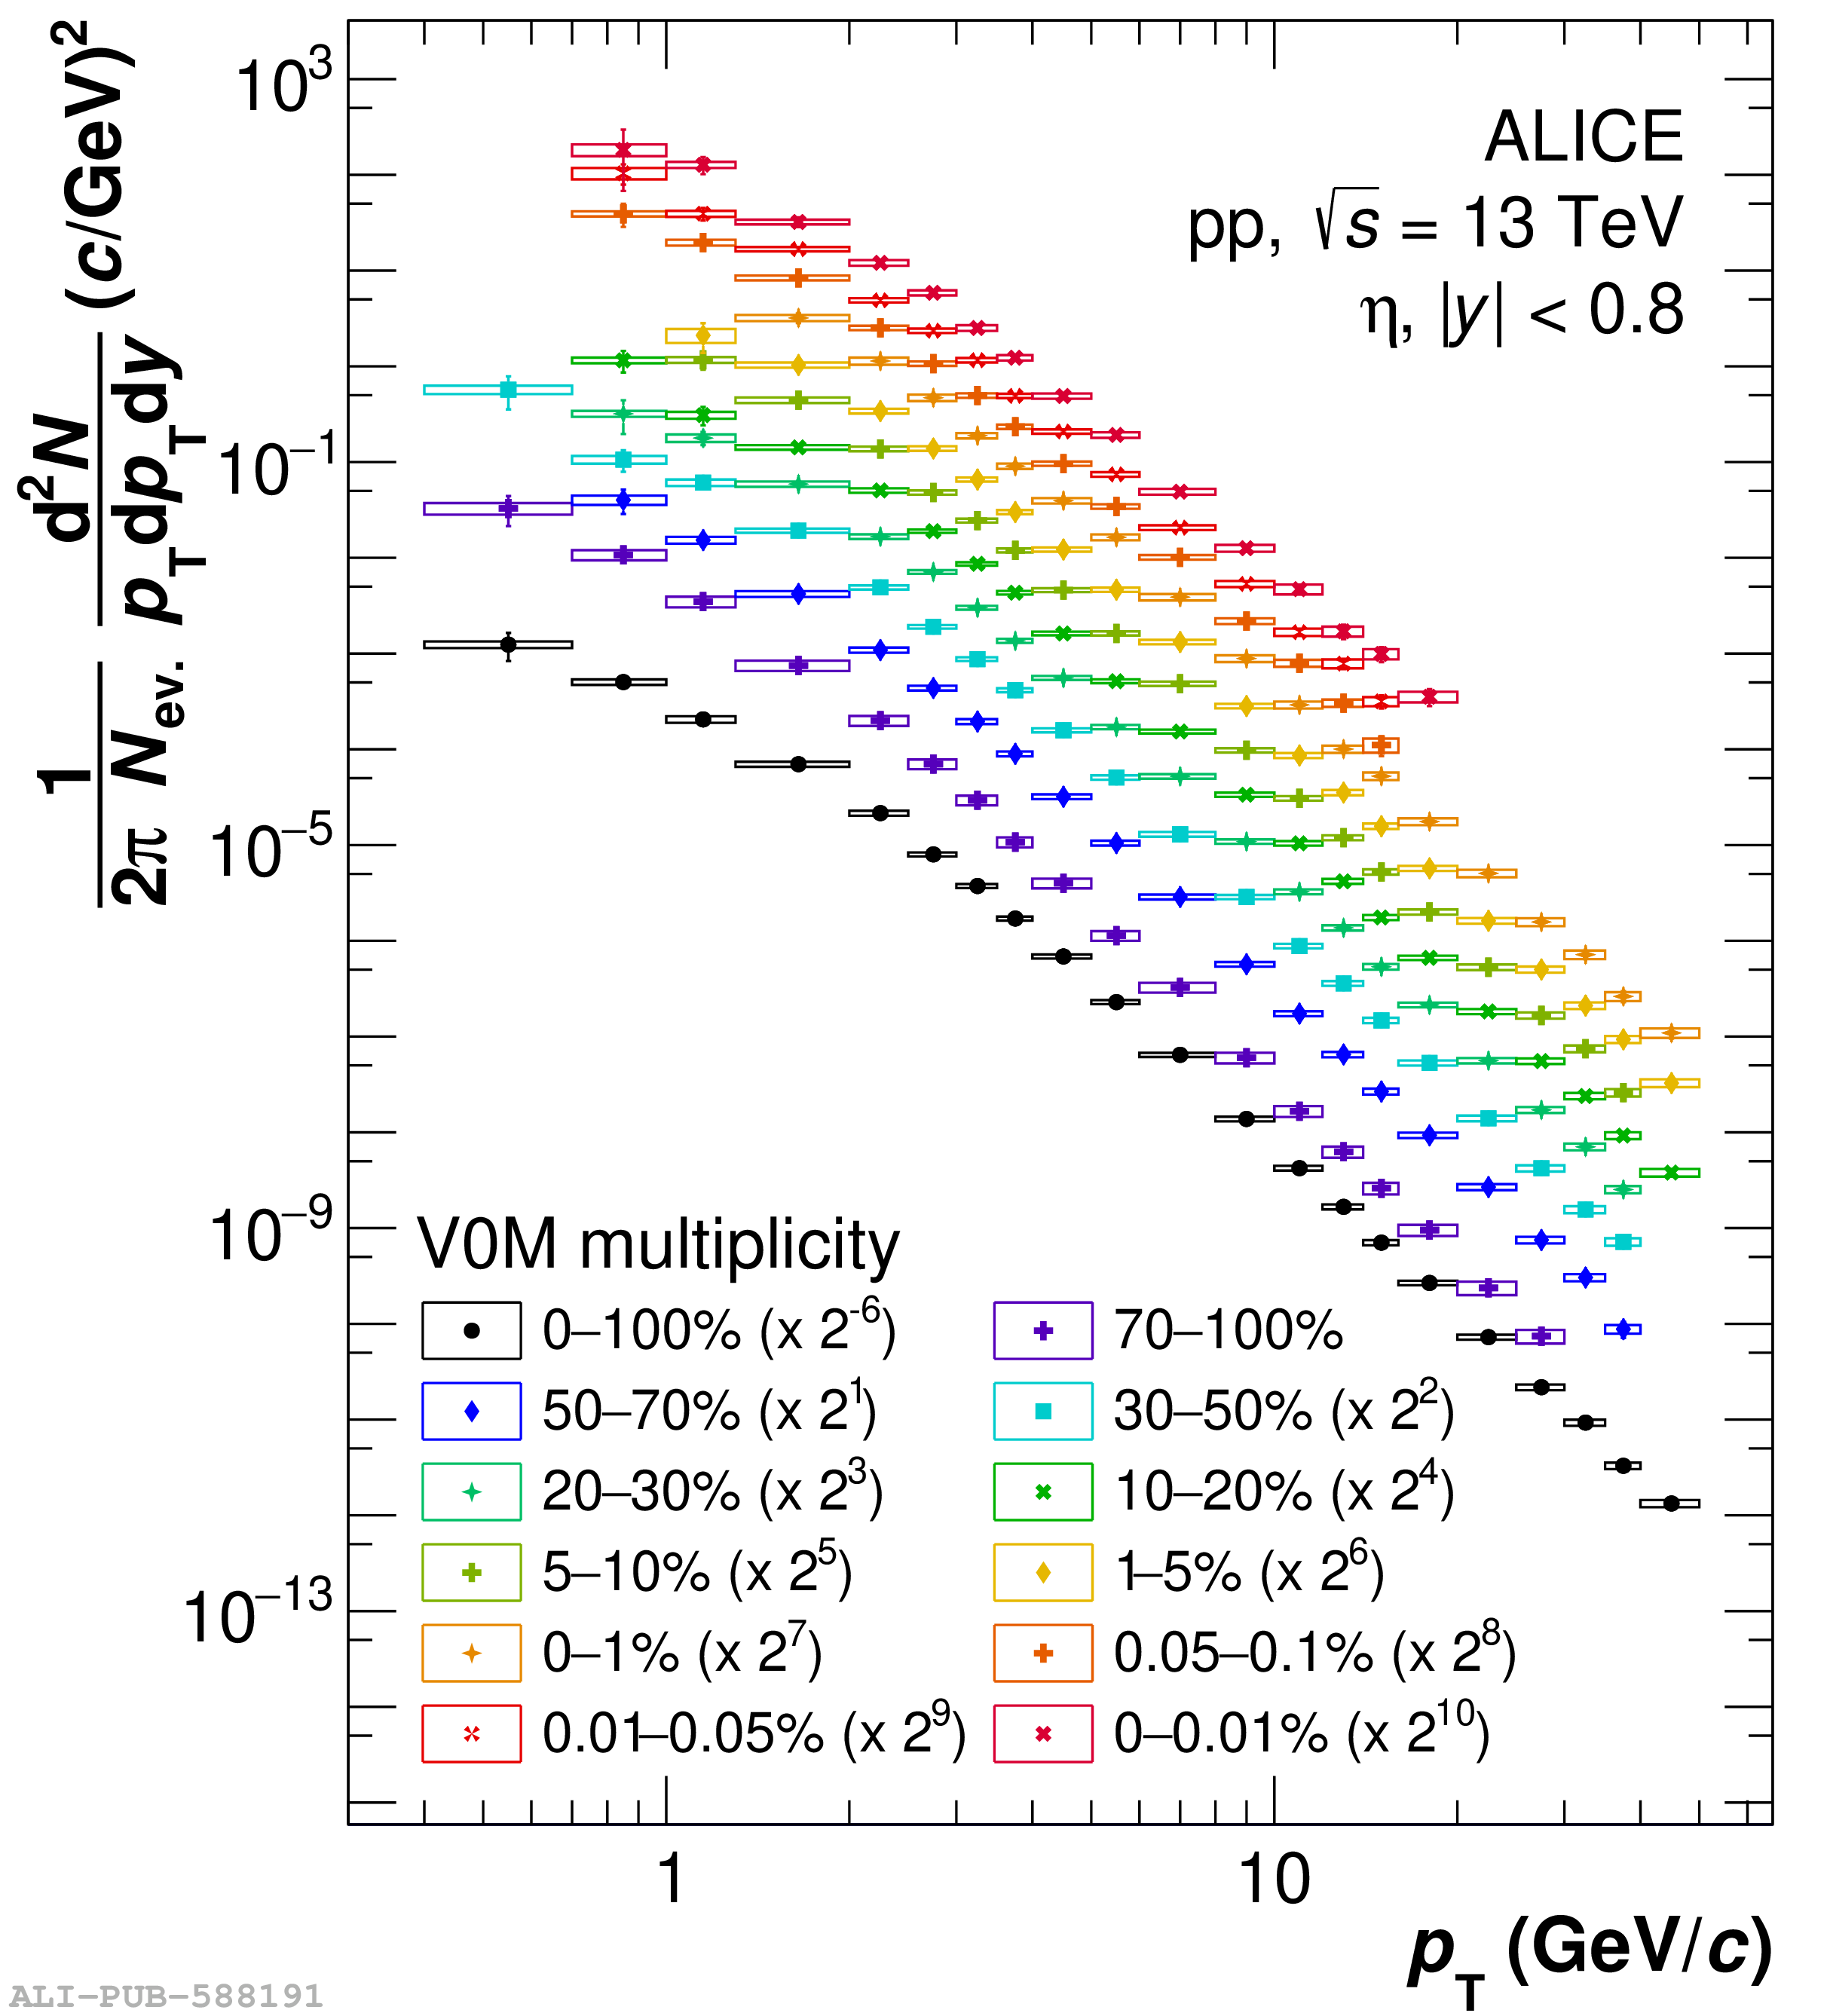
Invariant differential yields of \piz (left) and \et mesons (right) in each selected multiplicity class as defined in \Tab{tab:multClass}. Spectra are scaled for better visibility.

Figure 11

Ratios of the invariant differential yields of \piz (left) and \et mesons (right) to the spectra obtained in the INEL$>$0 event class together with predictions from PYTHIA8 with the Rope and Monash tunes as well as EPOS LHC.

Figure 12

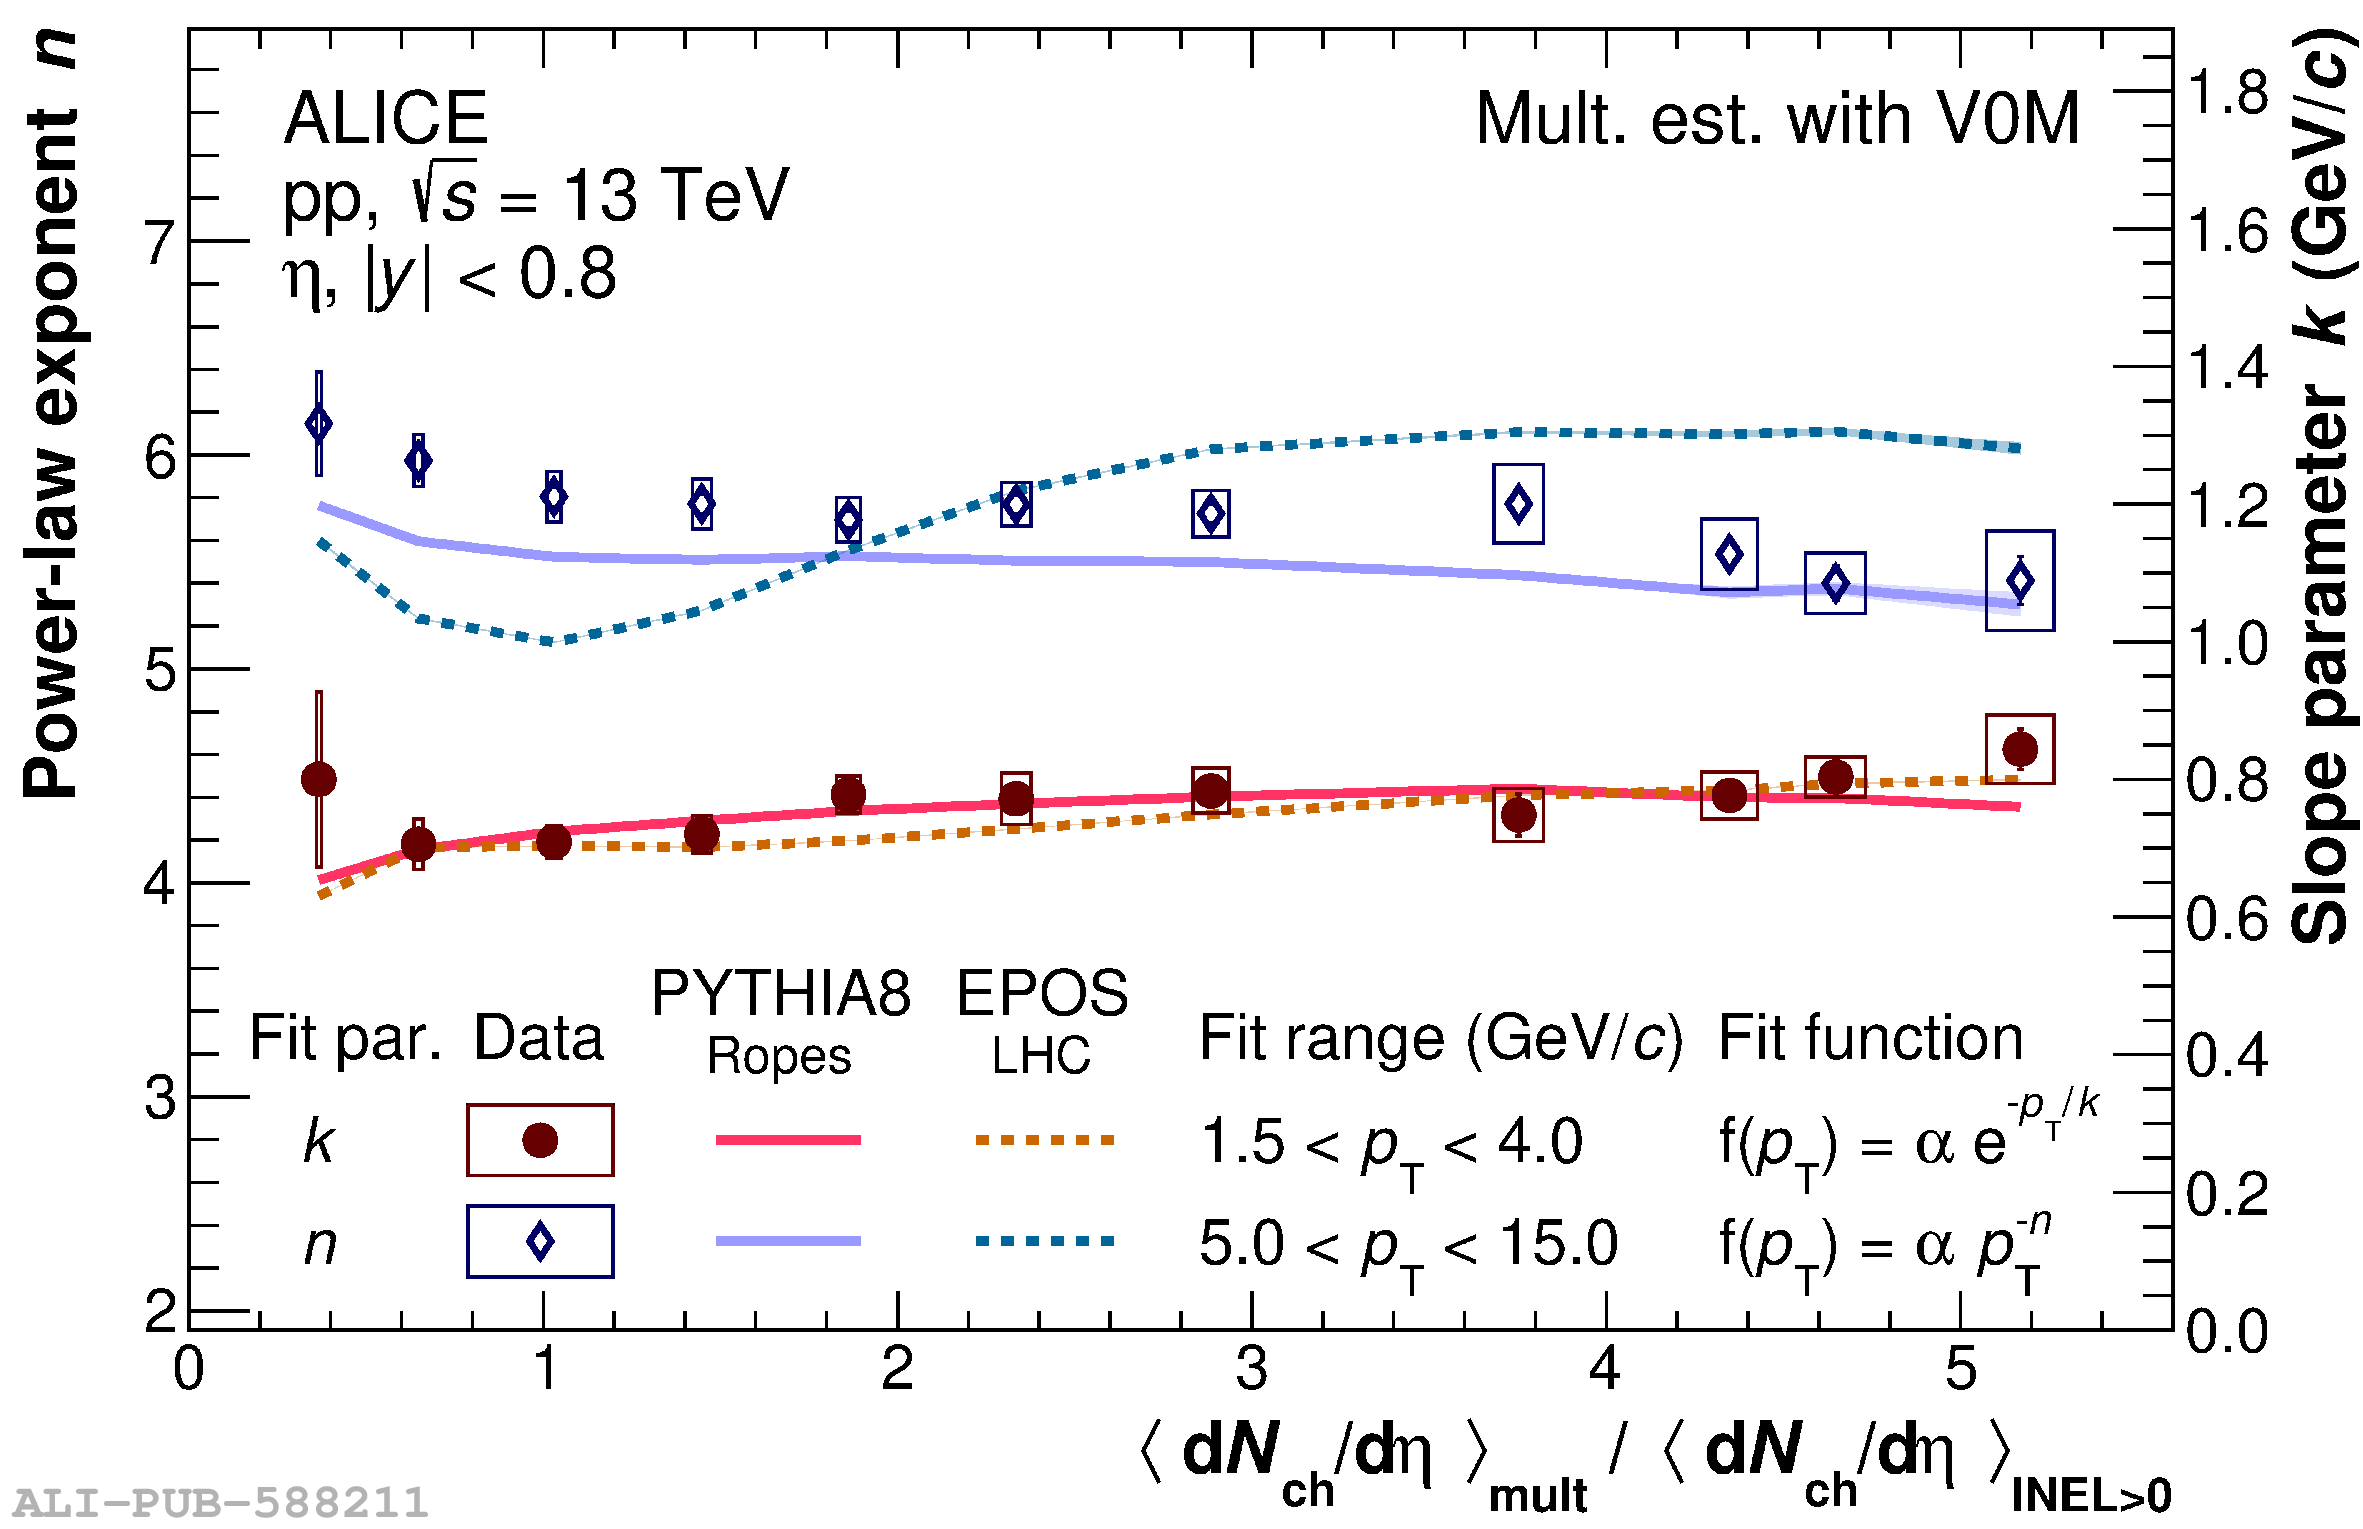
Parameters of a power-law fit and an exponential fit as a function the charged-particle multiplicity density in units of the average multiplicity density for the INEL$>$0 event class for the neutral pion (left) and the \et meson (right). The data are compared to predictions from PYTHIA8 Ropes and EPOS LHC.

Figure 13

(left) \etopi ratio for a low and high multiplicity interval, together with the inclusive \etopi ratio. Predictions from EPOS LHC and PYTHIA8 are shown in addition. The lower panel shows the ratio of the \etopi ratios to the inclusive \etopi ratio. \\(right) Mean values of the ratio of the \etopi ratio in a certain multiplicity interval to the INEL$>$0 event class in two \pT intervals as a function of charged-particle multiplicity.