System size and energy dependence of the mean transverse momentum fluctuations at the LHC

Event-by-event fluctuations of the event-wise mean transverse momentum, $\langle p_{\mathrm{T}}\rangle$, of charged particles produced in proton-proton (pp) collisions at $\sqrt{s}$ = 5.02 TeV, Xe-Xe collisions at $\sqrt{s_{\mathrm{NN}}}$ = 5.44 TeV, and Pb-Pb collisions at $\sqrt{s_{\mathrm{NN}}}$ = 5.02 TeV are studied using the ALICE detector based on the integral correlator $\langle\langle \Delta p_{\rm T}\Delta p_{\rm T}\rangle\rangle $. The correlator strength is found to decrease monotonically with increasing produced charged-particle multiplicity measured at midrapidity in all three systems. In Xe-Xe and Pb-Pb collisions, the multiplicity dependence of the correlator deviates significantly from a simple power-law scaling as well as from the predictions of the HIJING and AMPT models. The observed deviation from power-law scaling is expected from transverse radial flow in semicentral to central Xe-Xe and Pb-Pb collisions. In pp collisions, the correlation strength is also studied by classifying the events based on the transverse spherocity, $S_0$, of the particle production at midrapidity, used as a proxy for the presence of a pronounced back-to-back jet topology. Low-spherocity (jetty) events feature a larger correlation strength than those with high spherocity (isotropic). The strength and multiplicity dependence of jetty and isotropic events are well reproduced by calculations with the PYTHIA 8 and EPOS LHC models.


Submitted to: EPJC
e-Print: arXiv:2411.09334 | PDF | inSPIRE
CERN-EP-2024-297
Figure group

Figure 1

(top) Normalized transverse momentum correlator, $\sqrt{ \llangle \Delta p_{{\rm T}1}\Delta p_{{\rm T}2} \rrangle }$$/\llangle p_{\rm T} \rrangle $, shown as a function of the charged-particle multiplicity density, $\langle{\rm d}N_{\rm ch}/{\rm d}\eta \rangle$, measured in the pseudorapidity range $|\eta| 0.8$ in \pp collisions at \s = 5.02 TeV, \XeXe collisions at \snn = 5.44 TeV, and \PbPb collisions at \snn = 5.02 TeV; (bottom) Ratio of values of $\sqrt{ \llangle \Delta p_{{\rm T}1}\Delta p_{{\rm T}2} \rrangle }$$/\llangle p_{\rm T} \rrangle $ measured in \pp and \XeXe collisions to those observed in \PbPb collisions. Statistical and systematic uncertainties are represented by vertical bars and boxes, respectively.

Figure 2

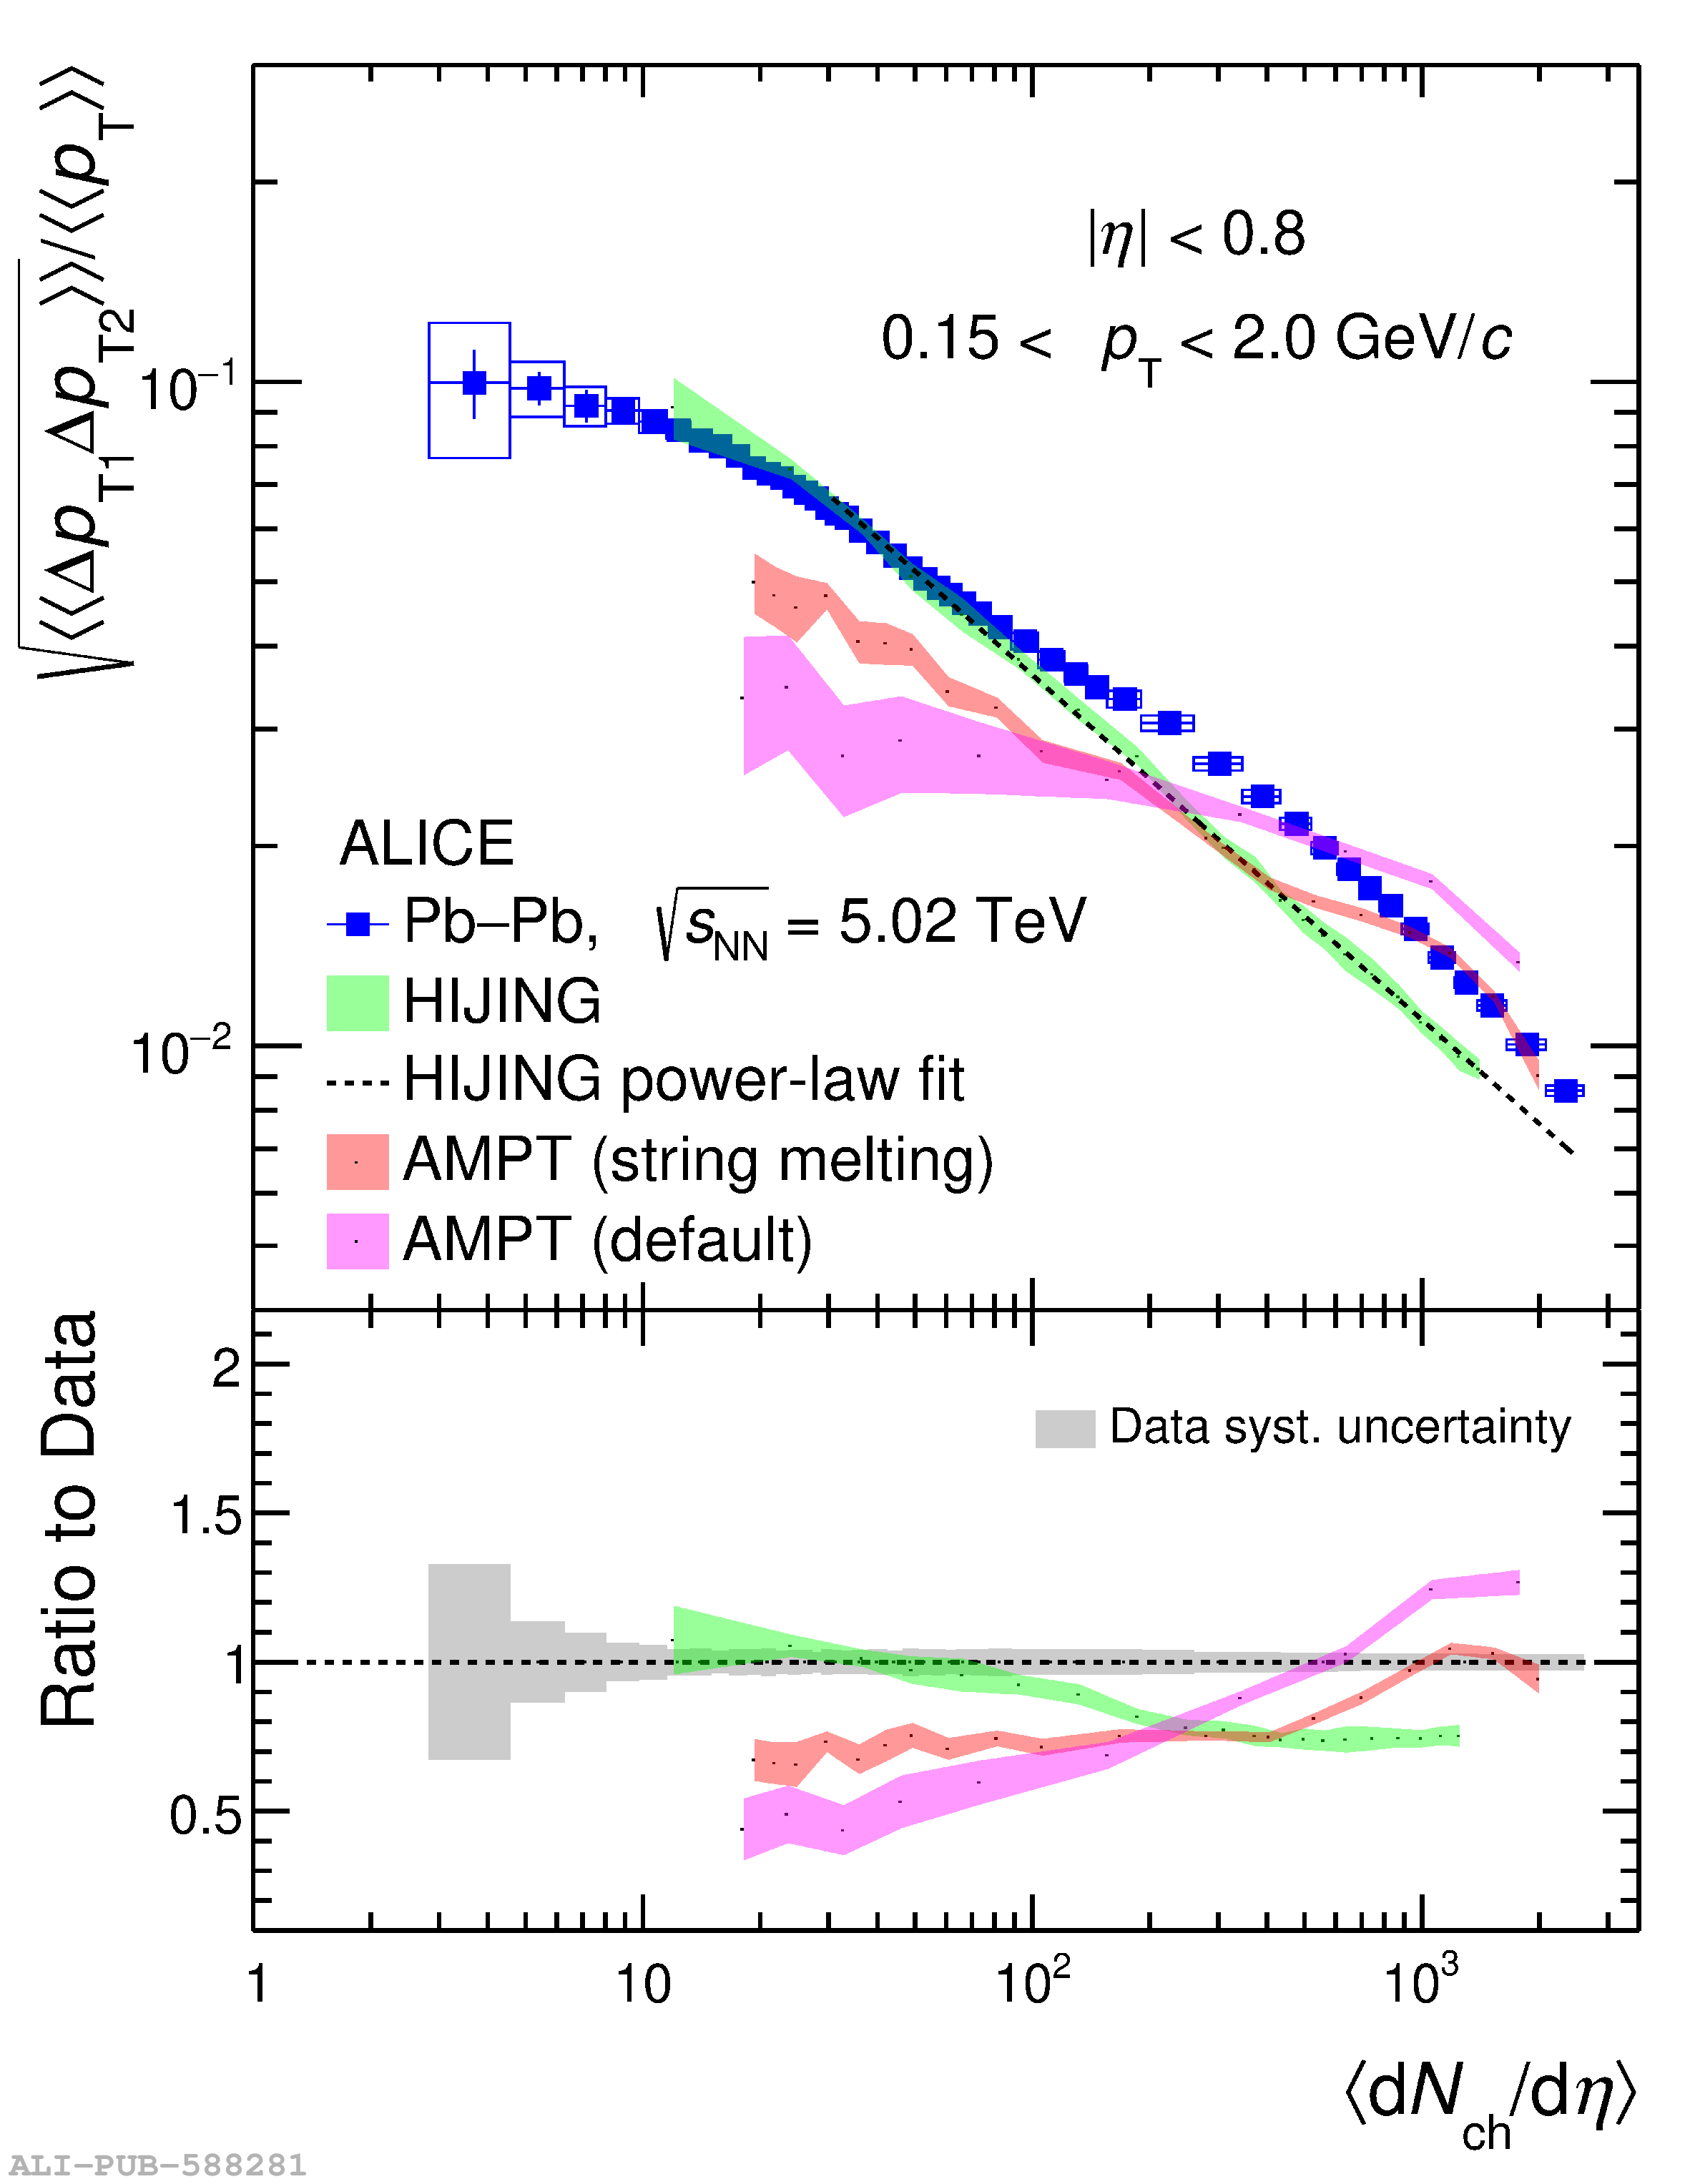
Upper panels: Comparisons of the evolution of the strength of $\sqrt{ \llangle \Delta p_{\rm T1}\Delta p_{\rm T2} \rrangle }/{\llangle p_{\rm T} \rrangle }$ with produced charged-particle multiplicity densities, $\langle {\rm d}N_{\rm ch}/{\rm d}\eta\rangle$, in \PbPb collisions at \snn = 5.02 TeV (left) and \XeXe collisions at \snn = 5.44 TeV (right) with calculations using the HIJING and AMPT models. Lower panels: Ratios of the model calculations to measured $\sqrt{ \llangle \Delta p_{\rm T1}\Delta p_{\rm T2} \rrangle }/{\llangle p_{\rm T} \rrangle }$ Solid symbols represent the measured data with statistical (vertical bars) and systematic (boxes) uncertainties. Model calculations are shown with shaded bands denoting their statistical uncertainty.

Figure 3

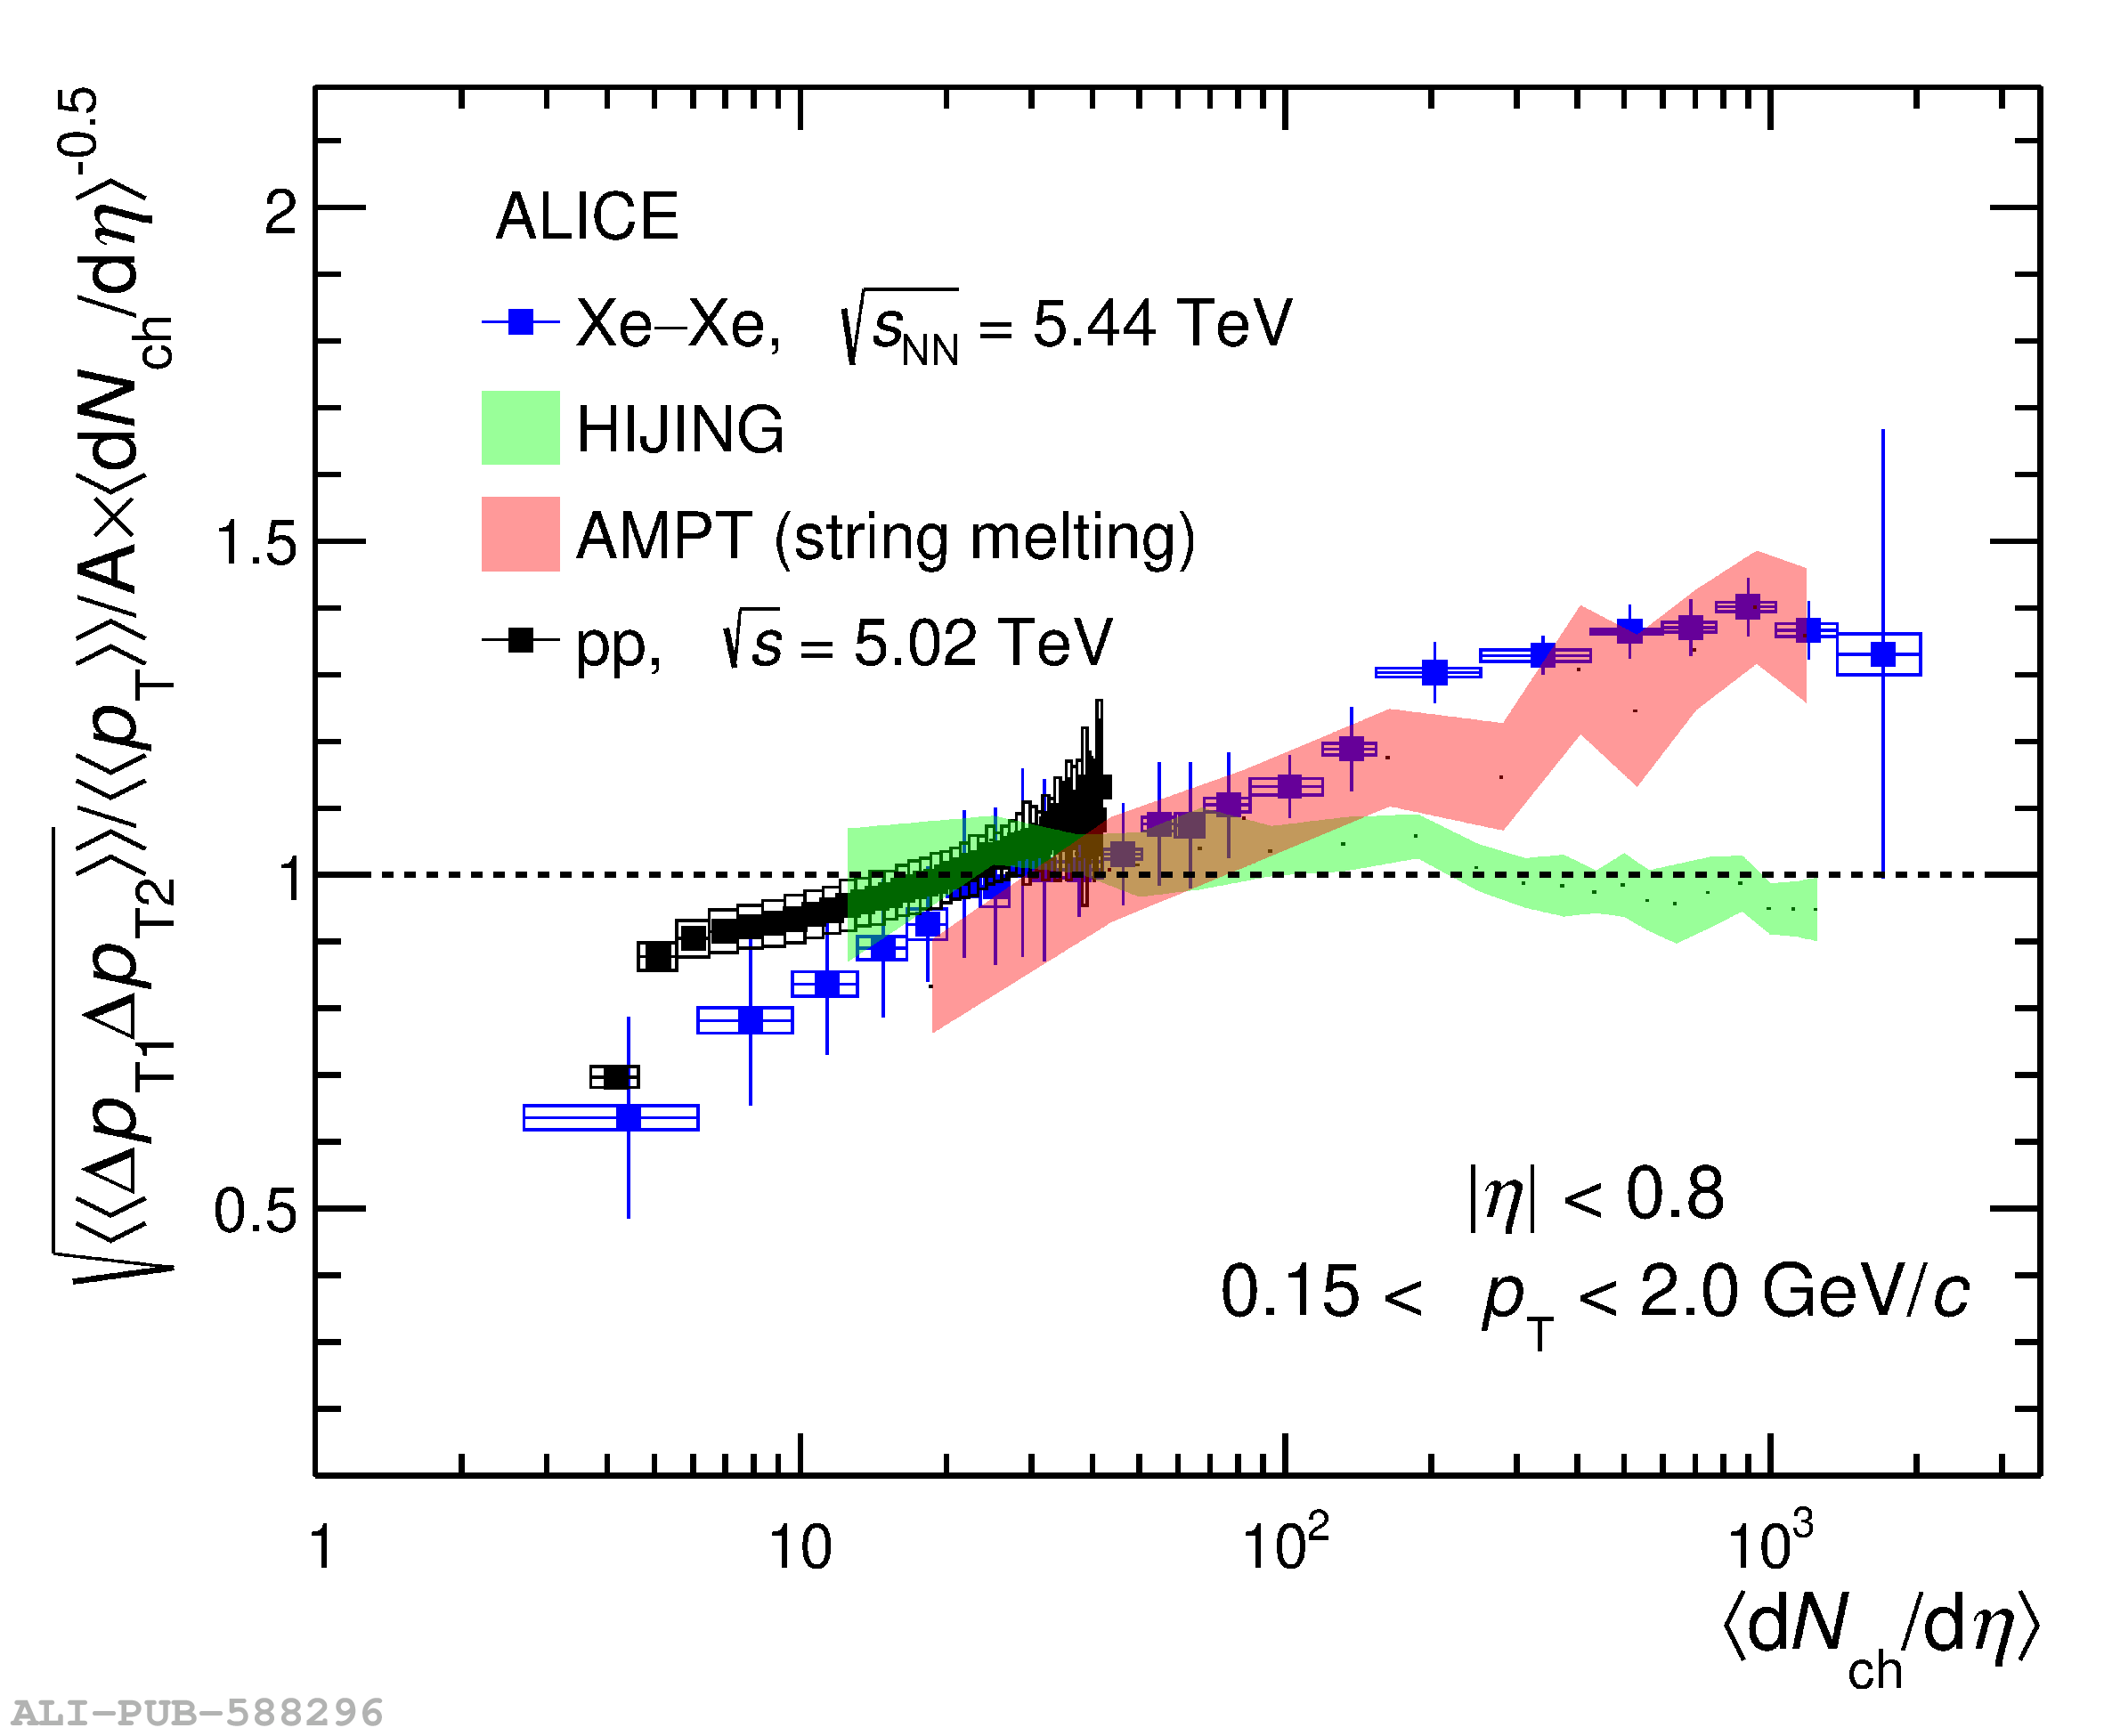
Evolution of the ratio of $\sqrt{ \llangle \Delta p_{\rm T1}\Delta p_{\rm T2} \rrangle }/{\llangle p_{\rm T} \rrangle }$ \ to results of a power-law fit to HIJING calculations: (left) \pp and \PbPb collisions at \snn = 5.02 TeV; (right) \pp collisions at \snn = 5.02 TeV and \XeXe collisions at \snn = 5.44 TeV. The power-law fit was performed on correlator values obtained with HIJING for \PbPb\ collisions at \snn = 5.02 TeV and \XeXe collisions at \snn = 5.44 TeV for left and right panel, respectively, as described in the text. Solid symbols represent the measured data reported in this work with statistical (vertical bars) and systematic (boxes) uncertainties. Calculations of the ratios obtained with HIJING and AMPT calculations are shown with shaded bands denoting their statistical uncertainty.

Figure 4

(top) Normalized transverse momentum correlator, $\sqrt{ \llangle \Delta p_{\rm T1}\Delta p_{\rm T2} \rrangle }/{\llangle p_{\rm T} \rrangle }$, shown as a function of the charged-particle multiplicity density, $\langle{\rm d}N_{\rm ch}/{\rm d}\eta \rangle$, in \PbPb collisions at \snn = 2.76  and 5.02 TeV; (bottom) Ratio of values of $\sqrt{ \llangle \Delta p_{\rm T1}\Delta p_{\rm T2} \rrangle }/{\llangle p_{\rm T} \rrangle }$ measured at \snn = 5.02 TeV to the corresponding results at \snn = 2.76 TeV. The statistical and systematic uncertainties for both energies are represented by vertical bars and boxes, respectively.

Figure 5

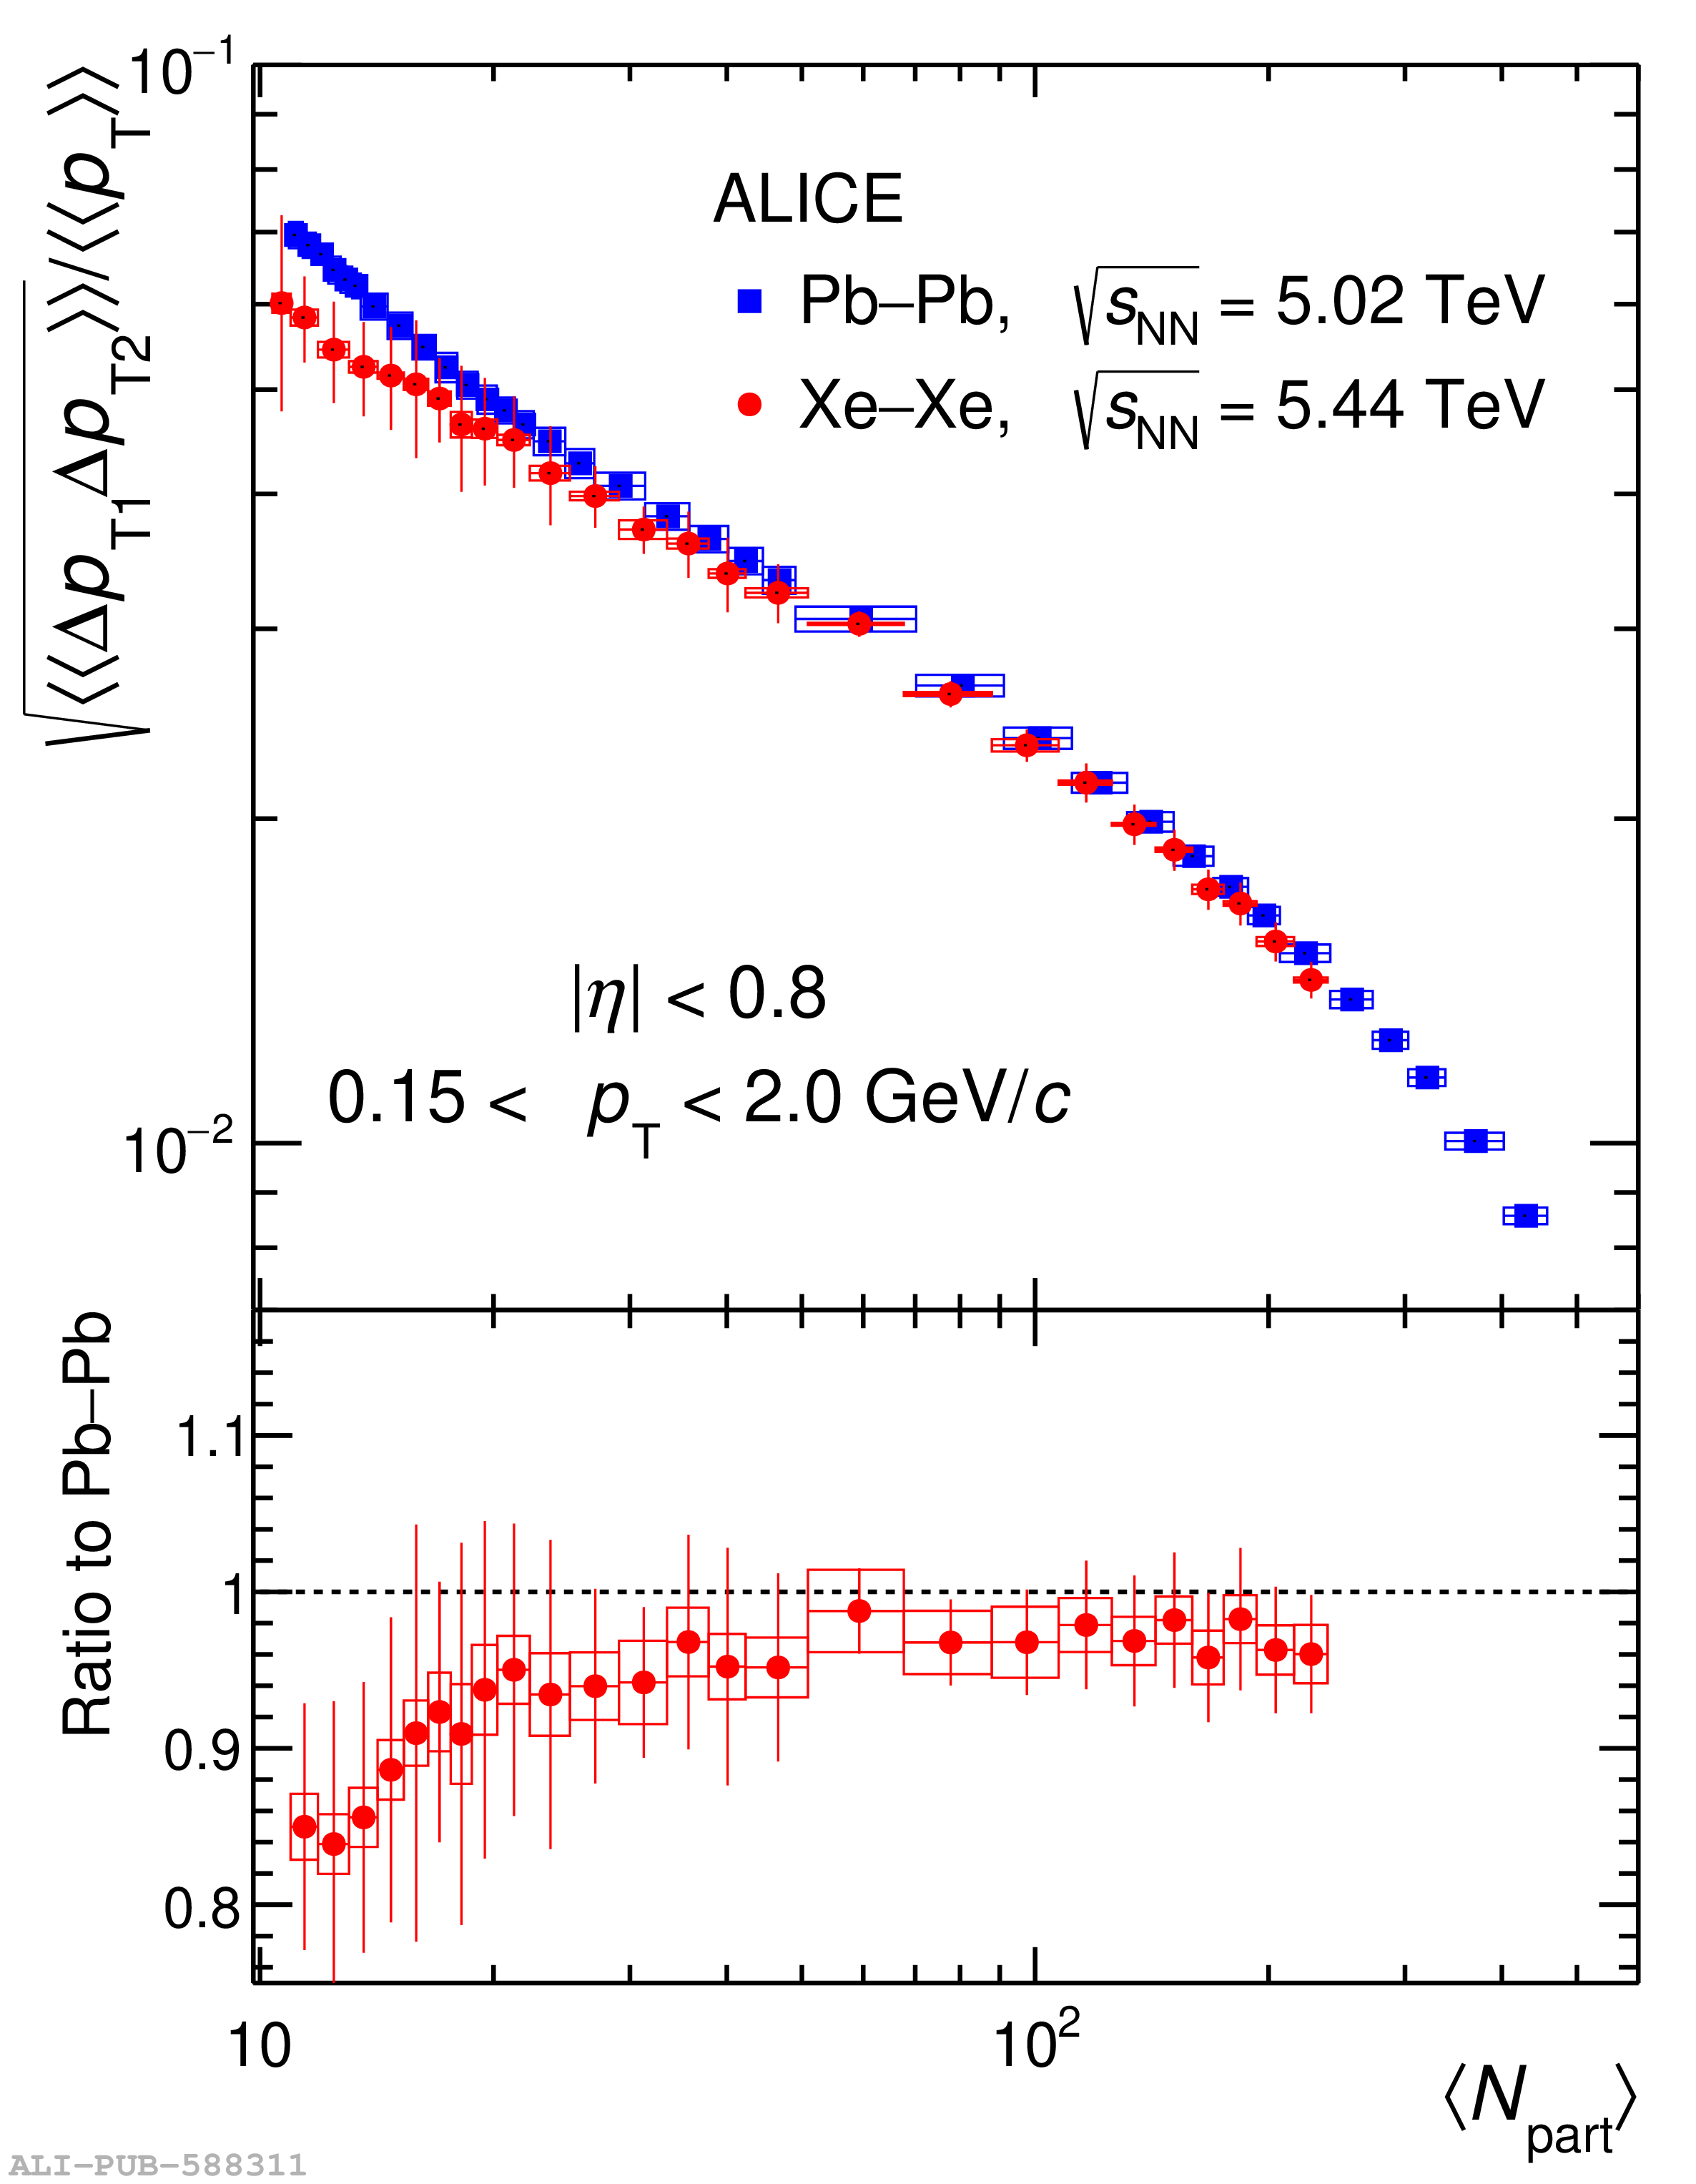
Left: Normalized transverse momentum correlator, $\sqrt{ \llangle \Delta p_{{\rm T}1}\Delta p_{{\rm T}2} \rrangle }/\llangle p_{\rm T} \rrangle $, shown as a function of the average number of participant nucleons, $\langle{ N_{\rm part}}\rangle$, in \PbPb collisions at \snn = 2.76 and 5.02 TeV and Au--Au collisions at 0.2 TeV. right: Normalized transverse momentum correlator, $\sqrt{ \llangle \Delta p_{{\rm T}1}\Delta p_{{\rm T}2} \rrangle }/\llangle p_{\rm T} \rrangle $, plotted as a function $\langle{ N_{\rm part}} \rangle$ in \XeXe collisions at \snn = 5.44 TeV and \PbPb collisions at \snn = 5.02 TeV. The statistical and systematic uncertainties are represented by vertical bars and boxes respectively.

Figure 6

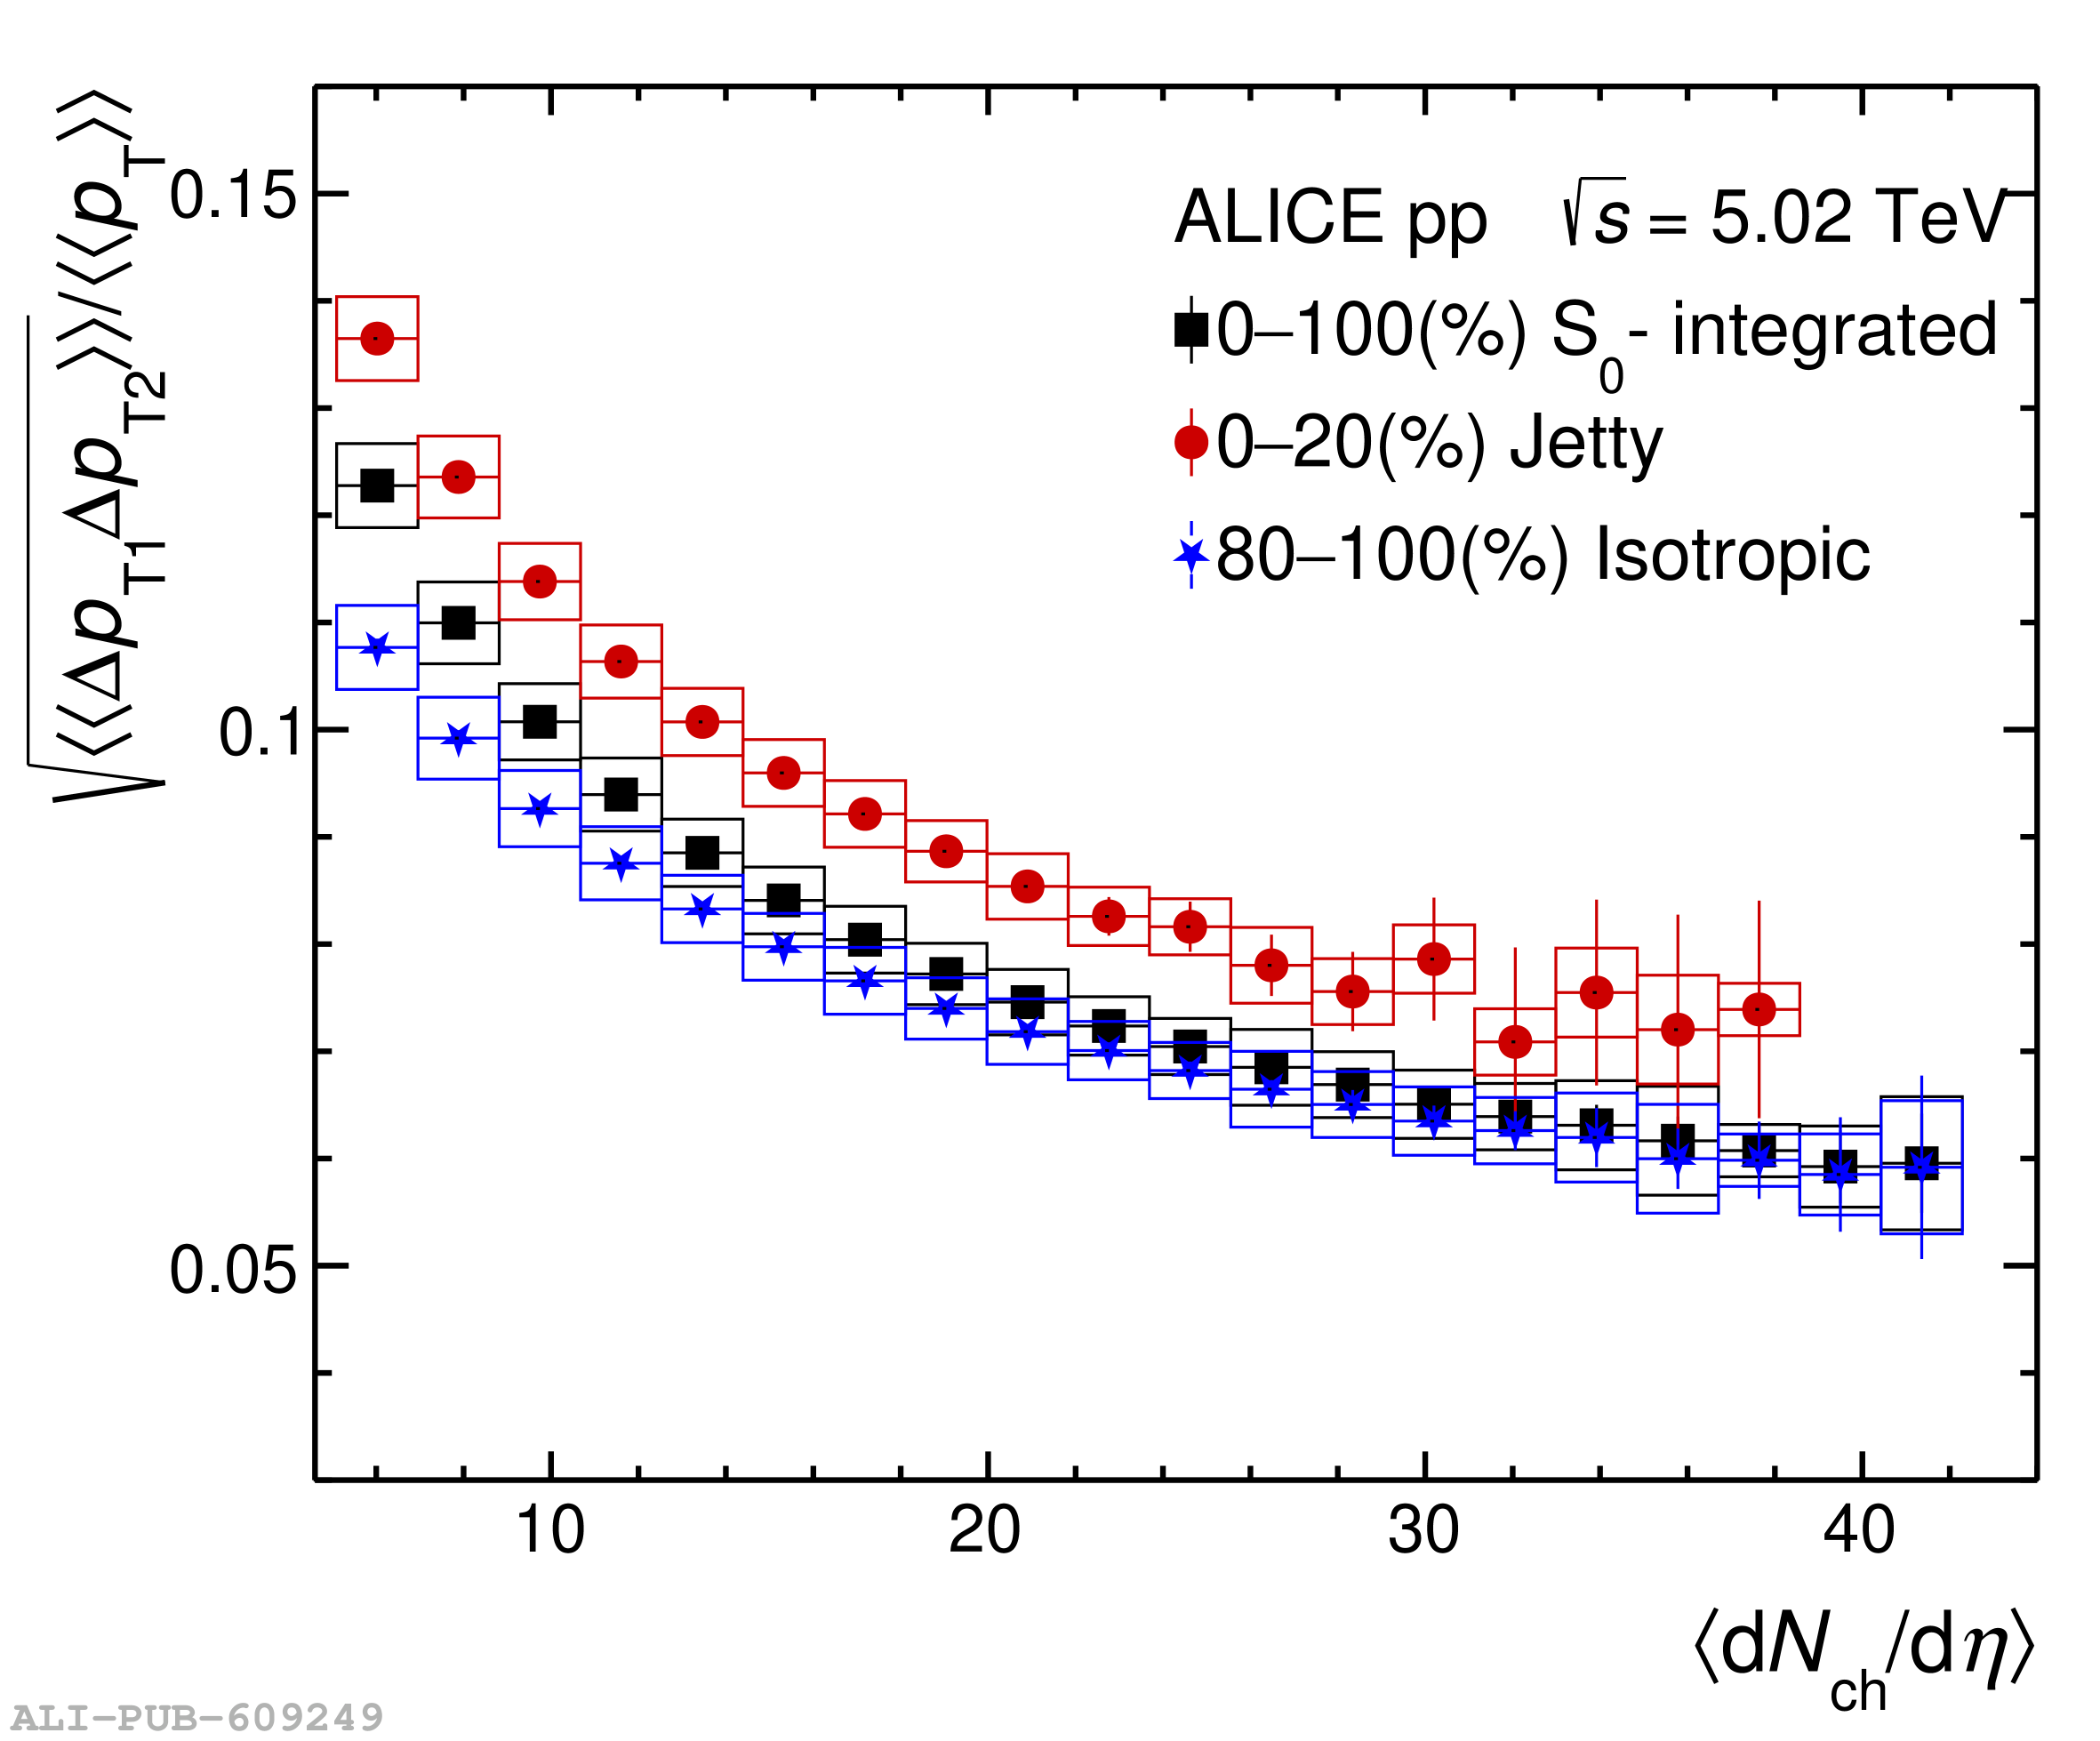
Comparison of the normalized transverse momentum correlator, $\sqrt{ \llangle \Delta p_{{\rm T}1}\Delta p_{{\rm T}2} \rrangle }/\llangle p_{\rm T} \rrangle $ as a function of the charged-particle multiplicity density for spherocity-integrated (black), jetty (red), and isotropic (blue) events in pp collisions at $\sqrt{s}=5.02$ TeV. The statistical and systematic uncertainties of the measured data for all spherocity classes are represented by vertical bars and boxes respectively.

Figure 7

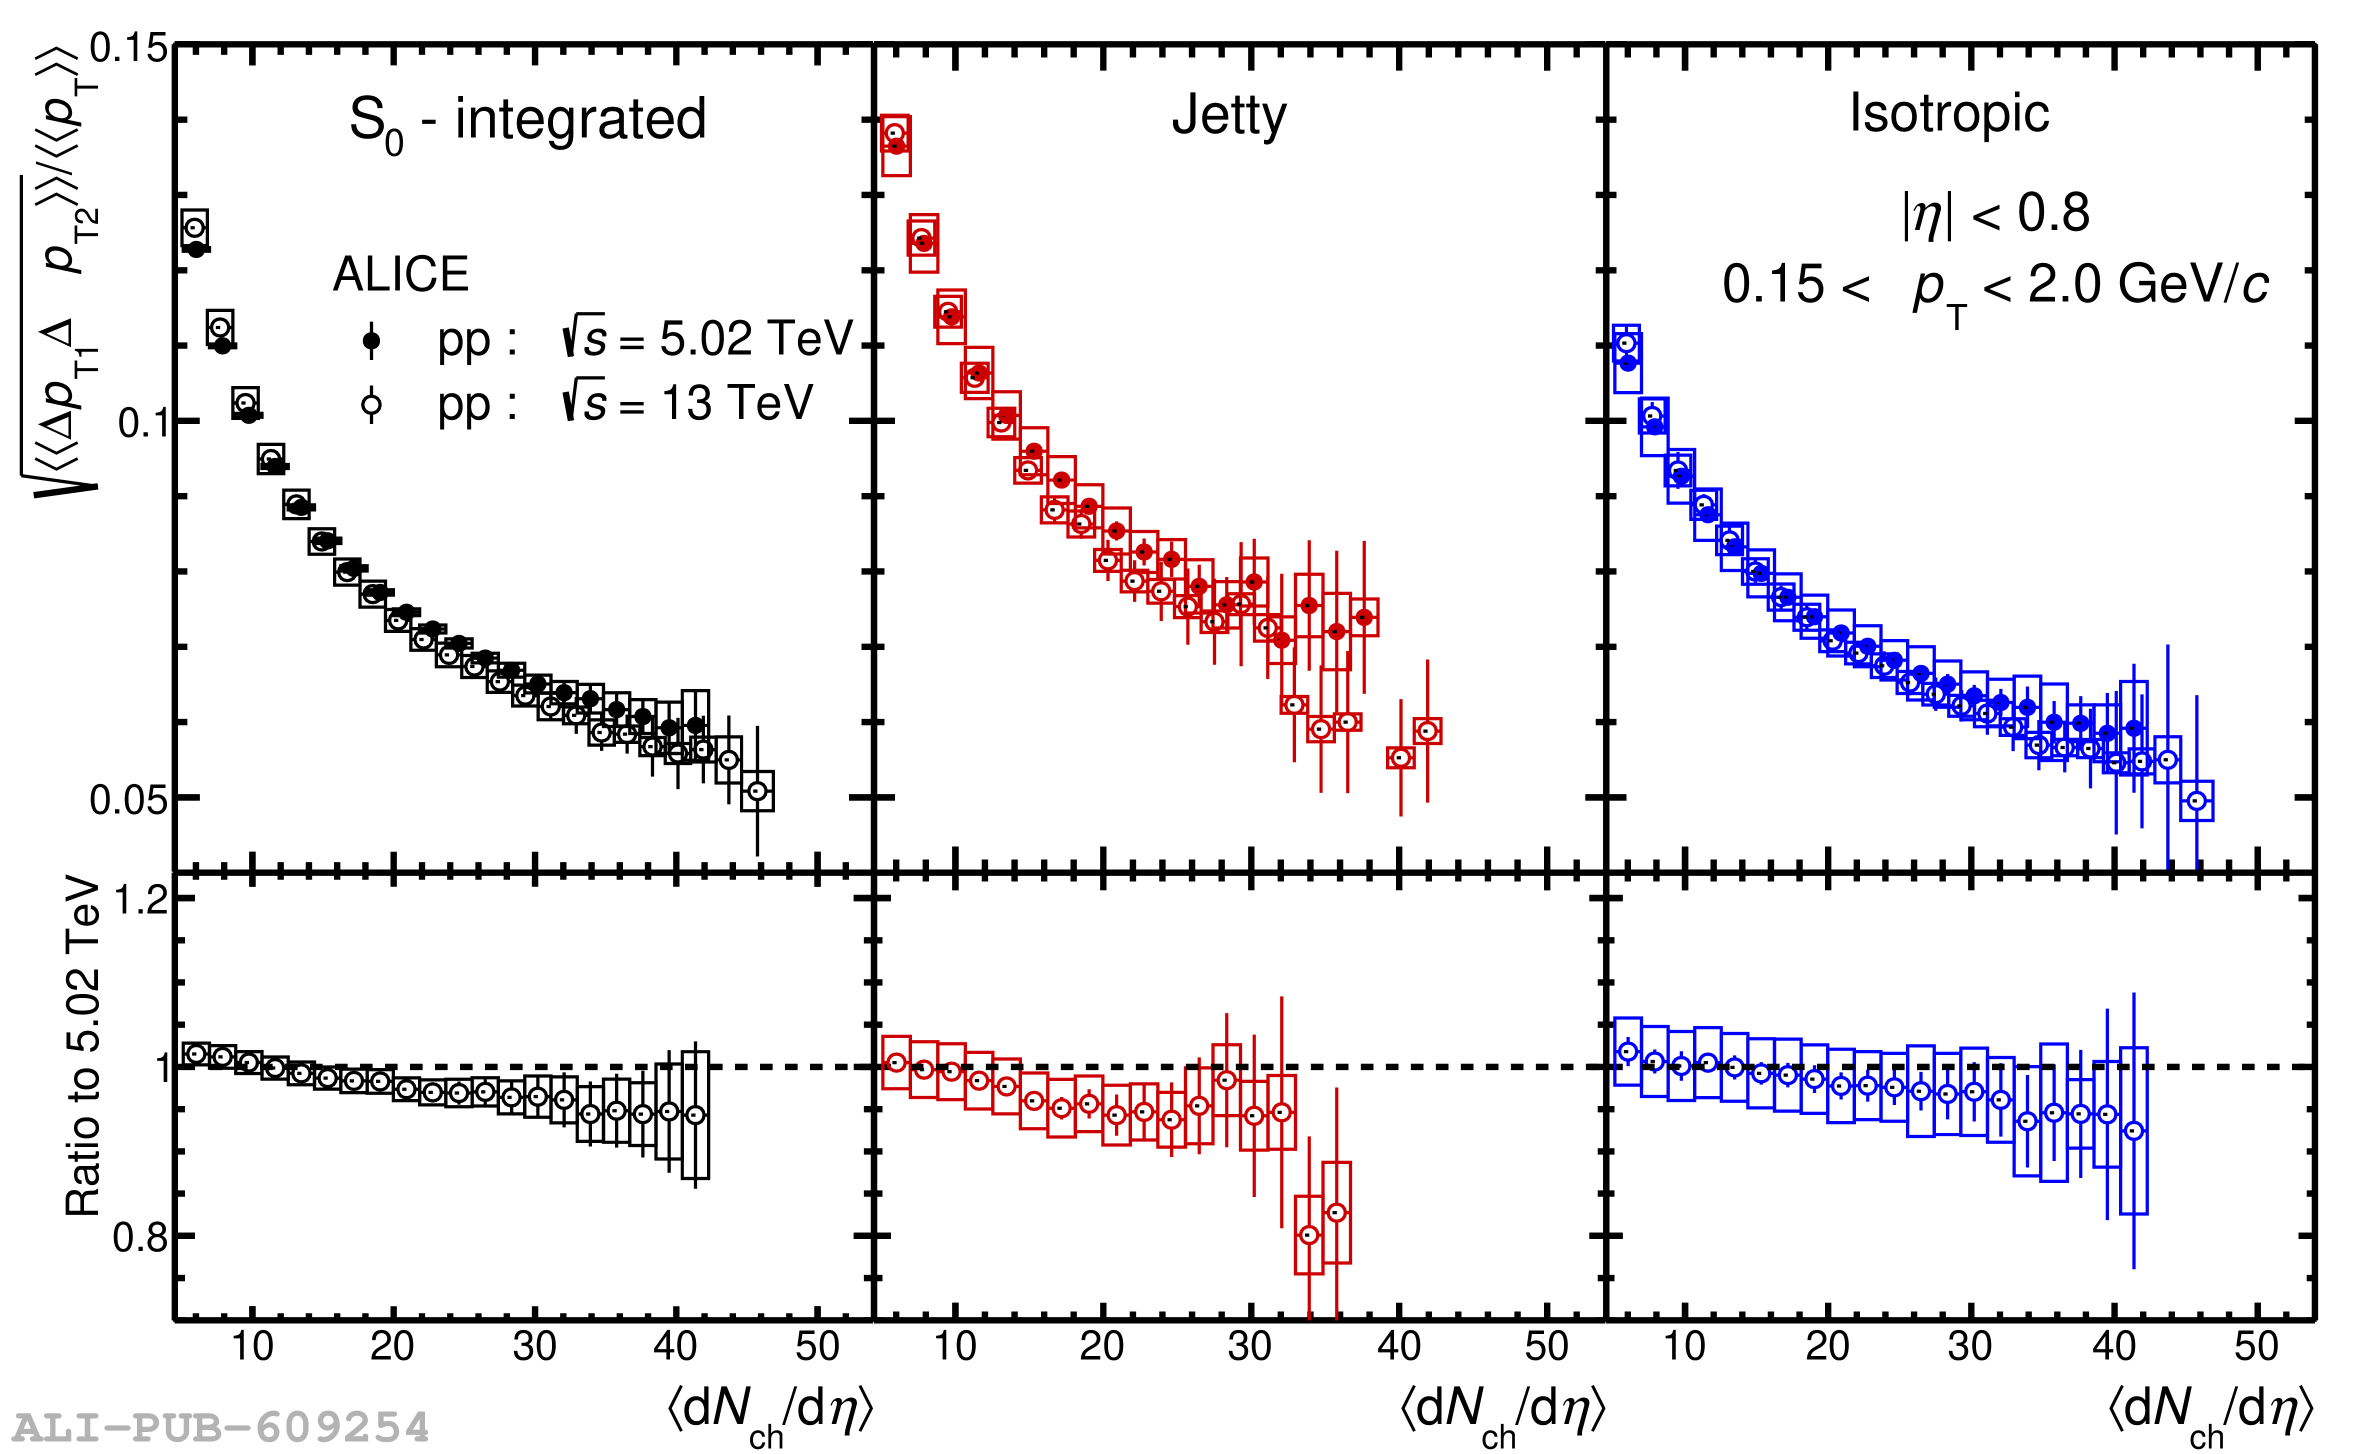
Upper panels: Comparison of the normalized transverse momentum correlator, $\sqrt{ \llangle \Delta p_{{\rm T}1}\Delta p_{{\rm T}2} \rrangle }/\llangle p_{\rm T} \rrangle $ as a function of charged-particle density in pp collisions at $\sqrt{s}=5.02$ and \s = 13 TeV for spherocity-integrated (left), jetty (middle) and isotropic (right) events; Lower panels: Ratio of the $\sqrt{ \llangle \Delta p_{{\rm T}1}\Delta p_{{\rm T}2} \rrangle }/\llangle p_{\rm T} \rrangle $ in pp collisions at $\sqrt{s}=13$ TeV to $\sqrt{s}=5.02$ TeV. The statistical and systematic uncertainties of the measured data for all spherocity classes are represented by vertical bars and boxes, respectively.

Figure 8

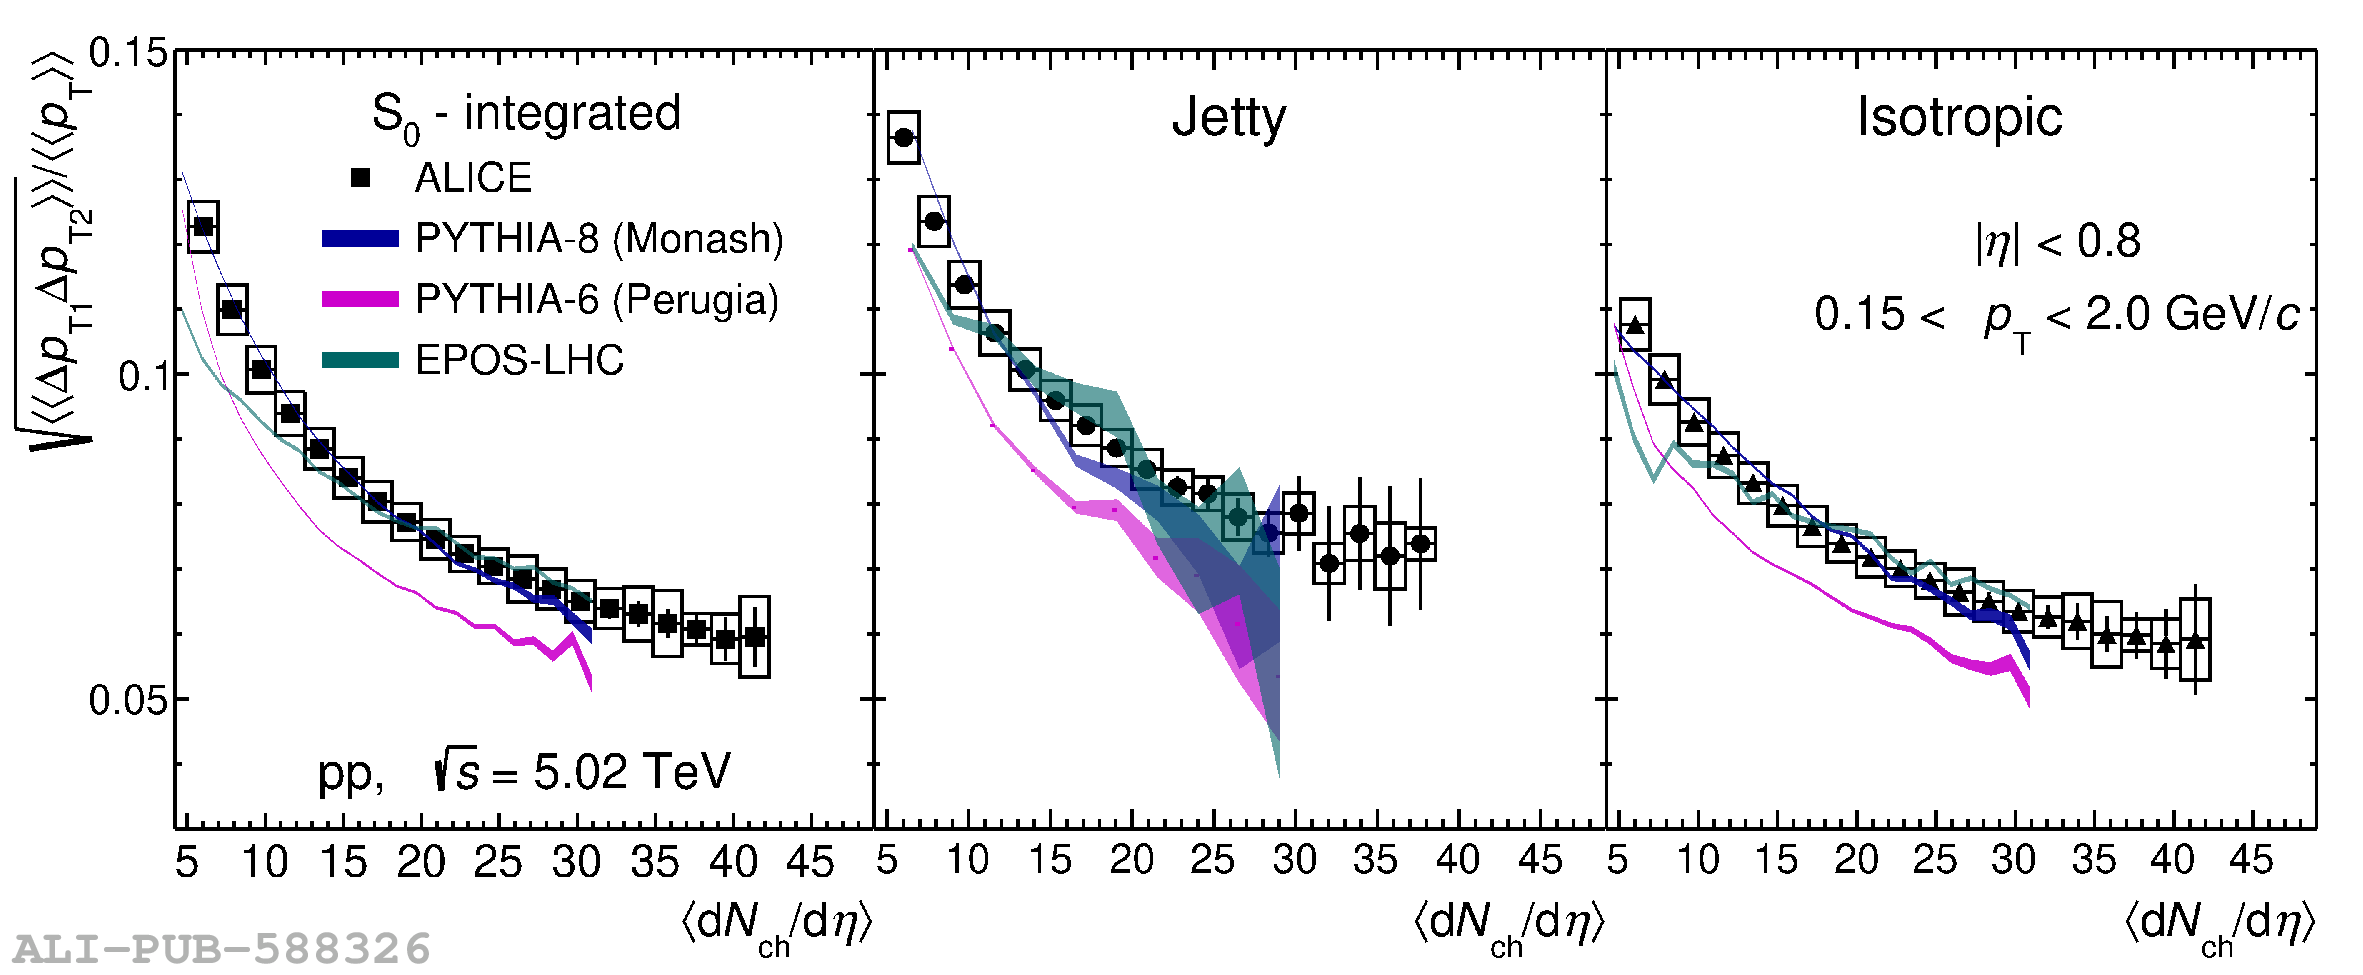
Comparison of normalized transverse momentum correlator, $\sqrt{\llangle \Delta p_{{\rm T}1}\Delta p_{{\rm T}2} \rrangle }/\llangle p_{\rm T} \rrangle $ as a function of the produced particle multiplicity for integrated (left), jetty (middle), and isotropic (right) pp collisions at \s = 5.02 TeV with calculations from the PYTHIA and EPOS models. See text for details. The statistical and systematic uncertainties of the measured data for all spherocity classes are represented by vertical bars and boxes, respectively.