This study presents the first measurement of the f$_{1}$(1285) resonance using the ALICE detector in inelastic proton-proton collisions at a center-of-mass energy of 13 TeV. The resonance is reconstructed at midrapidity ($|y| <~$ 0.5) through the hadronic decay channel f$_{1} (1285) \rightarrow \mathrm{K^{0}_{S} K^{\pm}\pi^{\mp}}$. Key measurements include the determination of its mass, transverse-momentum integrated yield, and average transverse momentum. Additionally, the ratio of the transverse-momentum integrated yield of f$_{1}$(1285) to pion is compared with calculations from the canonical statistical hadronization model. The model calculation, assuming a zero total strangeness content for f$_{1}$(1285), reproduces the data within 1$\sigma$ deviation, shedding light on the quark composition of f$_{1}$(1285).
Phys. Lett. B 866 (2025) 139562
HEP Data
e-Print: arXiv:2409.11936 | PDF | inSPIRE
CERN-EP-2024-239
Figure group
Figure 1
Like- and unlike-sign (left) and the like-sign-subtracted (right) invariant massdistribution of K$^0_{\rm S}$K$\pi$ triplets in $|y| < $ 0.5 in minimum-bias pp collisions at $\sqrt{s}$ = 13 TeV. The subtracted distribution is fitted with the function defined by Eq.1, and the dotted blue line describes the residual background distribution, which is given by Eq.2. |   |

Figure 3
Measured ${\rm f}_1(1285)$ mass as a function of $p_{\rm T}$ at midrapidity ($|y| < $ 0.5) in minimum-bias pp collisions at $\sqrt{s} =$ 13 TeV. The statistical and systematic uncertainties are shown as bars and boxes, respectively. The blue band represents the world-average value for the mass of ${\rm f}_1(1285)$ having an uncertainty of 0.5 MeV/$c^{2}$. |  |
Figure 4
$p_{\rm T}$-differential yield of ${\rm f}_1(1285)$ measured at midrapidity ($|y|$ < 0.5) in inelastic pp collisions at $\sqrt{s} = 13$ TeV. The statistical and systematic uncertainties are shown as bars and boxes, respectively. The data points are fitted using a Levy-Tsallis function [89] and shown by the red dashed line. The BR uncertainty for ${\rm f}_1(1285) \longrightarrow {\rm K}^0_{\rm S}{\rm K}^{\pm}\pi^{\mp}$ is 0.1%. |  |
Figure 5
Average transverse momentum of light-flavor hadrons as a function of hadron mass at midrapidity ($|y| < $ 0.5) in inelastic pp collisions at $\sqrt{s} = 13$ TeV. The statistical and systematic uncertainties are shown as bars and boxes, respectively. The blue dotted lines are linear fits to the data points. | 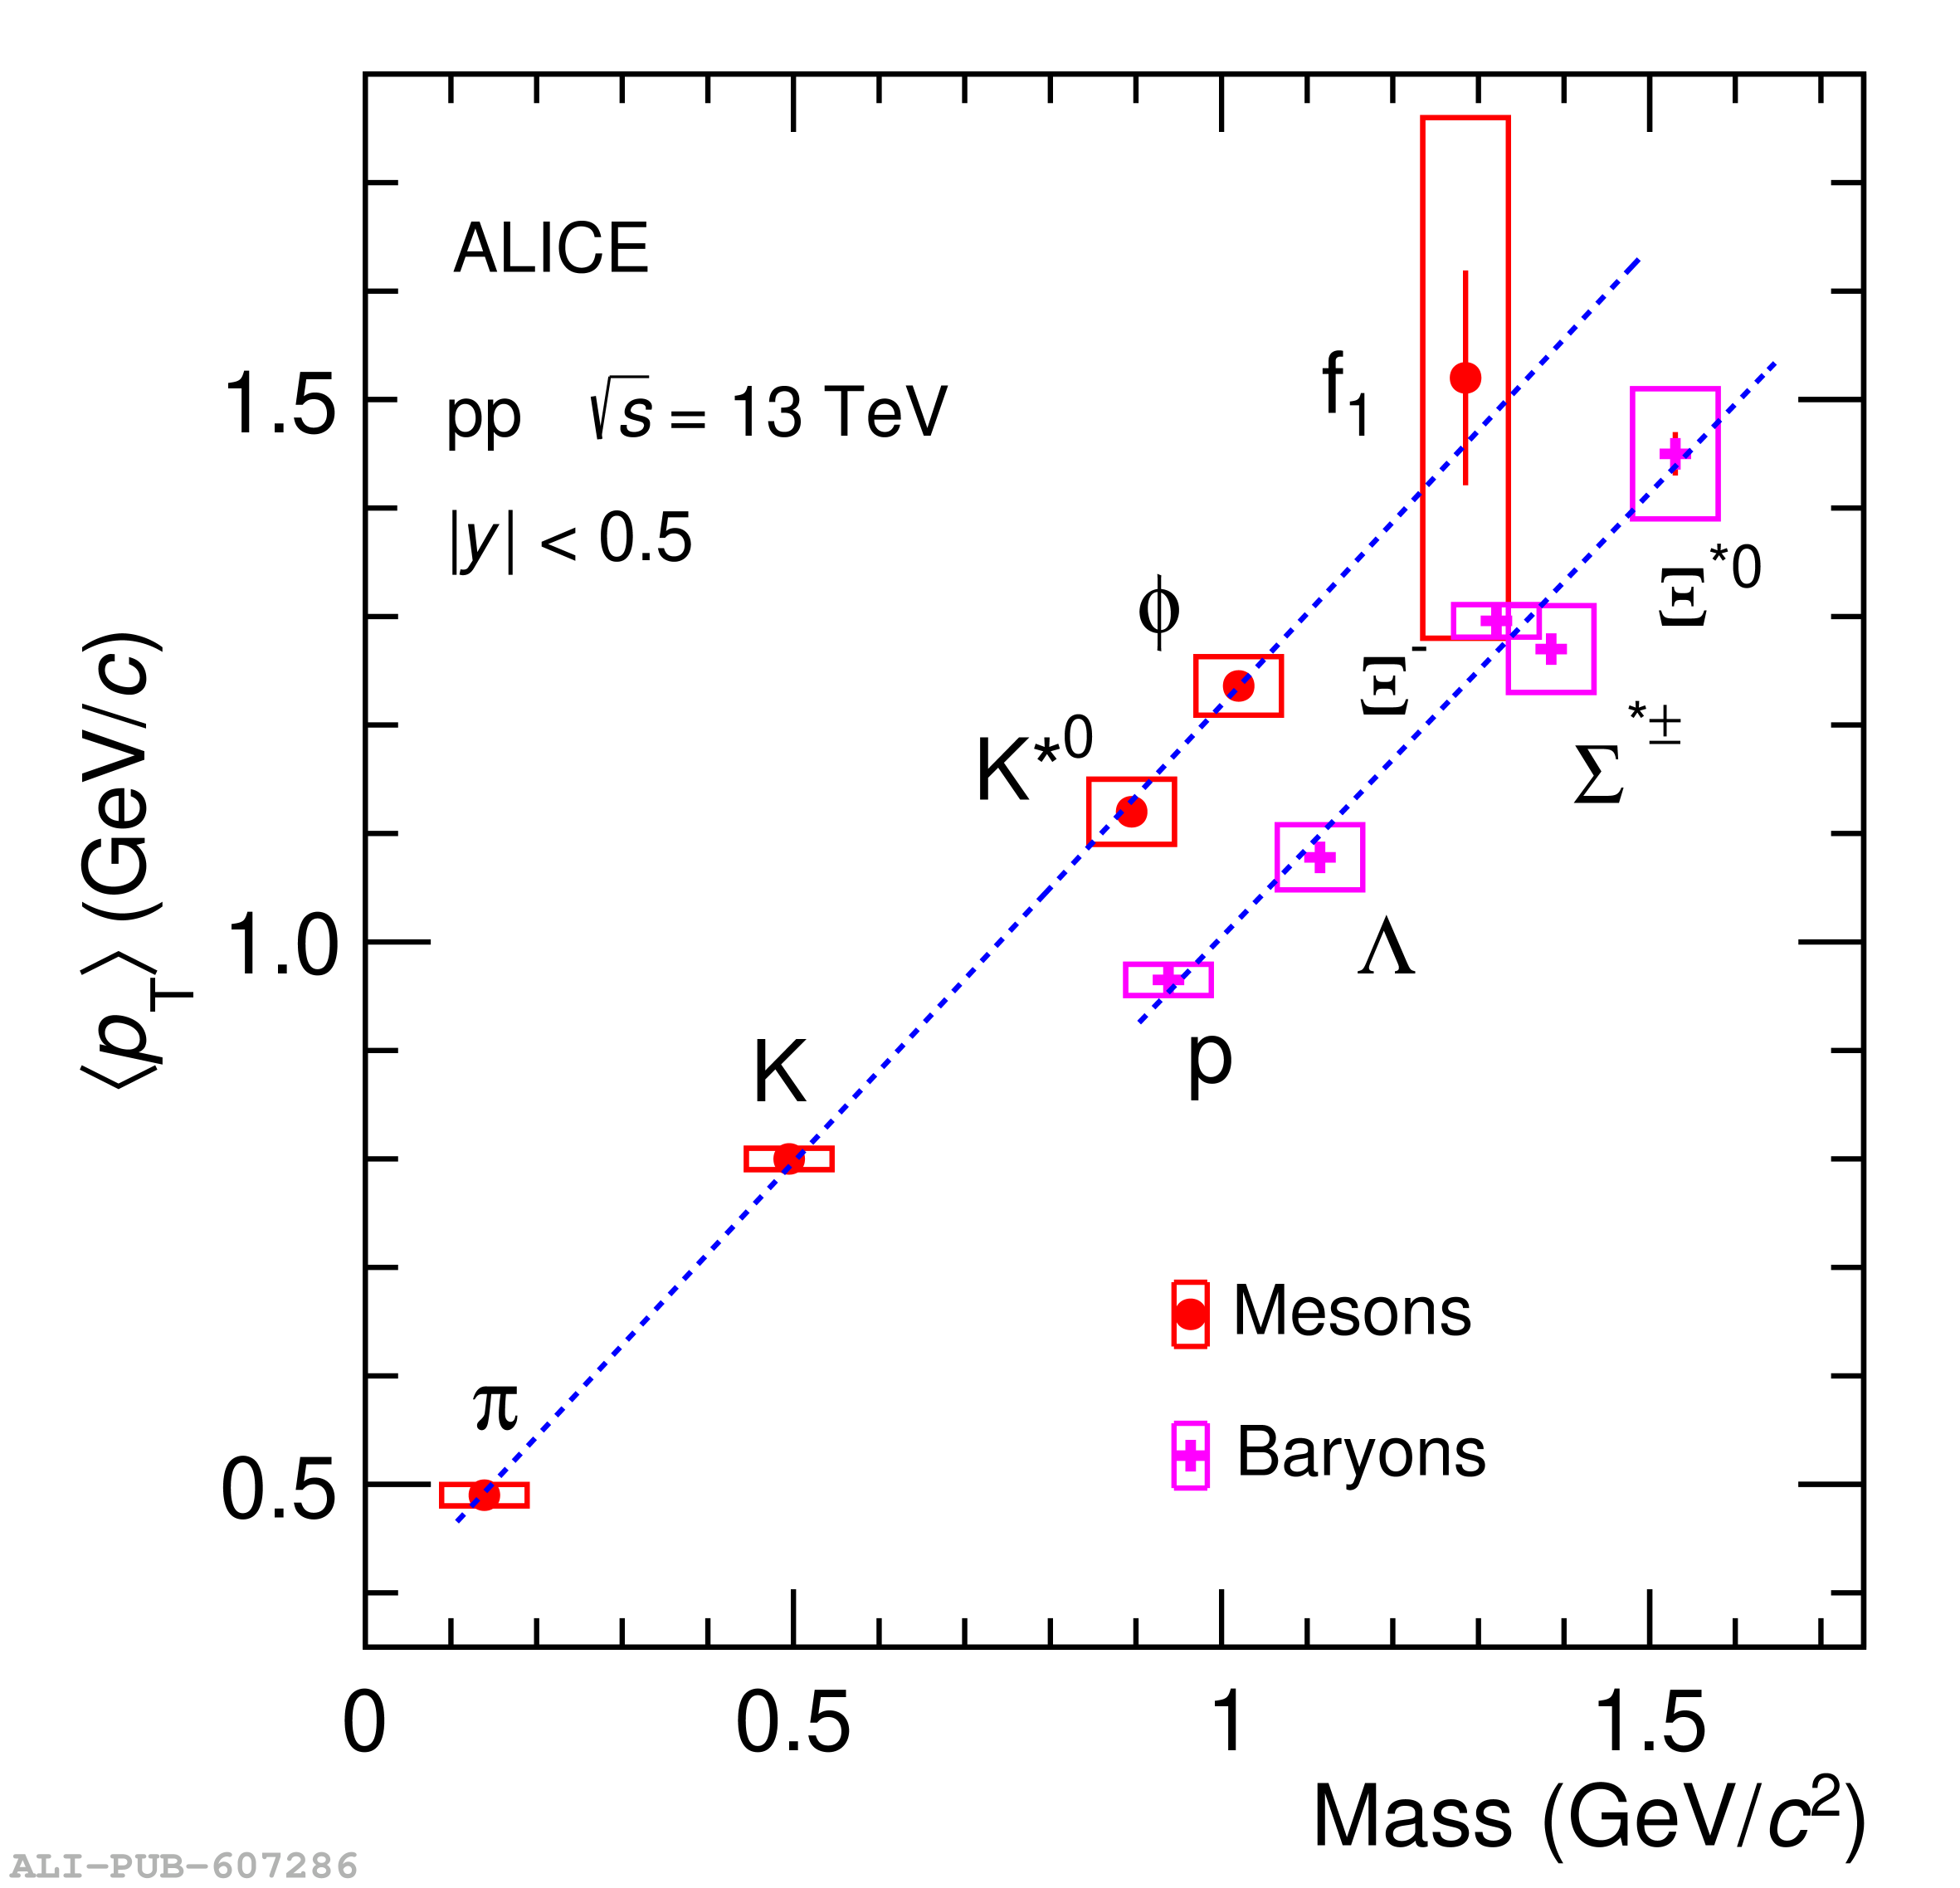 |
Figure 6
The transverse-momentum-integrated yield ratio of $\phi$/$\pi$ (left) [82] and ${\rm f}_1$/$\pi$ (right) measured in inelastic pp collisions at $\sqrt{s} = 13$ TeV. The statistical and systematic uncertainties on the data points are shown as bars and boxes, respectively. The black solid and dotted lines represent the calculations from the $\gamma_{\rm S}$CSM with different strangeness content of $\phi$ and ${\rm f}_1(1285)$ mesons. |  |