Multiplicity-dependent jet modification from di-hadron correlations in pp collisions at $\sqrt{s} = 13$ TeV

Short-range correlations between charged particles are studied via two-particle angular correlations in pp collisions at $\sqrt{s}=13$ TeV. The correlation functions are measured as a function of the relative azimuthal angle $\Delta\varphi$ and the pseudorapidity separation $\Delta\eta$ for pairs of primary charged particles within the pseudorapidity interval $|\eta| <~ 0.9$ and the transverse-momentum range $1 <~ p_{\rm T} <~ 8$ GeV/$c$. Near-side ($|\Delta\varphi|<~1.3$) peak widths are extracted from a generalised Gaussian fitted over the correlations in full pseudorapidity separation ($|\Delta\eta|<~1.8$), while the per-trigger associated near-side yields are extracted for the short-range correlations ($|\Delta\eta|<~1.3$). Both are evaluated as a function of charged-particle multiplicity obtained by two different event activity estimators. The width of the near-side peak decreases with increasing multiplicity, and this trend is reproduced qualitatively by the Monte Carlo event generators PYTHIA 8, AMPT, and EPOS. However, the models overestimate the width in the low transverse-momentum region ($p_{\rm T} <~ 3$ GeV/$c$). The per-trigger associated near-side yield increases with increasing multiplicity. Although this trend is also captured qualitatively by the considered event generators, the yield is mostly overestimated by the models in the considered kinematic range. The measurement of the shape and yield of the short-range correlation peak can help us understand the interplay between jet fragmentation and event activity, quantify the narrowing trend of the near-side peak as a function of transverse momentum and multiplicity selections in pp collisions, and search for final-state jet modification in small collision systems. \


Submitted to: JHEP
e-Print: arXiv:2409.04501 | PDF | inSPIRE
CERN-EP-2024-229
Figure group

Figure 1

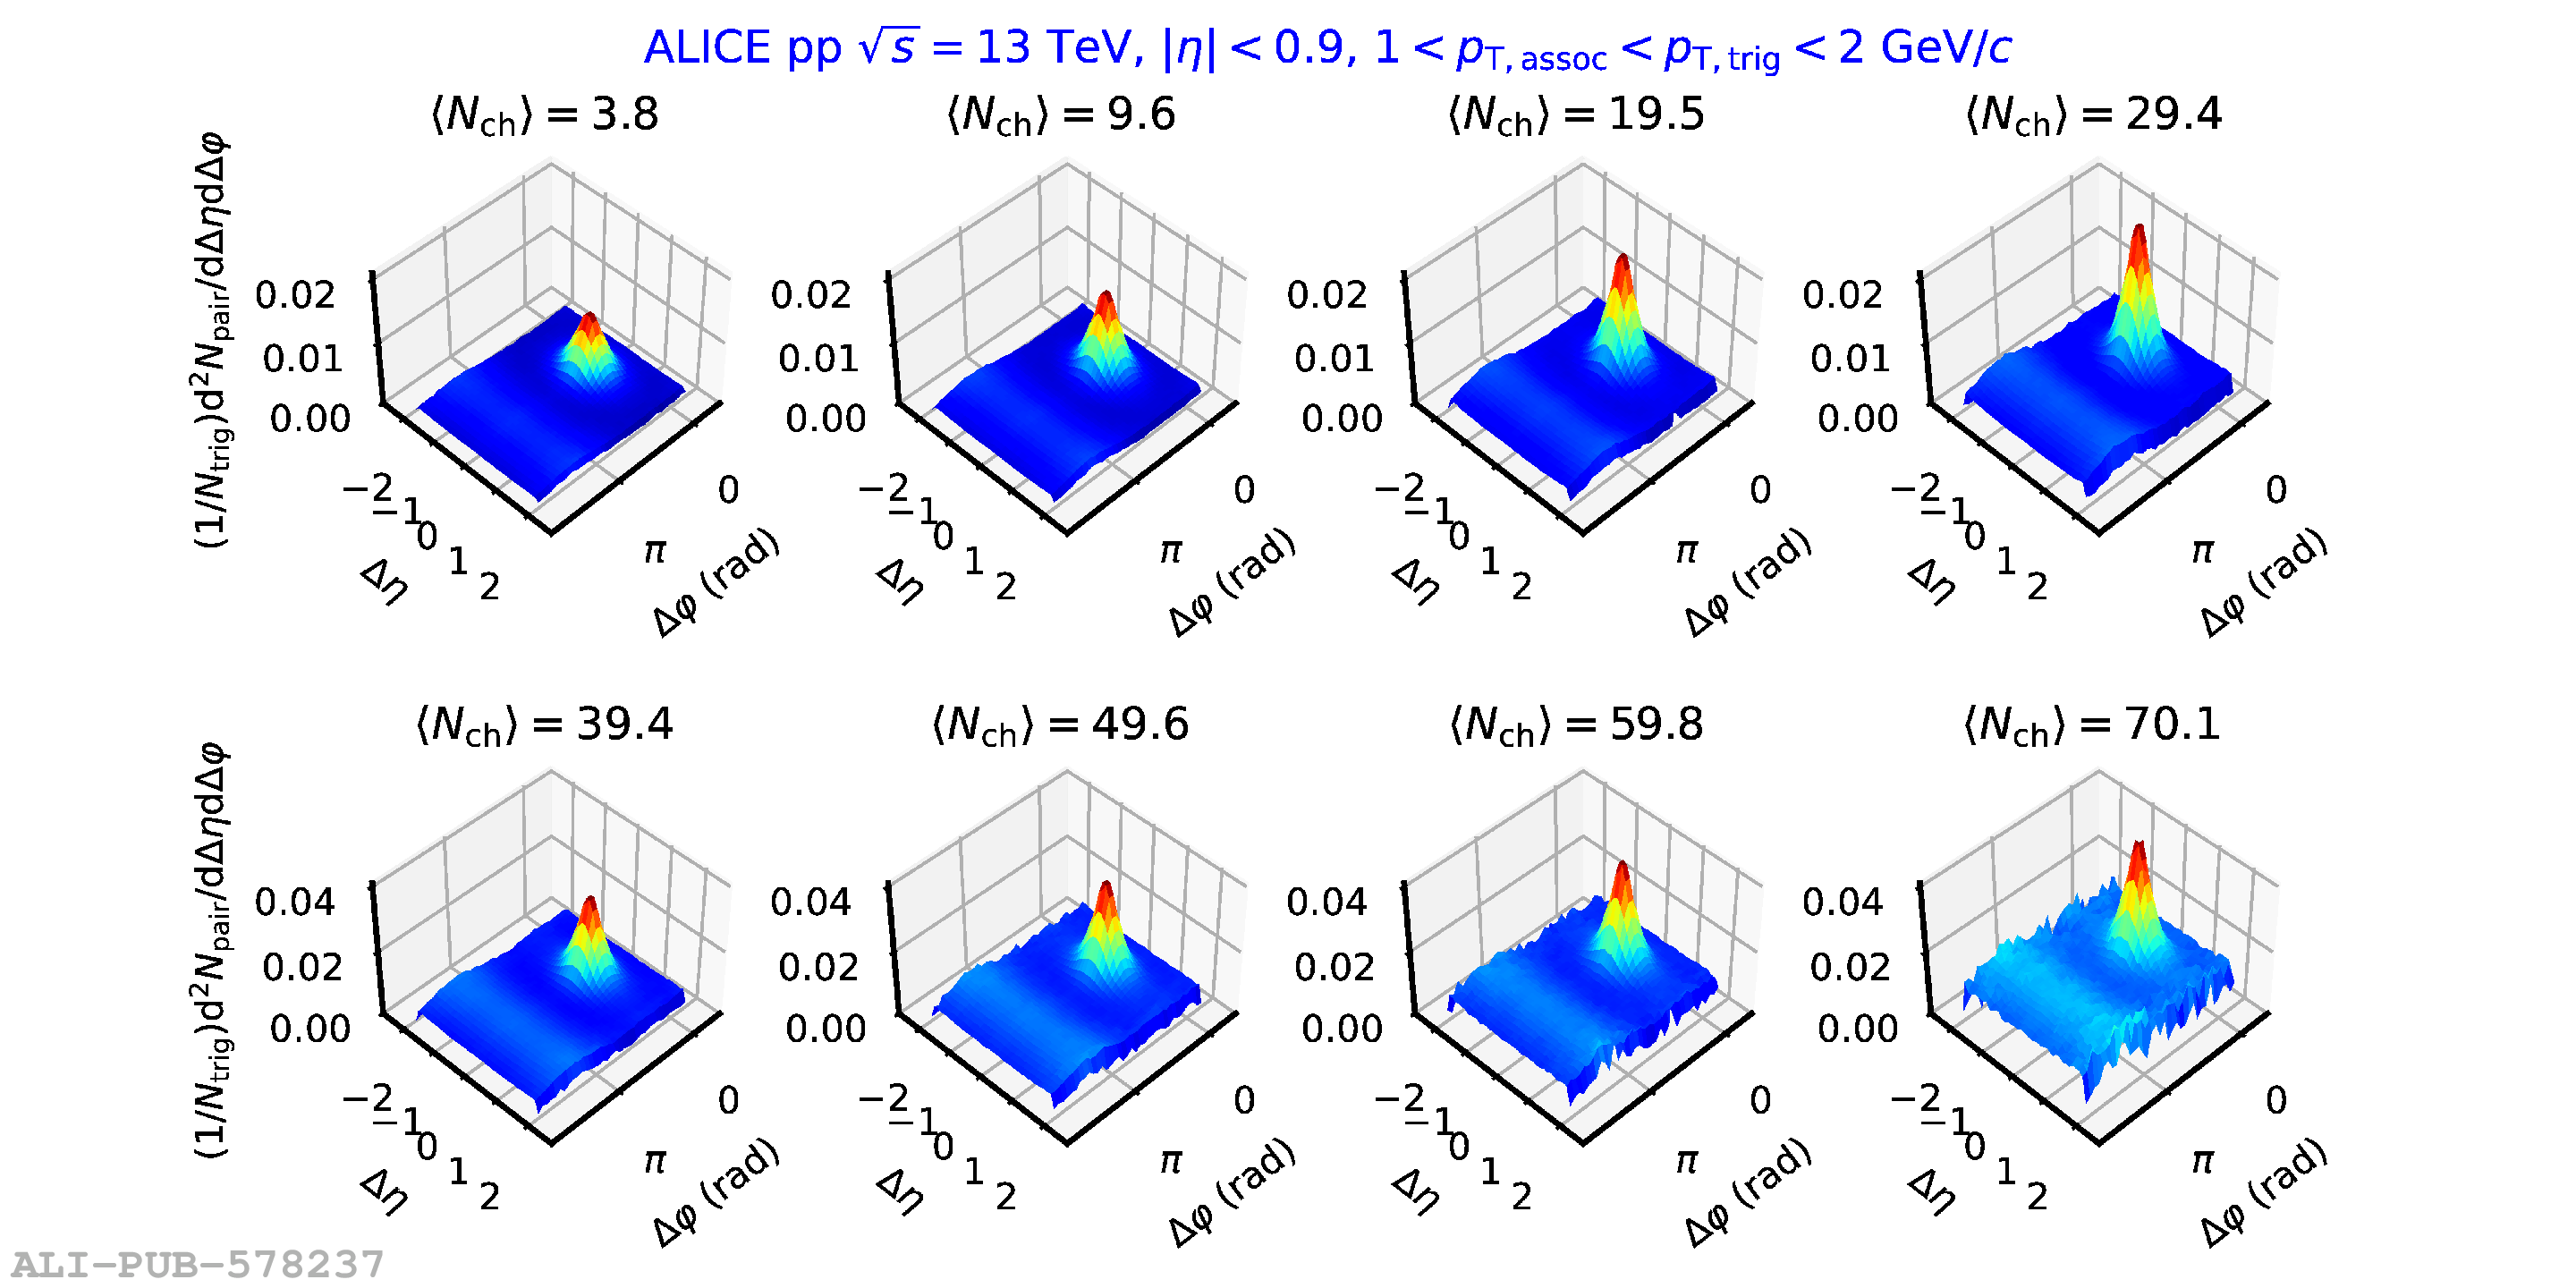
Two-particle angular correlation functions as a function of $\Delta\eta$ and $\Delta\varphi$ in pp collisions at $\sqrt{s}=13$ TeV for various multiplicity classes selected with the Midrapidity Multiplicity Estimator and characterised by the mean number of reconstructed tracks, $\langle N_{\mathrm{ch}}\rangle$ ($|\eta| 1.0, \, \pt > 0.2  \mathrm{GeV/}c$). All correlation functions are shown for 1 $\it{p}_{\rm{T, assoc}}\it{p}_{\rm{T, trig}}$ 2 GeV/$c$.

Figure 2

Near-side one-dimensional $\Delta\eta$ correlation function in pp collisions at $\sqrt{s}=$ 13 TeV obtained using Eq. \eqref{eq:etaproj}. The correlation is fitted with a generalised Gaussian distribution parameterised by Eq. \eqref{eq:gaus}. The projected correlation function is presented after the baseline subtraction (see text for details). The statistical uncertainties are smaller than the marker size, and the systematic uncertainties are not shown.

Figure 3

Near-side peak widths as a function of $\langle N_{\rm ch}\rangle$ for all \pTt and \pTa intervals. Results with event activity measured at midrapidity (forward rapidity) are shown on the left (right). The statistical and systematic uncertainties are displayed with error bars and boxes, respectively.

Figure 4

Per trigger normalised yield of associated particles in the near-side as a function of $\langle N_{\rm ch}\rangle$ for all $\pTt$ and $\pTa$ intervals. Results with event activity measured at midrapidity (forward rapidity) are shown on the left (right). The statistical and systematic uncertainties are displayed with error bars and boxes, respectively.

Figure 5

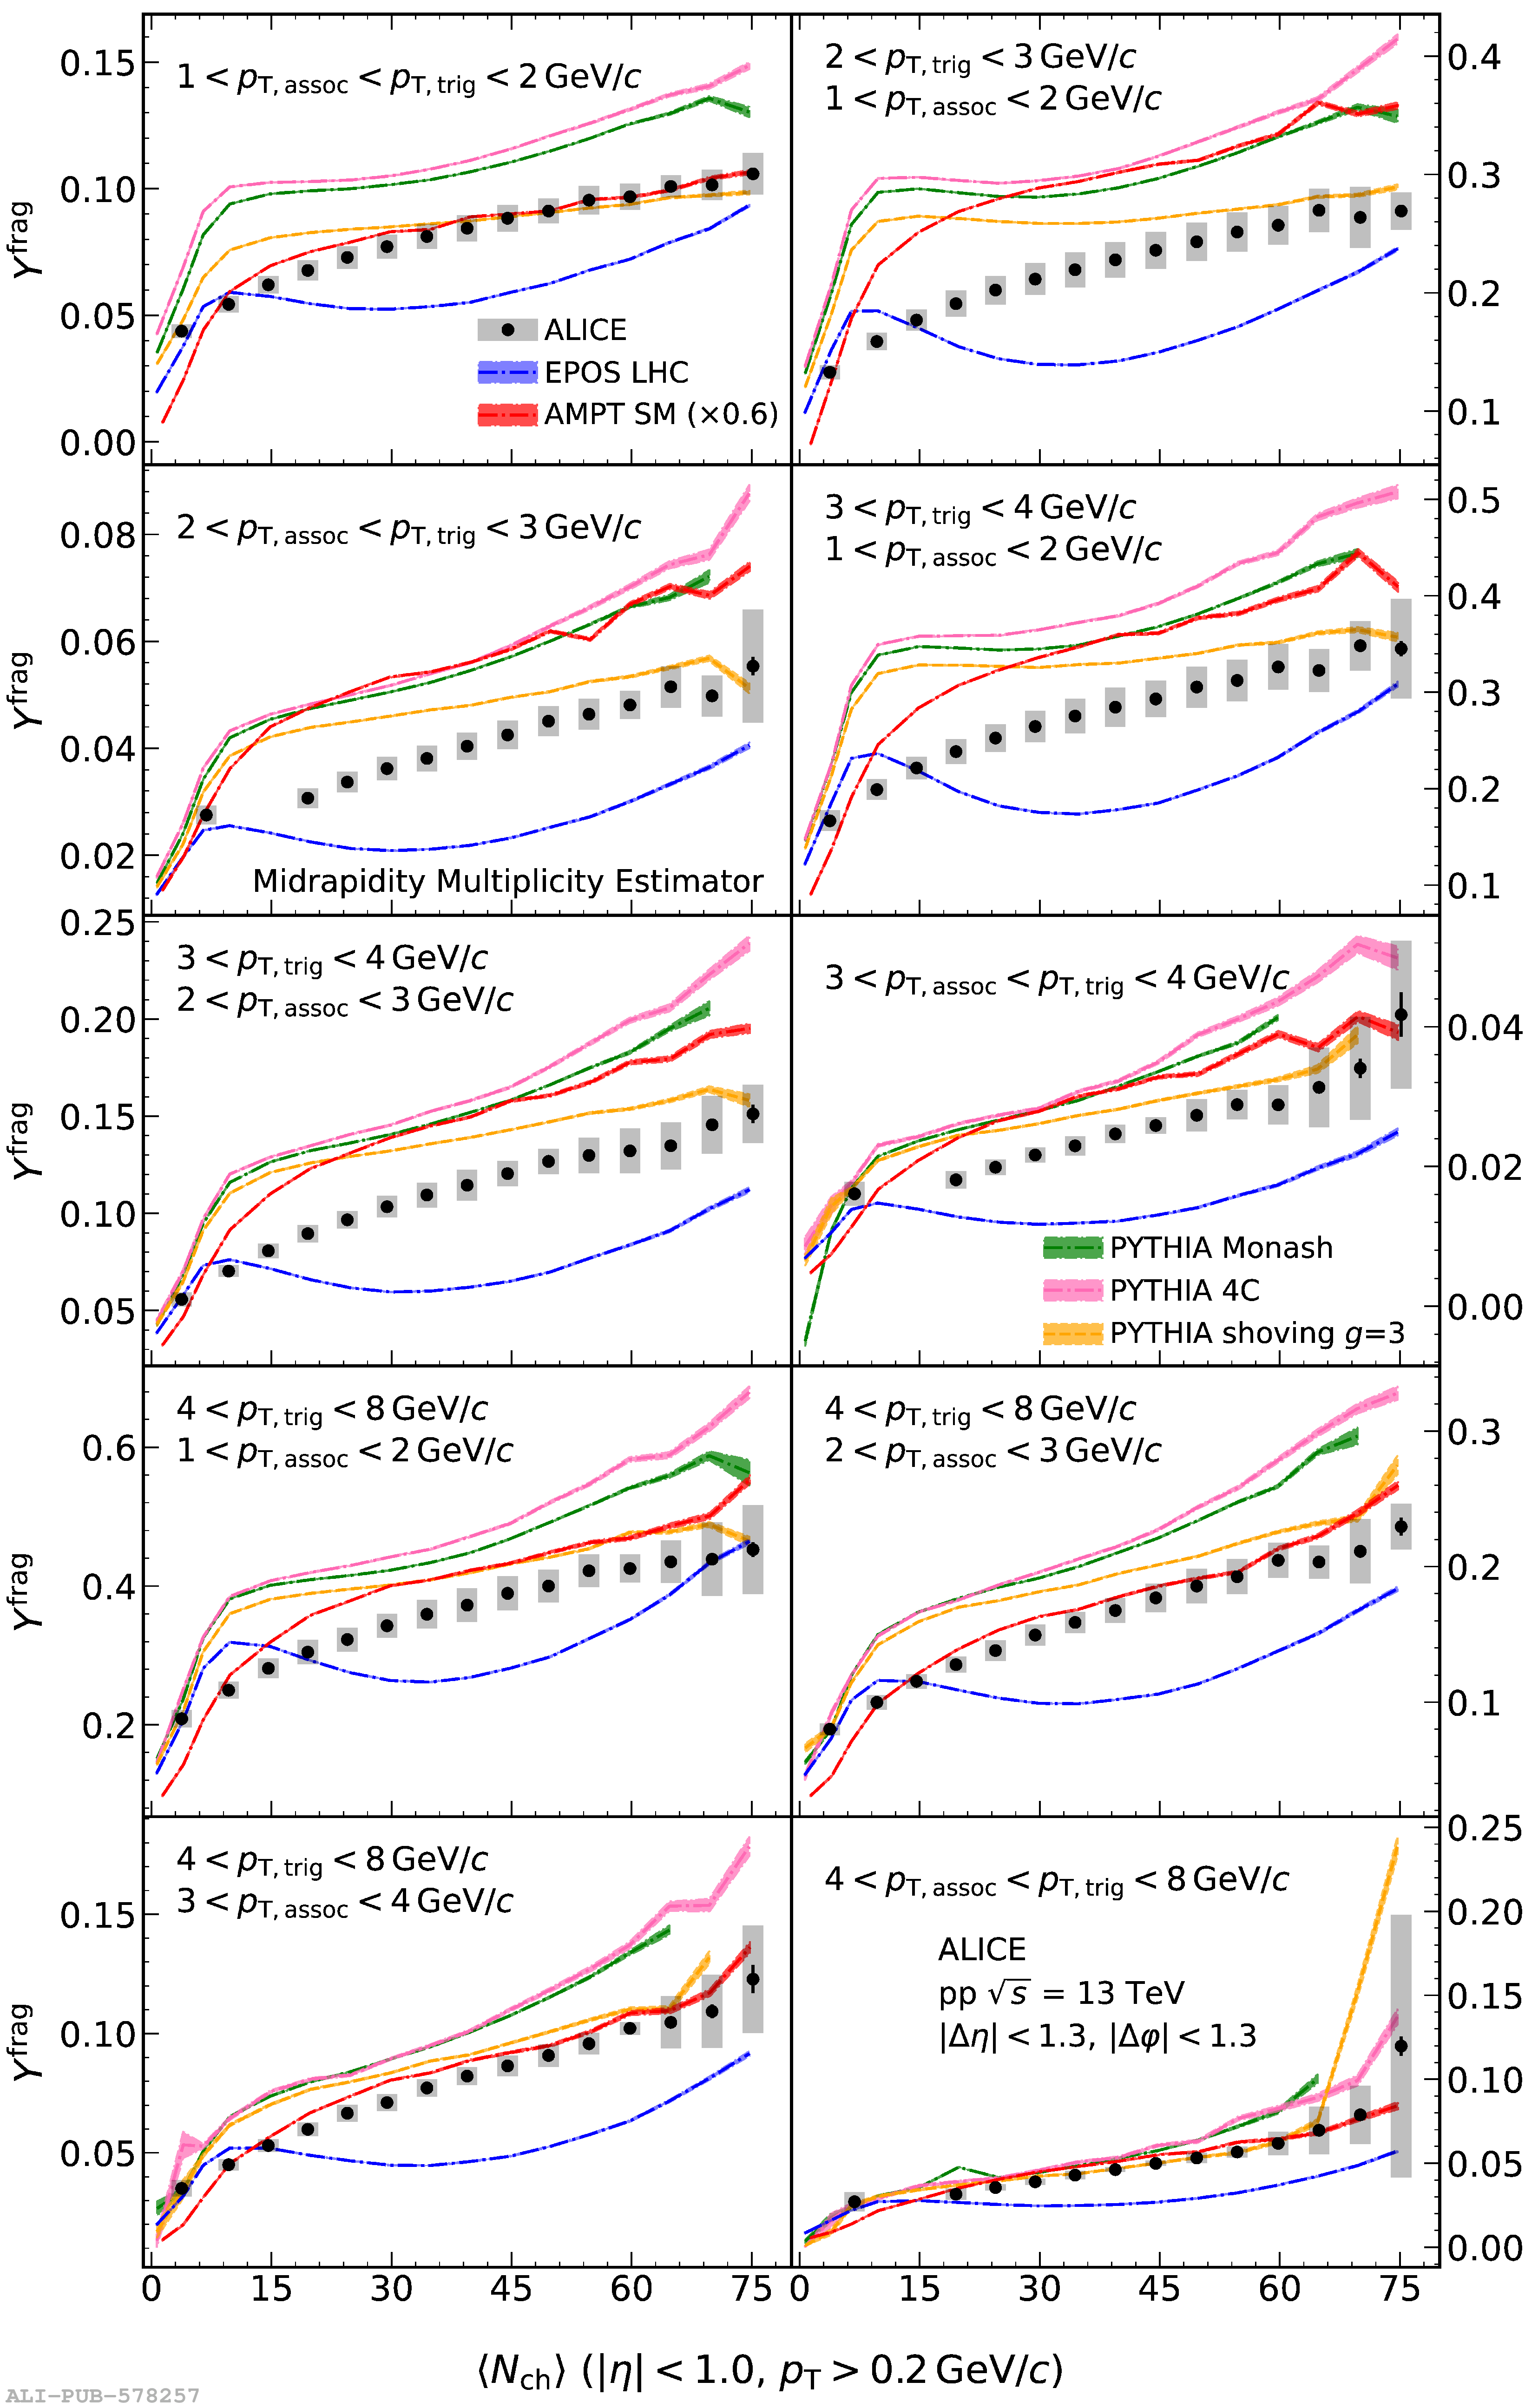
Multiplicity-dependence of near-side peak yields for all $p_\mathrm{T,\,trig}$ and $p_\mathrm{T,\,assoc}$ intervals measured in \pp{} collisions at $\sqrt{s} = 13$ TeV, compared with MC models. Multiplicities are estimated at midrapidity. The model results are shown as coloured bands with the width of the band denoting the statistical uncertainties. The error bars (boxes) represent the statistical (systematic) uncertainties in the experimental data. The AMPT calculations are scaled by a factor of 0.6 in all panels for visibility.

Figure 6

Multiplicity-dependence of near-side peak widths for all $p_\mathrm{T,\,trig}$ and $p_\mathrm{T,\,assoc}$ intervals measured in \pp{} collisions at $\sqrt{s} = 13$ TeV, compared with MC models. Multiplicities are estimated at midrapidity. The model results are shown as coloured bands with the width of the band denoting the statistical uncertainties. The error bars (boxes) represent the statistical (systematic) uncertainties in the experimental data. The AMPT calculations are scaled by a factor of 0.6 in all panels for visibility.