Exploring nuclear structure with multiparticle azimuthal correlations at the LHC

Understanding nuclear structure provides essential insights into the properties of atomic nuclei. In this paper, details of the nuclear structure of $^{\rm 129}$Xe, such as the quadrupole deformation and the nuclear diffuseness, are studied by extensive measurements of anisotropic-flow-related observables in Xe$-$Xe collisions at a center-of-mass energy per nucleon pair $\sqrt{s_{\rm NN}} = 5.44$ TeV with the ALICE detector at the LHC. The results are compared with those from Pb$-$Pb collisions at $\sqrt{s_{\rm NN}} = 5.02$ TeV for a baseline, given that the $^{\rm 208}$Pb nucleus is not deformed. Furthermore, comprehensive comparisons are performed with a state-of-the-art hybrid model using IP-Glasma+MUSIC+UrQMD. It is found that among various IP-Glasma+MUSIC+UrQMD calculations with different values of nuclear parameters, the one using a nuclear diffuseness parameter of $a_0=0.492$ and a nuclear quadrupole deformation parameter of $\beta_2=0.207$ provides a better description of the presented flow measurements. These studies represent an important step towards a thorough exploration of the imaging power of nuclear collisions at ultrarelativistic energy and the search for the imprint of nuclear structure on various flow observables in heavy-ion collisions at the LHC. The findings demonstrate the potential of nuclear structure studies at the TeV energy scale and highlight that the LHC experiments can complement existing low-energy experiments on nuclear structure studies.


Submitted to: PLB
e-Print: arXiv:2409.04343 | PDF | inSPIRE
CERN-EP-2024-228
Figure group

Figure 1

Panels (a) and (b): Charged particle $v_2\{2, \left | \Delta\eta \right | > 1.0\}$ (left) and $v_2\{4\}$ (right) as a function of centrality in Xe--Xe and Pb--Pb collisions at $\sqrt{s_{_{\mathrm{NN}}}} = 5.44$ TeV and $\sqrt{s_{_{\mathrm{NN}}}} = 5.02$ TeV, respectively. Panels (c) and (d): Ratio between Xe--Xe and Pb--Pb $v_2\{2, \left | \Delta\eta \right | > 1.0\}$ (left) and $v_2\{4\}$ (right). Statistical and systematical uncertainties are shown as vertical lines and gray boxes, respectively. The measurements are compared with IP-Glasma+MUSIC+UrQMD calculations  to constrain the $\beta_2$ and $a_0$ parameters of $^{129}$Xe nuclei.

Figure 2

Panels (a) and (b): Charged particle $\langle v_2 \rangle$ (left) and $\sigma_{v_2}$ (right) as a function of centrality in Xe--Xe and Pb--Pb collisions at $\sqrt{s_{_{\mathrm{NN}}}} = 5.44$ TeV and $\sqrt{s_{_{\mathrm{NN}}}} = 5.02$ TeV, respectively. Panels (c) and (d): Ratio between Xe--Xe and Pb--Pb $\langle v_2 \rangle$ (left) and $\sigma_{v_2}$ (right). Statistical and systematical uncertainties are shown as vertical lines and gray boxes, respectively. The measurements are compared with IP-Glasma+MUSIC+UrQMD calculations  to constrain the $\beta_2$ and $a_0$ parameters of $^{129}$Xe nuclei.

Figure 3

Panels (a) and (b): Charged particle $v_3\{2, \left | \Delta\eta \right | > 0.8\}$ (left) and $v_4\{2, \left | \Delta\eta \right | > 0.8\}$ (right) as a function of centrality in Xe--Xe and Pb--Pb collisions at $\sqrt{s_{_{\mathrm{NN}}}} = 5.44$ TeV and $\sqrt{s_{_{\mathrm{NN}}}} = 5.02$ TeV, respectively. Panels (c) and (d): Ratio between Xe--Xe and Pb--Pb $v_3\{2, \left | \Delta\eta \right | > 0.8\}$ (left) and $v_4\{2, \left | \Delta\eta \right | > 0.8\}$ (right). Statistical and systematical uncertainties are shown as vertical lines and gray boxes, respectively. The measurements are compared with IP-Glasma+MUSIC+UrQMD calculations  to constrain the $\beta_2$ and $a_0$ parameters of $^{129}$Xe nuclei.

Figure 4

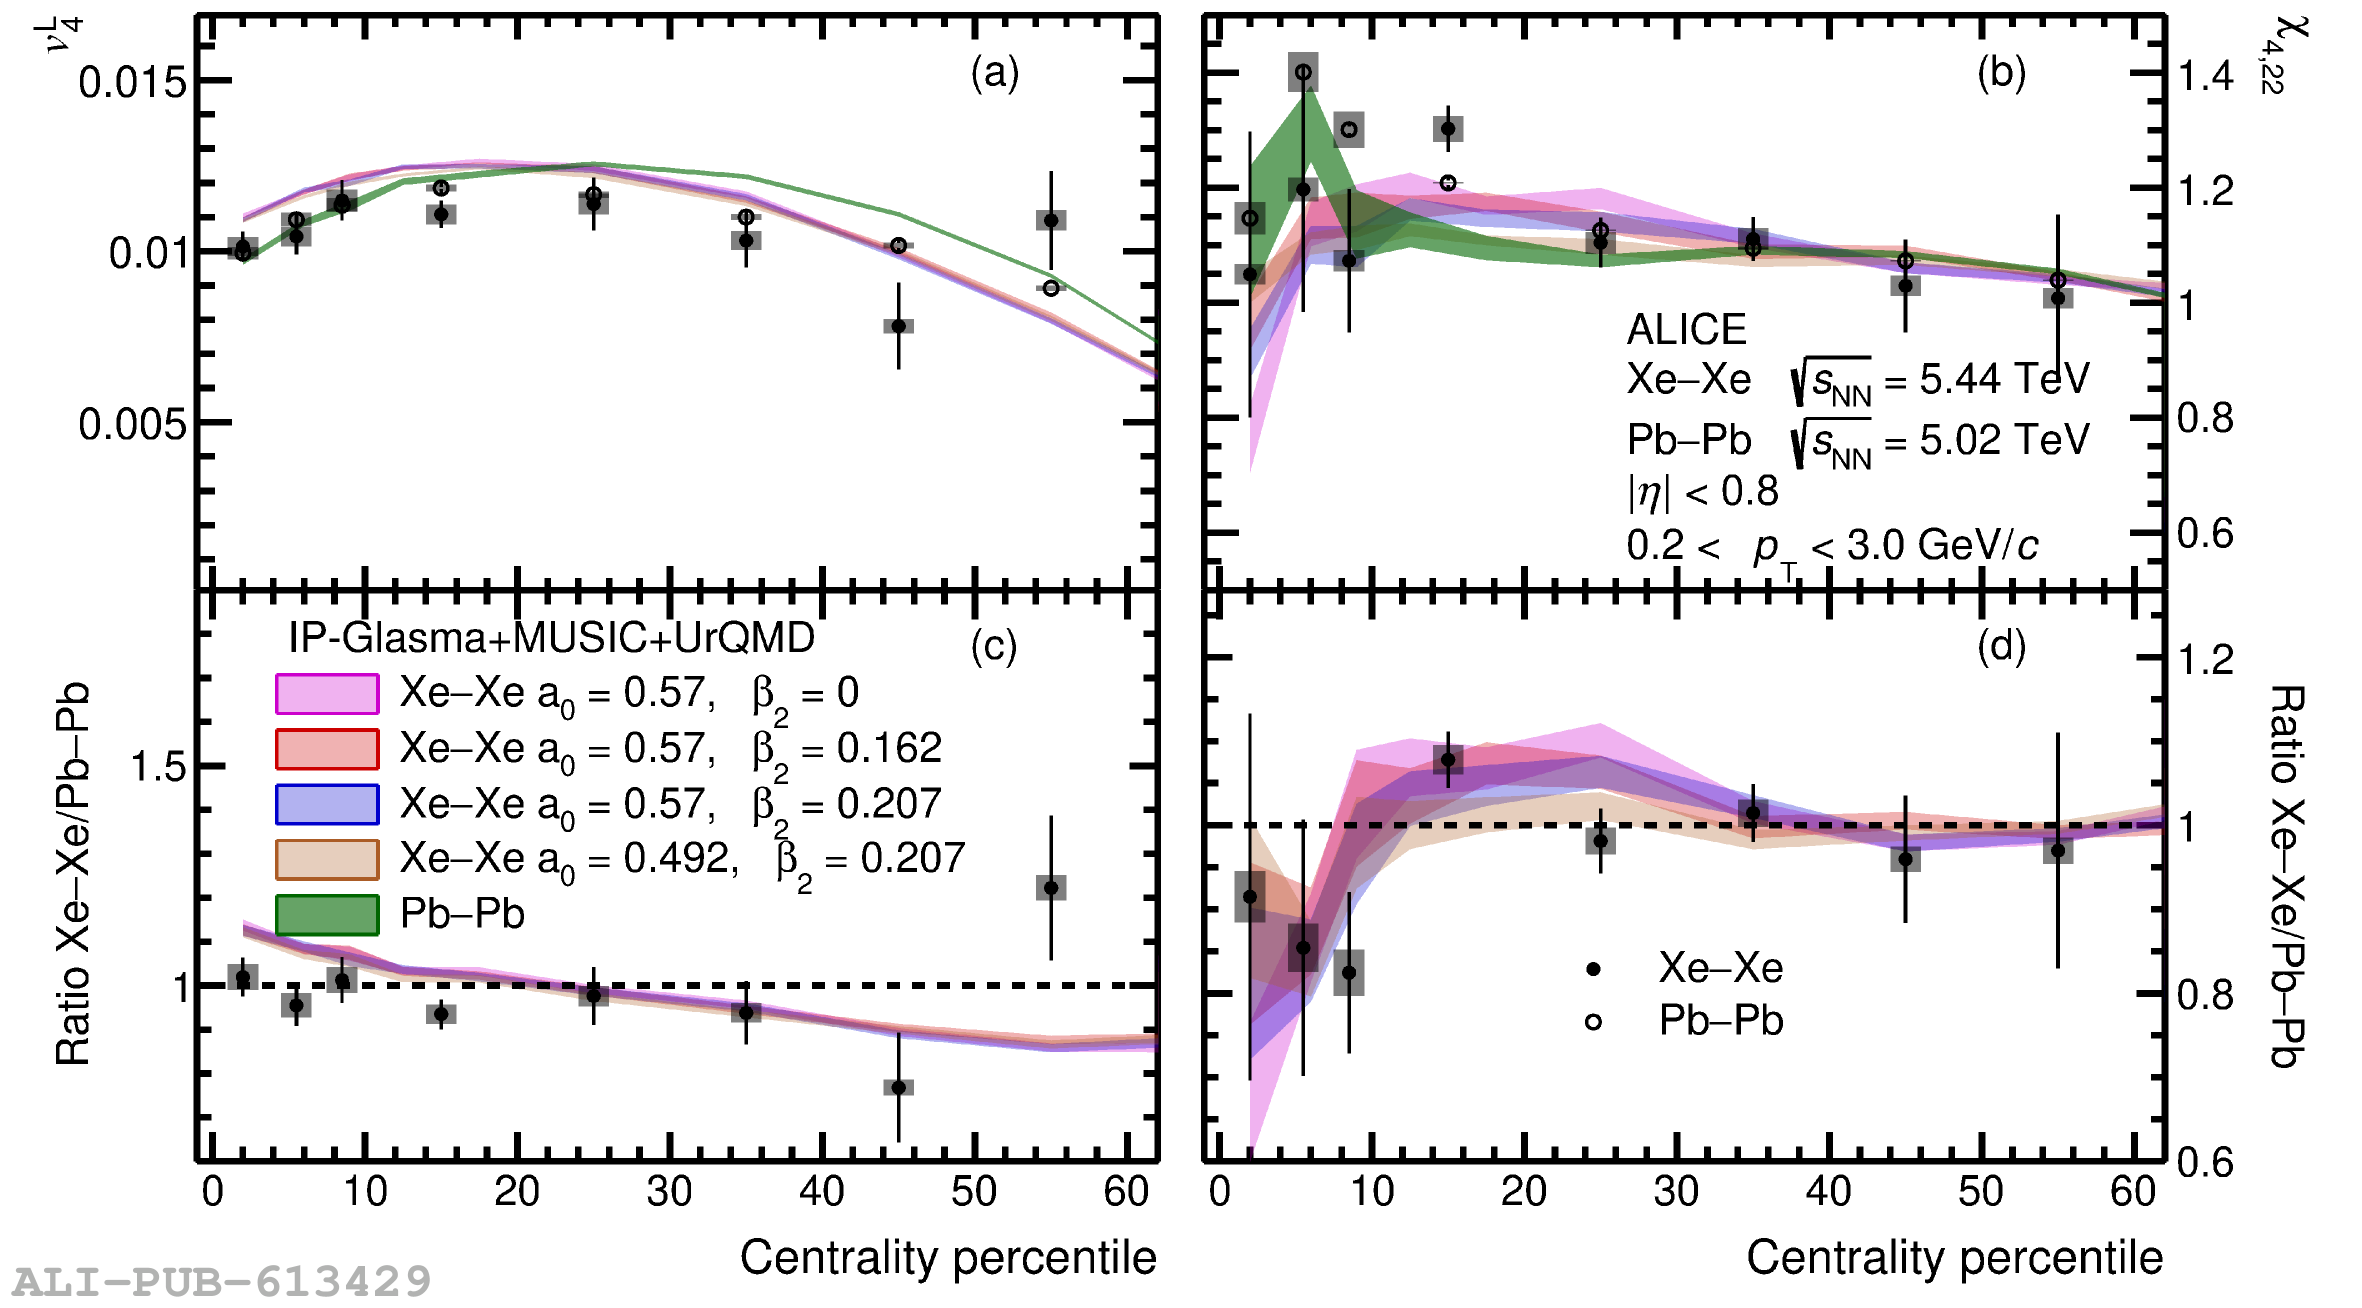
Panels (a) and (b): Charged particle $v_4^{\rm L}$ (left) and $v_{4,22}$ (right) as a function of centrality in Xe--Xe and Pb--Pb collisions at $\sqrt{s_{_{\mathrm{NN}}}} = 5.44$ TeV and $\sqrt{s_{_{\mathrm{NN}}}} = 5.02$ TeV, respectively. Panels (c) and (d): Ratio between Xe--Xe and Pb--Pb $v_4^{\rm L}$ (left) and $v_{4,22}$ (right). Statistical and systematical uncertainties are shown as vertical lines and gray boxes, respectively. The measurements are compared with IP-Glasma+MUSIC+UrQMD calculations  to constrain the $\beta_2$ and $a_0$ parameters of $^{129}$Xe nuclei.

Figure 5

Panels (a) and (b): Charged particle $\chi_{4,22}$ (left) and $\rho_{4,22}$ (right) as a function of centrality in Xe--Xe and Pb--Pb collisions at $\sqrt{s_{_{\mathrm{NN}}}} = 5.44$ TeV and $\sqrt{s_{_{\mathrm{NN}}}} = 5.02$ TeV, respectively. Panels (c) and (d): Ratio between Xe--Xe and Pb--Pb $\chi_{4,22}$ (left) and $\rho_{4,22}$ (right). Statistical and systematical uncertainties are shown as vertical lines and gray boxes, respectively. The measurements are compared with IP-Glasma+MUSIC+UrQMD calculations  to constrain the $\beta_2$ and $a_0$ parameters of $^{129}$Xe nuclei.

Figure 6

Top Panel: Charged particle NSC$(3,2)$ as a function of centrality in Xe--Xe and Pb--Pb collisions at $\sqrt{s_{_{\mathrm{NN}}}} = 5.44$ TeV and $\sqrt{s_{_{\mathrm{NN}}}} = 5.02$ TeV, respectively. Bottom Panel: Ratio between Xe--Xe and Pb--Pb NSC$(3,2)$. Statistical and systematical uncertainties are shown as vertical lines and gray boxes, respectively. The measurements are compared with IP-Glasma+MUSIC+UrQMD calculations  to constrain the $\beta_2$ and $a_0$ parameters of $^{129}$Xe nuclei.

Figure 7

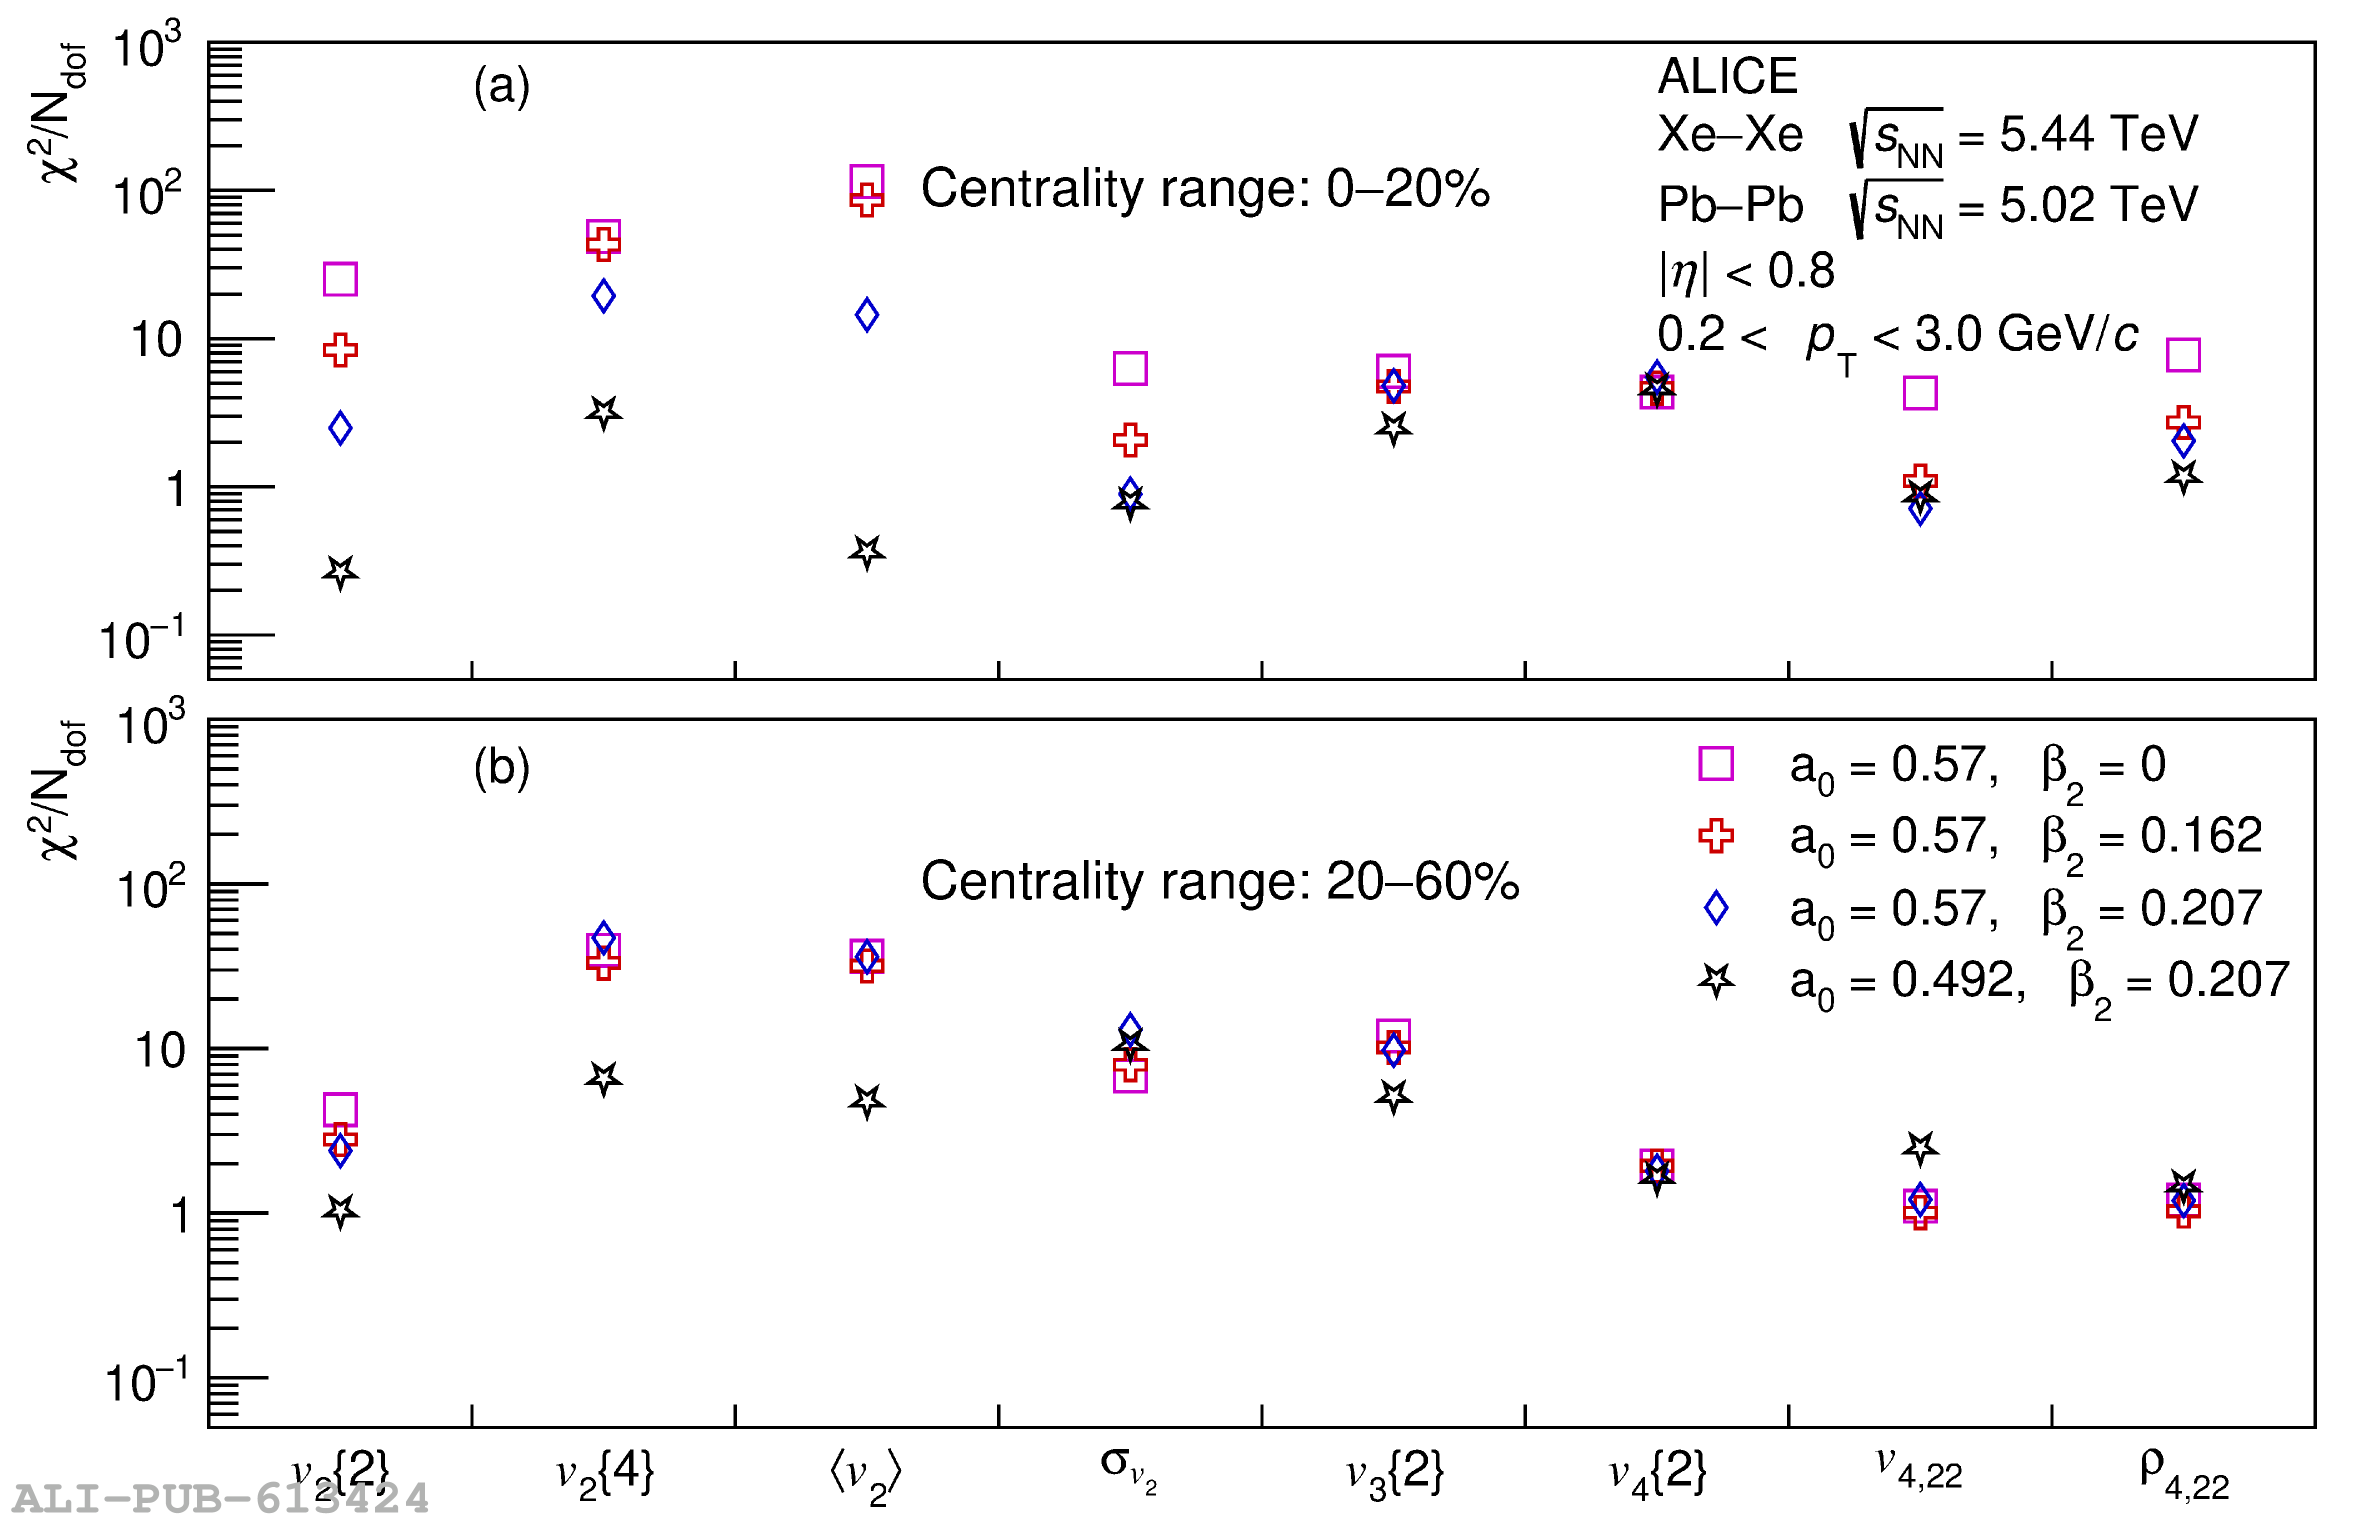
Values of $\chi^2/N_{\rm dof}$ between the measurements (Xe--Xe\Pb--Pb) and the calculations (Xe--Xe\Pb--Pb). The X-axis collects the different measured observables, and the y-axis is shown in a logarithmic scale.