Higher-order symmetry plane correlations in Pb$-$Pb collisions at $\sqrt{s_{\mathrm{NN}}}$ = 5.02 TeV

The correlations between event-by-event fluctuations of symmetry planes are measured in Pb$-$Pb collisions at a centre-of-mass energy per nucleon pair $\sqrt{s_{\mathrm{NN}}}$ = 5.02 TeV recorded by the ALICE detector at the Large Hadron Collider. This analysis is conducted using the Gaussian Estimator technique, which is insensitive to biases from correlations between different flow amplitudes. The study presents, for the first time, the centrality dependence of correlations involving up to five different symmetry planes. The correlation strength varies depending on the harmonic order of the symmetry plane and the collision centrality. Comparisons with measurements from lower energies indicate no significant differences within uncertainties. Additionally, the results are compared with hydrodynamic model calculations. Although the model predictions provide a qualitative explanation of the experimental results, they overestimate the data for some observables. This is particularly true for correlators that are sensitive to the non-linear response of the medium to initial-state anisotropies in the collision system. As these new correlators provide unique information - independent of flow amplitudes - their usage in future model developments can further constrain the properties of the strongly-interacting matter created in ultrarelativistic heavy-ion collisions.


Submitted to: PRC
e-Print: arXiv:2409.04238 | PDF | inSPIRE
CERN-EP-2024-223
Figure group

Figure 1

Magnitude of SPC between two symmetry planes. The statistical and systematic uncertainties are depicted as lines and boxes, respectively.

Figure 2

Magnitude of SPC among three symmetry planes. The statistical and systematic uncertainties are depicted as lines and boxes, respectively.

Figure 3

Magnitude of SPC among four and five symmetry planes. The statistical and systematic uncertainties are depicted as lines and boxes, respectively.

Figure 4

Correlations between different sums of SPC compared with their respective products following Eq. \eqref{eq:approx2}, in the case of five different SPC. The statistical and systematic uncertainties are depicted as lines and boxes, respectively.

Figure 5

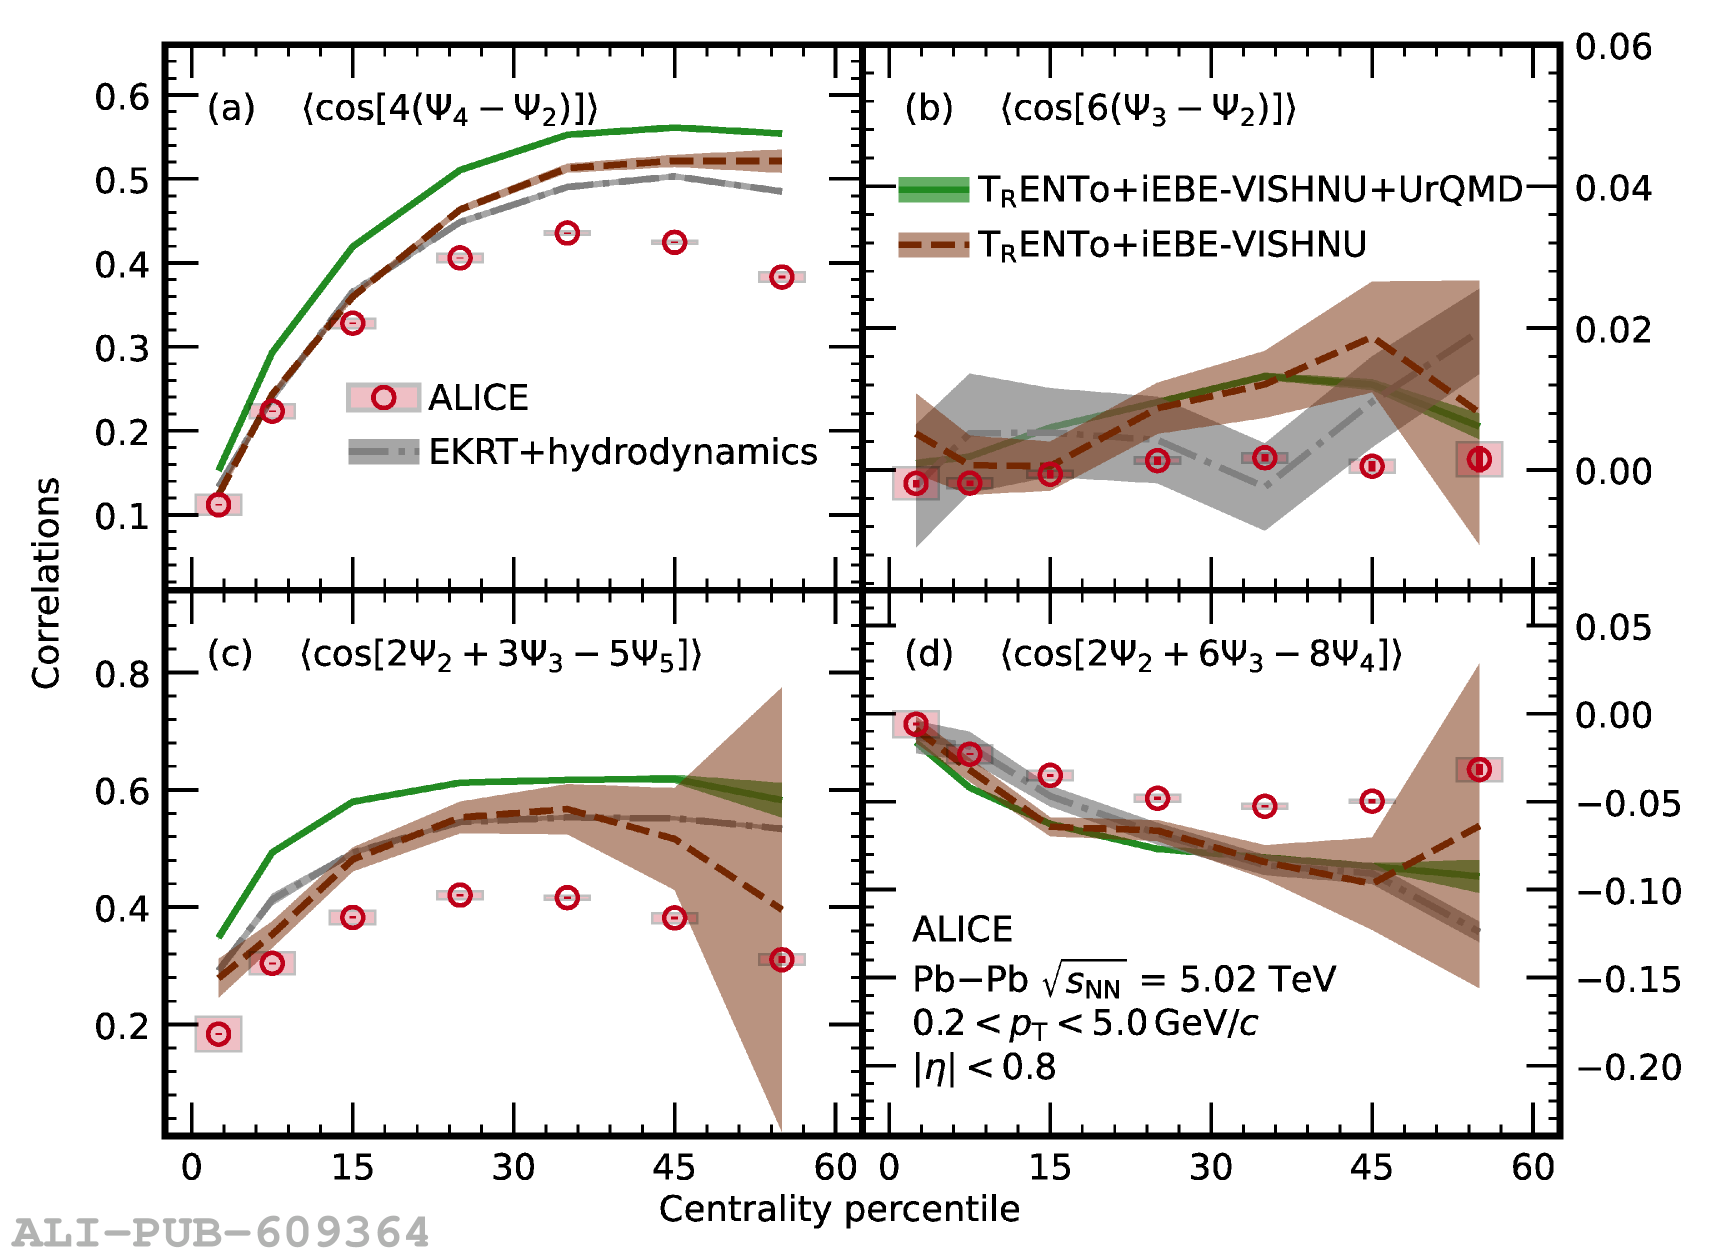
Comparison of the centrality dependence of the correlations involving $\Psi_2$, $\Psi_3$, and $\Psi_4$ (red circles) with the theoretical predictions from \trento+iEBE-VISHNU  and EKRT+hydrodynamics  shown as green and gray bands, respectively. Initial-state predictions from \trento calculated with cumulant expansions are shown as blue bands. The lines (boxes) represent the statistical (systematic) uncertainties of the experimental data. The widths of the bands denote the statistical uncertainty of the model predictions.

Figure 6

Comparison of the centrality dependence of the three-harmonic correlations involving symmetry planes up to $\Psi_5$ (red circles) with the theoretical predictions from \trento+iEBE-VISHNU  and EKRT+hydrodynamics  shown as green and gray bands, respectively. Initial-state predictions from \trento calculated with cumulant expansions are shown as blue bands. The lines (boxes) represent the statistical (systematic) uncertainties of the experimental data. The widths of the bands denote the statistical uncertainty of the model predictions.

Figure 7

Comparison of the centrality dependence of the correlations between different combinations of $\Psi_2$, $\Psi_3$, $\Psi_4$, and $\Psi_5$ (red circles) with the theoretical predictions from \trento+iEBE-VISHNU  and EKRT+hydrodynamics  shown as green and gray bands, respectively. Initial-state predictions from \trento calculated with cumulant expansions are shown as blue bands. The lines (boxes) represent the statistical (systematic) uncertainties of the experimental data. The widths of the bands denote the statistical uncertainty of the model predictions.

Figure 8

Comparison of the centrality dependence of the correlations involving symmetry planes up to $\Psi_6$ (red circles) with the theoretical predictions from \trento+iEBE-VISHNU  and EKRT+hydrodynamics  shown as green and gray bands, respectively. Initial-state predictions from \trento calculated with cumulant expansions are shown as blue bands. The lines (boxes) represent the statistical (systematic) uncertainties of the experimental data. The widths of the bands denote the statistical uncertainty of the model predictions.

Figure 9

Comparison of different two- and three-harmonic SPC measured at \twosevensixnn (red circles)  and at \fivenn (blue squares) by ALICE. The results are compared with the predictions from EKRT+hydrodynamics  at the same centre-of-mass energies (brown and green bands, respectively). The lines (boxes) represent the statistical (systematic) uncertainties in the experimental data. The widths of the bands denote the statistical uncertainty of the model predictions.

Figure A.1

Comparison of the centrality dependence of the correlations among different combinations of $\Psi_2$, $\Psi_3$, $\Psi_4$, $\Psi_5$, and $\Psi_6$ (red circles) with the theoretical predictions from EKRT+hydrodynamics  shown in gray bands. Initial-state predictions from \trento  calculated with cumulant expansions are shown as blue bands. The lines (boxes) represent the statistical (systematic) uncertainties in the experimental data. The widths of the bands denote the statistical uncertainty of the model predictions.

Figure A.2

Comparison of the centrality dependence of the correlations between different combinations of SPC involving planes up to $\Psi_7$ (red circles) with the theoretical predictions from EKRT+hydrodynamics  shown in gray bands. Initial-state predictions from \trento  calculated with cumulant expansions are shown as blue bands. The lines (boxes) represent the statistical (systematic) uncertainties in the experimental data. The widths of the bands denote the statistical uncertainty of the model predictions.

Figure A.3

Comparison of the centrality dependence of the correlations between different combinations including $\Psi_8$ (red circles) with the theoretical predictions from EKRT+hydrodynamics  shown in gray bands. Initial-state predictions from \trento  calculated with cumulant expansions are shown as blue bands. The lines (boxes) represent the statistical (systematic) uncertainties of the experimental data. The widths of the bands denote the statistical uncertainty of the model predictions.

Figure A.4

Correlations between two different symmetry planes measured at $\sqrt{s_{\rm NN}} = 2.76$ TeV (red squares) from  and $\sqrt{s_{\rm NN}} = 5.02$ TeV (blue circles). The lines (boxes) represent the statistical (systematic) uncertainties. The agreement between the two sets of data is indicated with its number of $\sigma$ at the top right of each panel.

Figure A.5

Correlations between three and four different symmetry planes measured at $\sqrt{s_{\rm NN}} = 2.76$ TeV (red squares) from  and $\sqrt{s_{\rm NN}} = 5.02$ TeV (blue circles). The lines (boxes) represent the statistical (systematic) uncertainties. The agreement between the two sets of data is indicated with its number of $\sigma$ at the top right of each panel.