Yield ratio of ${}_{\Lambda}^{3}\mathrm{H}$ to $^3\mathrm{He}$ together with theoretical predictions as a function of multiplicity. In the left panel, the results of this analysis are compared with the ALICE measurement at $\sqrt{s_{\mathrm{NN}}}$ = 2.76 TeV . Vertical lines are used for the statistical uncertainties and boxes for the systematic ones. For each centrality interval the $\langle \mathrm{d}N_\mathrm{ch}/\mathrm{d}\eta\rangle$ is taken from Ref. [68] and the ${}^{3}\mathrm{He}$ yield from Ref. [48]. The dense orange dashed line represents the expectation of SHM, while the other three sets of lines stand for coalescence model with different $B_\Lambda$ hypotheses. The coalescence prediction with world average $B_\Lambda$ is displayed with a 1$\sigma$ uncertainty as the filled area, both lines and shadowed areas are linear interpolations of the available model calculations . In the right panel, the results of recent STAR measurement are shown for comparison . | 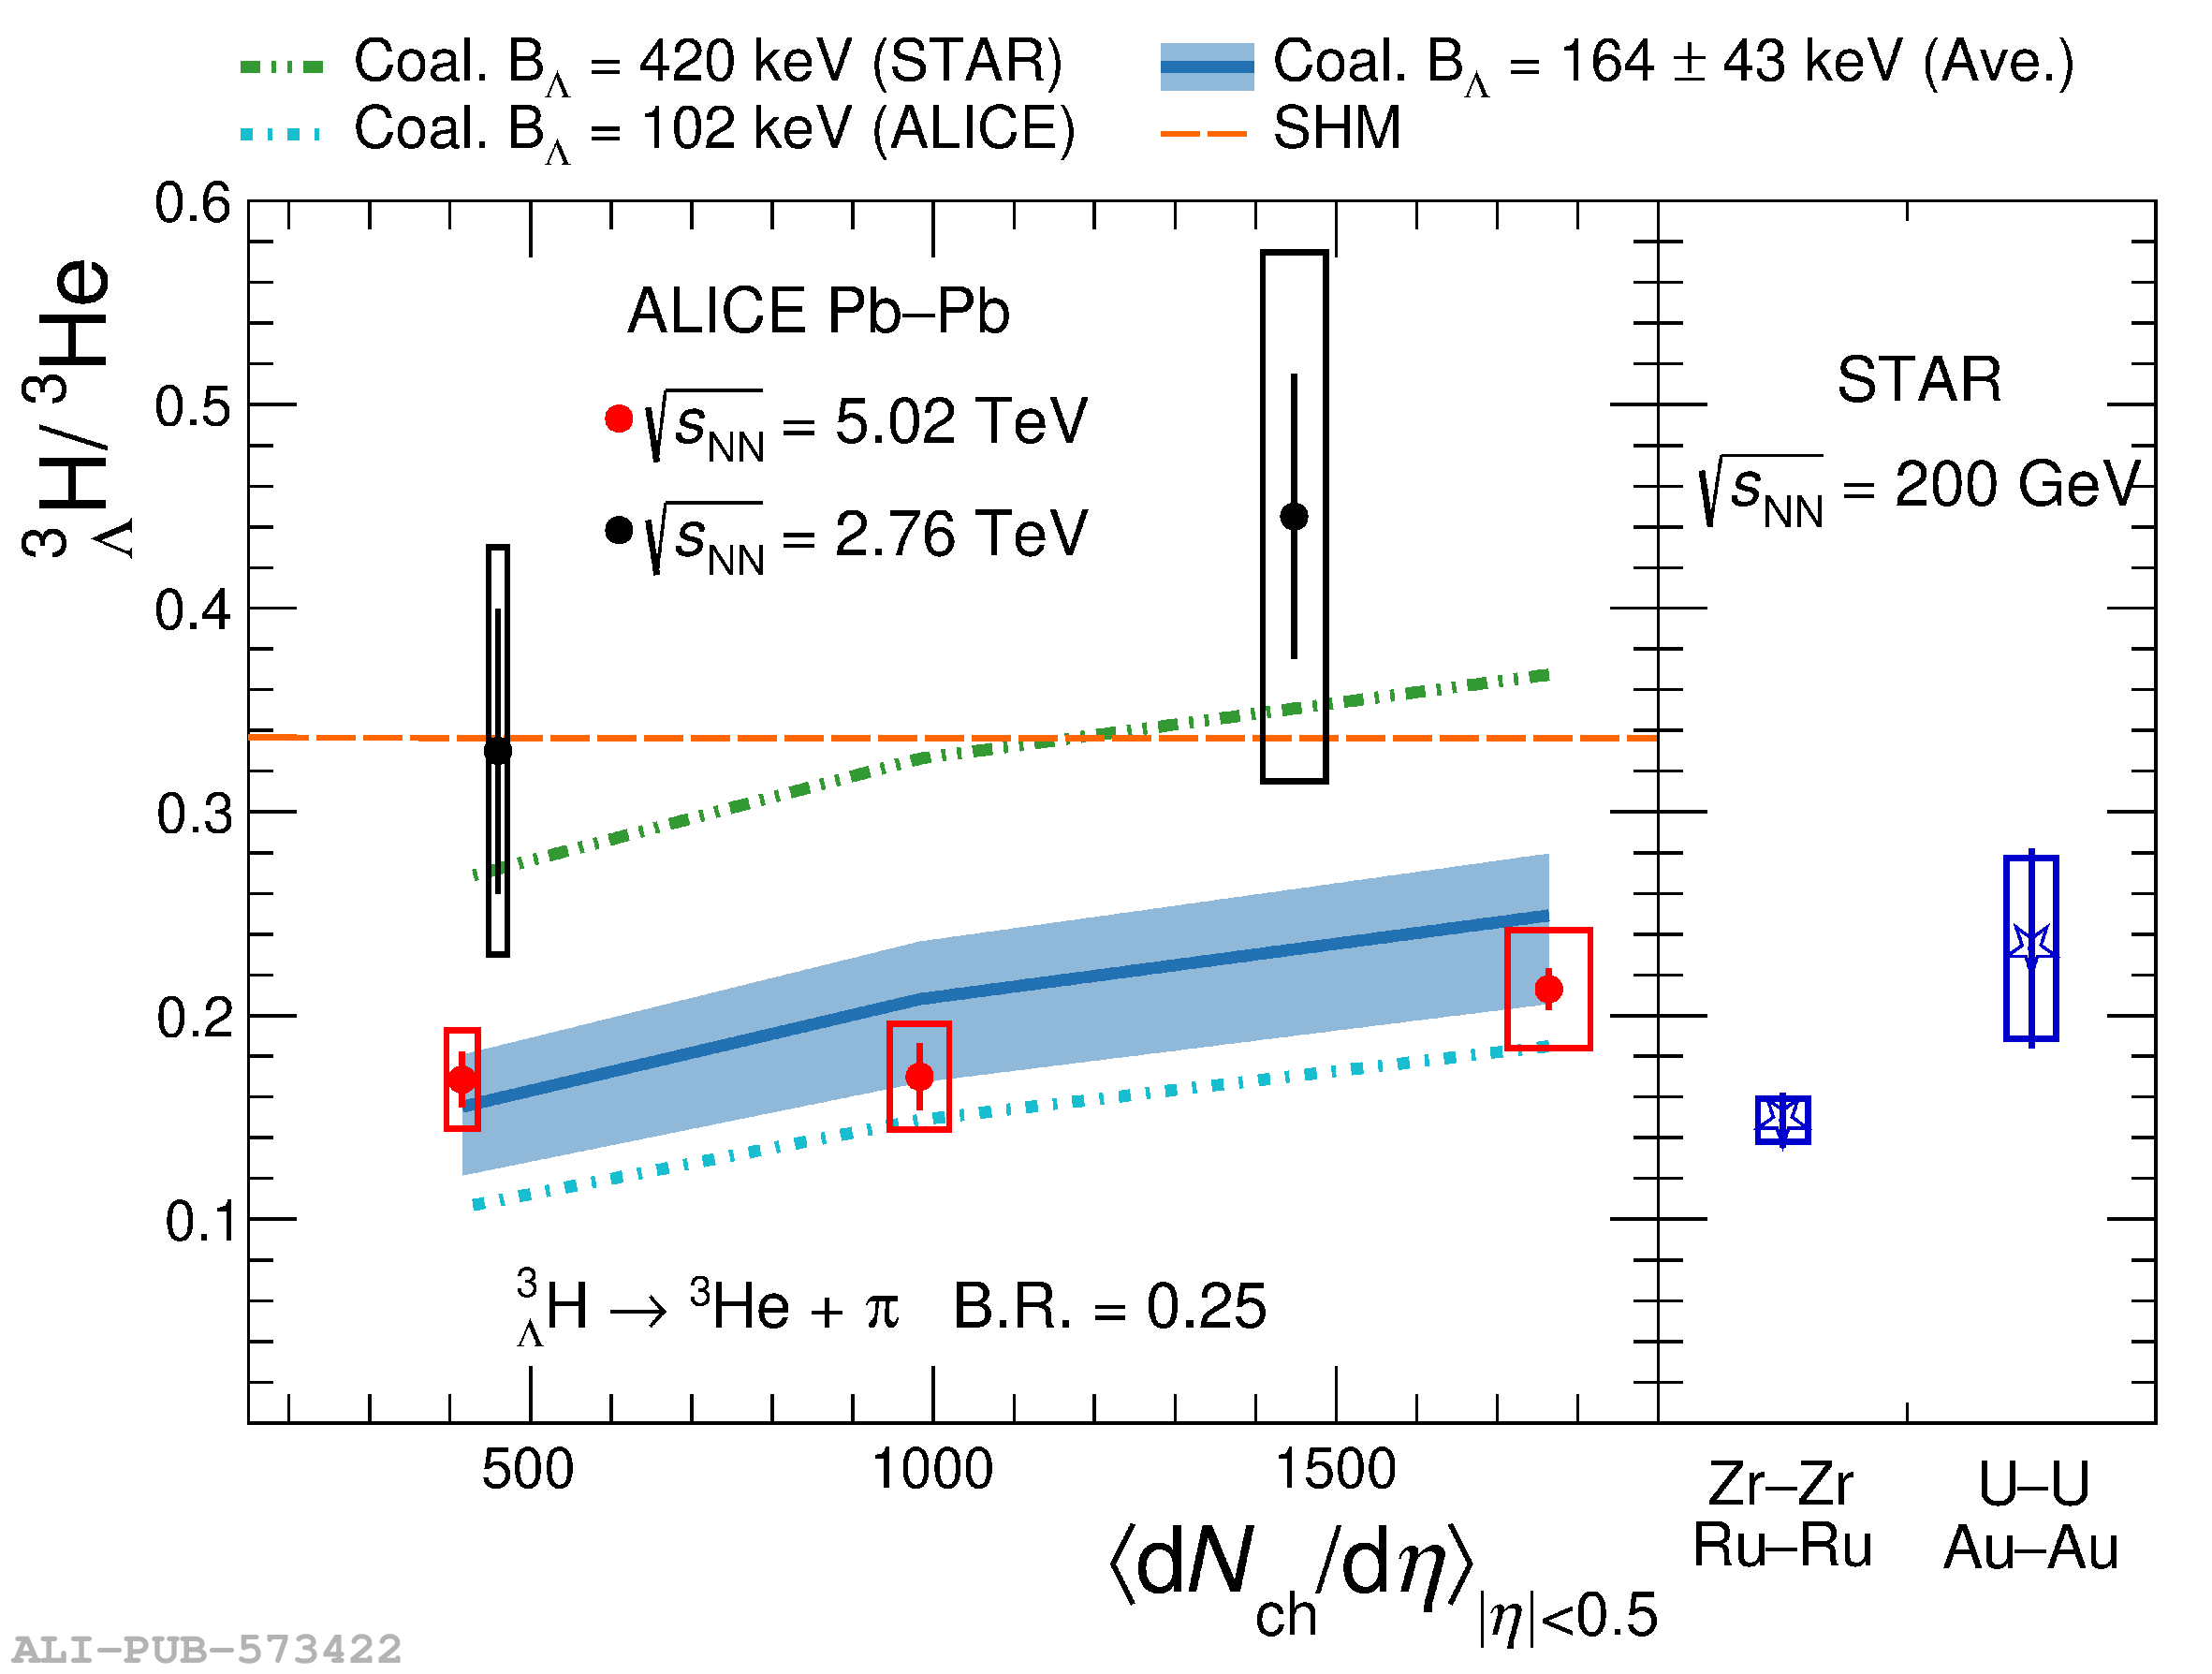 |