Transverse-momentum differential yields of the average of deuterons and antideuterons in different centrality classes (left panel), and of the average of $^3\mathrm{He}$ and $^3\overline{\mathrm{He}}$ (right panel) in the centrality class (0--90\%). Dotted lines show the Blast-Wave individual fit to the \pt spectra. Statistical and systematic uncertainties are shown as vertical bars and boxes, respectively. | 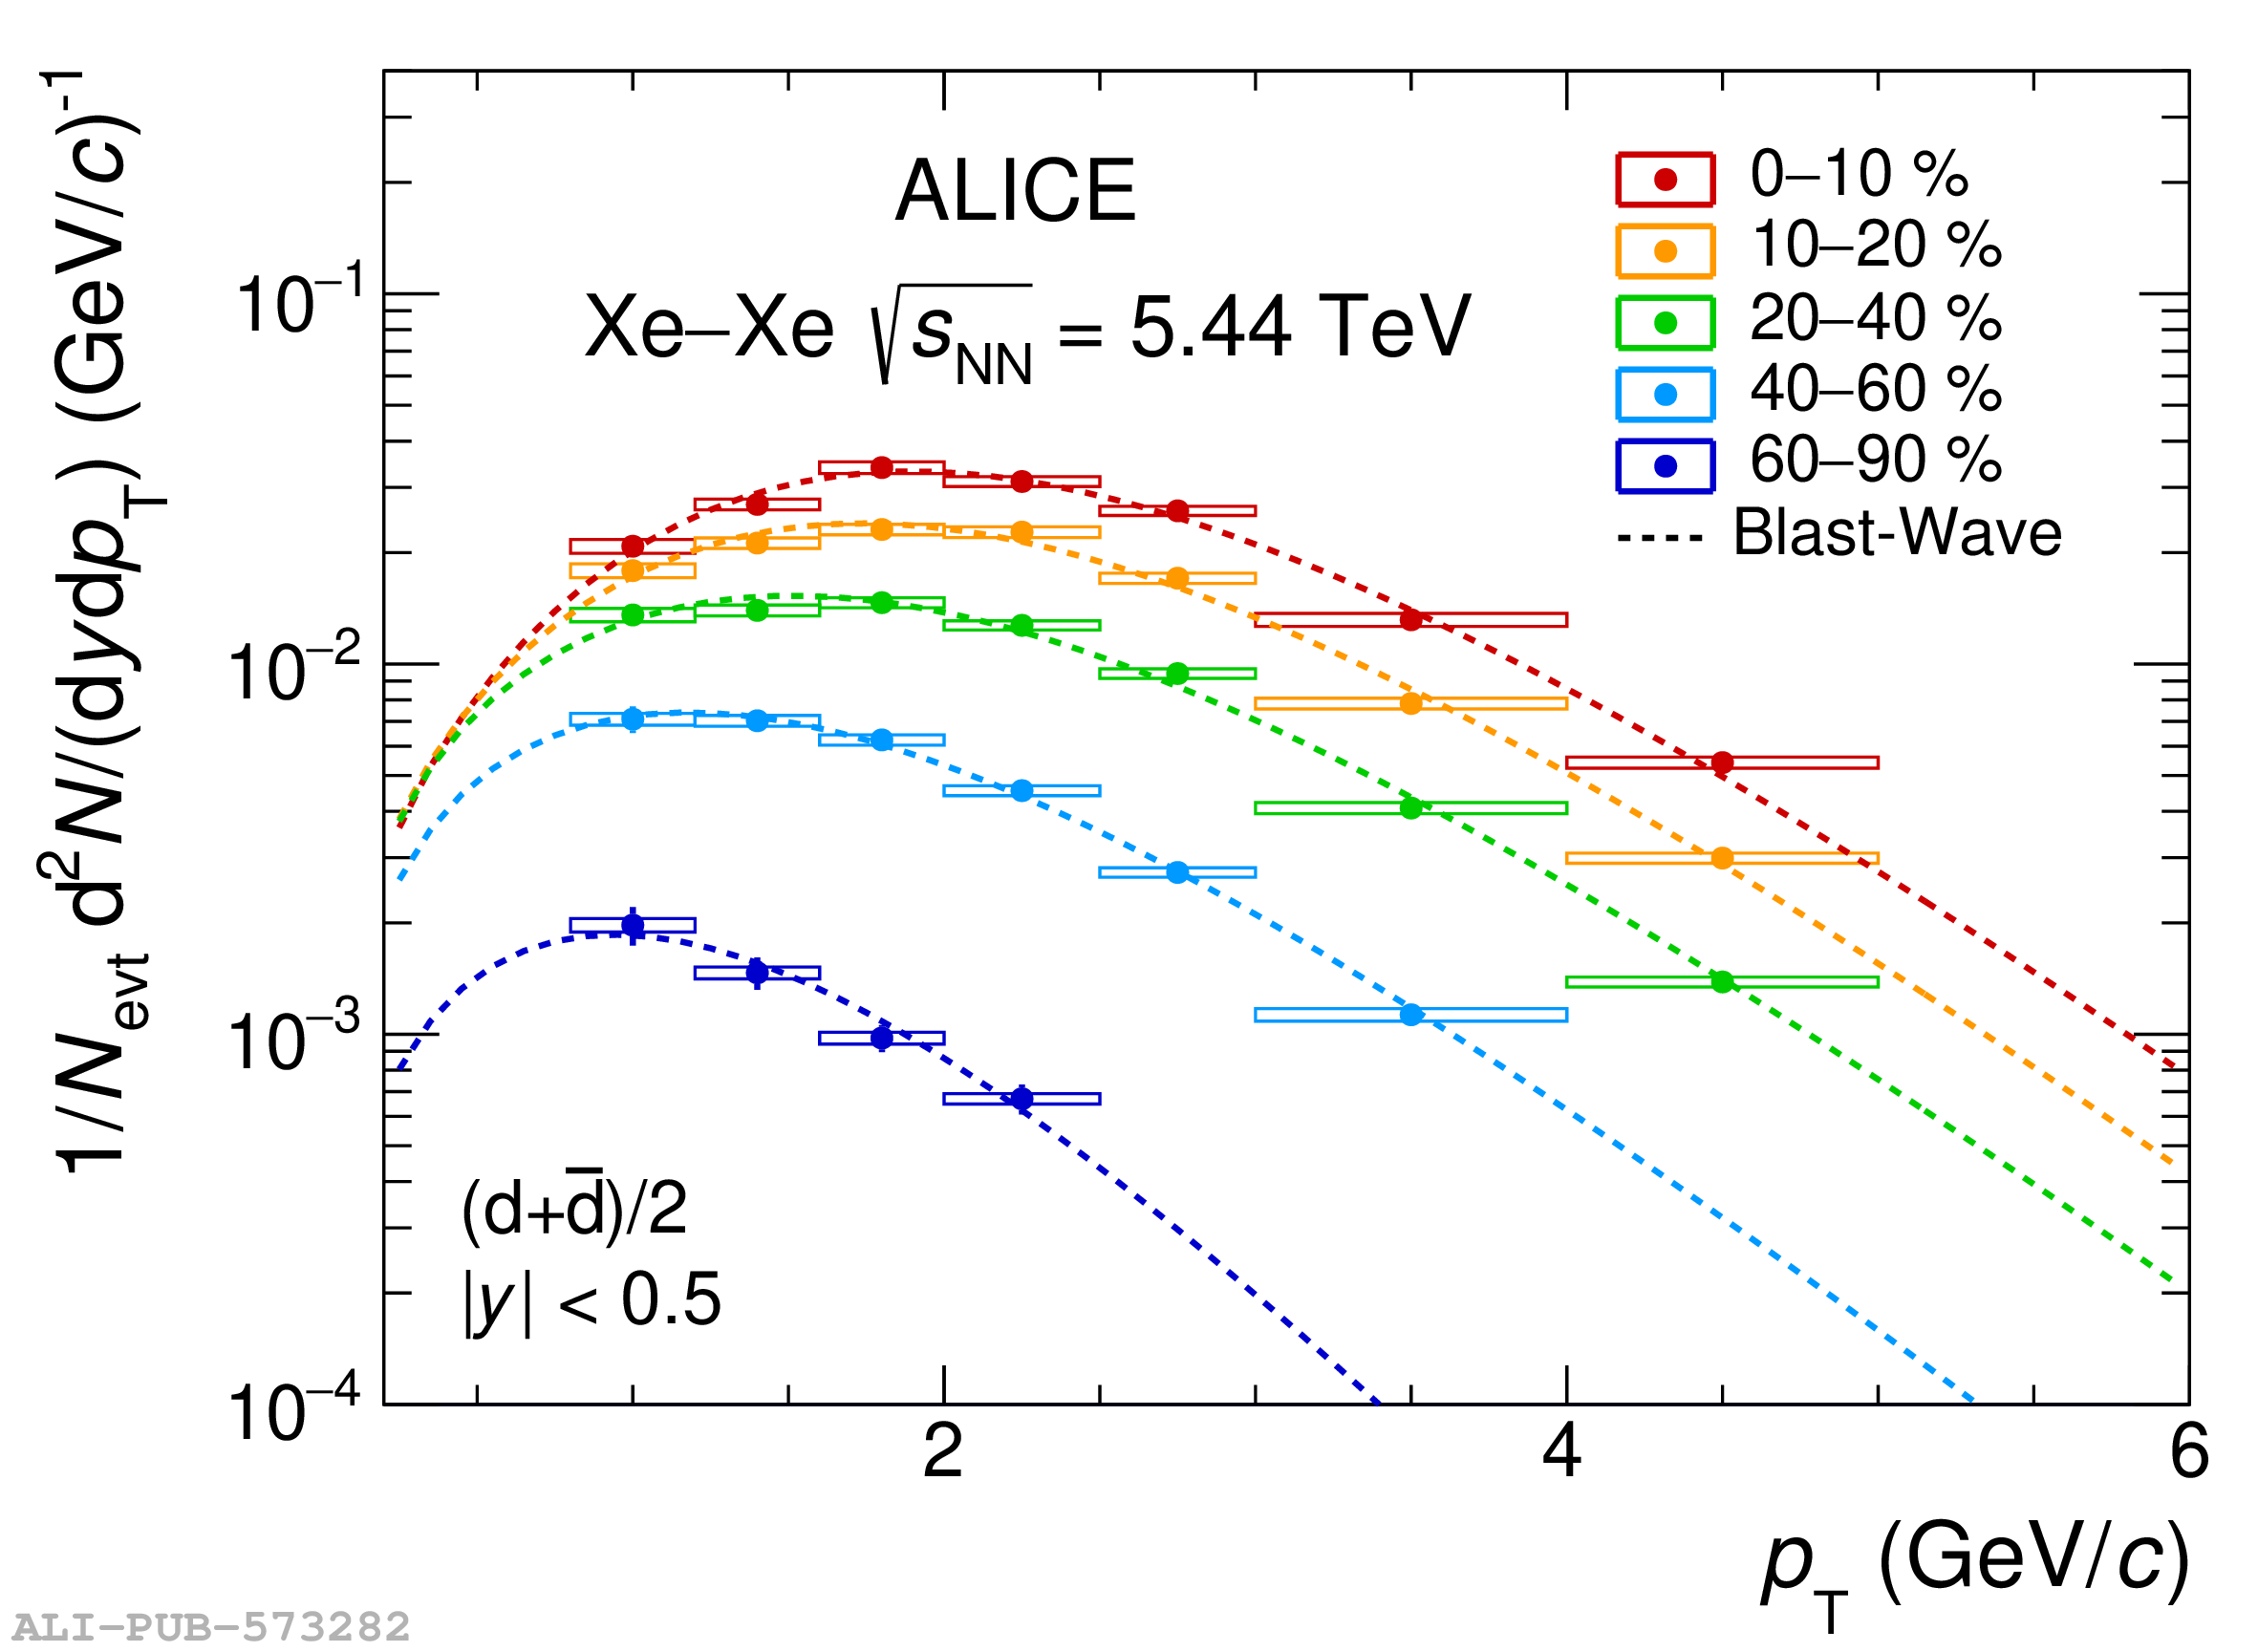  |