The $\Delta M$ distribution (left) and the extracted $v_2$ (right) of deuteron candidates as a function of $\Delta M$ for $0.8 <$ \pt $<1.6$ \GeVc in the centrality interval 0--20\% in Xe--Xe collisions. The statistical uncertainties on the data points are represented by bars. The measurement is carried out at midrapidity, i.e., $\left|y\right|<0.5$. |  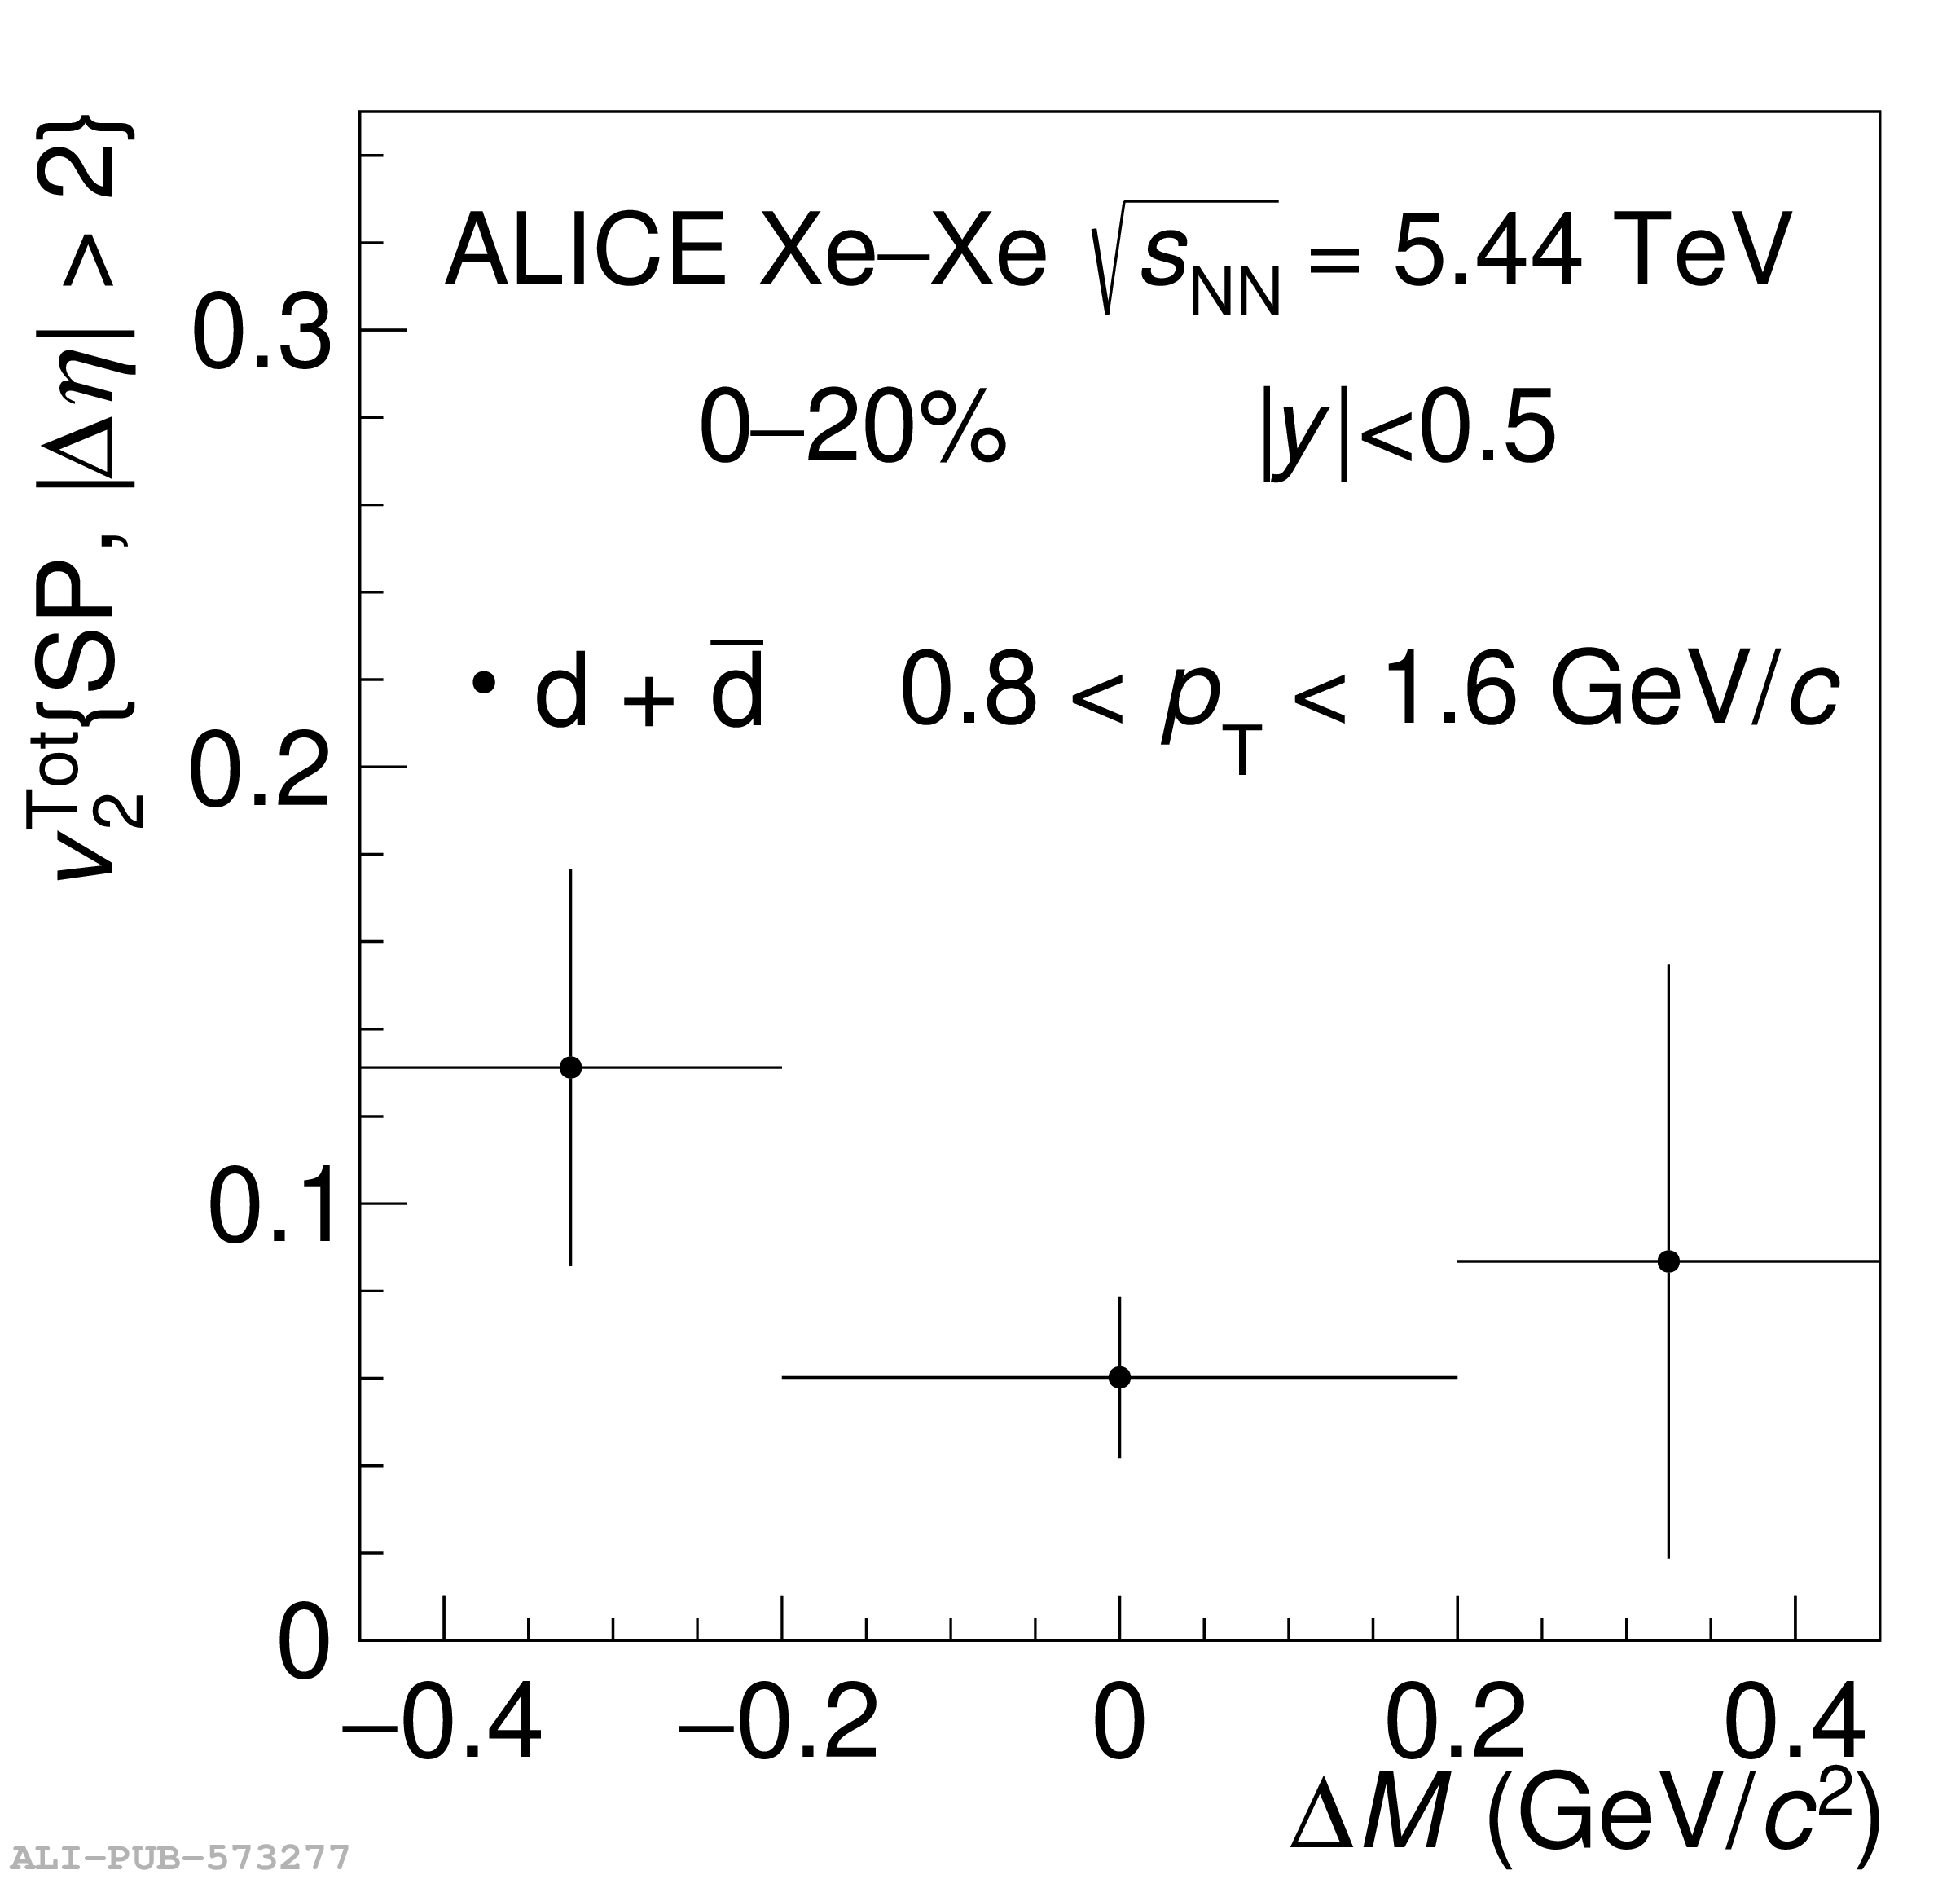 |