Pairwise (h--$\phi$)/(h--h) ratio vs $\langle N_{\mathrm{ch}} \rangle$ for the lower associated momentum range, $1.5 < p_{\rm T} < 2.5$ $\mathrm{GeV}/c$ (top), and higher associated momentum range, $2.5 < p_{\rm T} < 4.0$ $\mathrm{GeV}/c$ (bottom). Statistical uncertainties are presented as error bars, while systematic uncertainties, including uncertainties on the calculated $\langle N_{\mathrm{ch}} \rangle$ value, are shown as open boxes. The additional uncertainty in the ratio due to a non-zero $v_2$ in the underlying-event background estimation is depicted as a gray band. Systematic uncertainties for the (h--h) and (h--$\phi$) yields are treated as uncorrelated when calculating the uncertainty on the ratio. Ratios from p--Pb data are depicted as solid points, while ratios from PYTHIA 8 simulations of pp events are depicted as open points. |  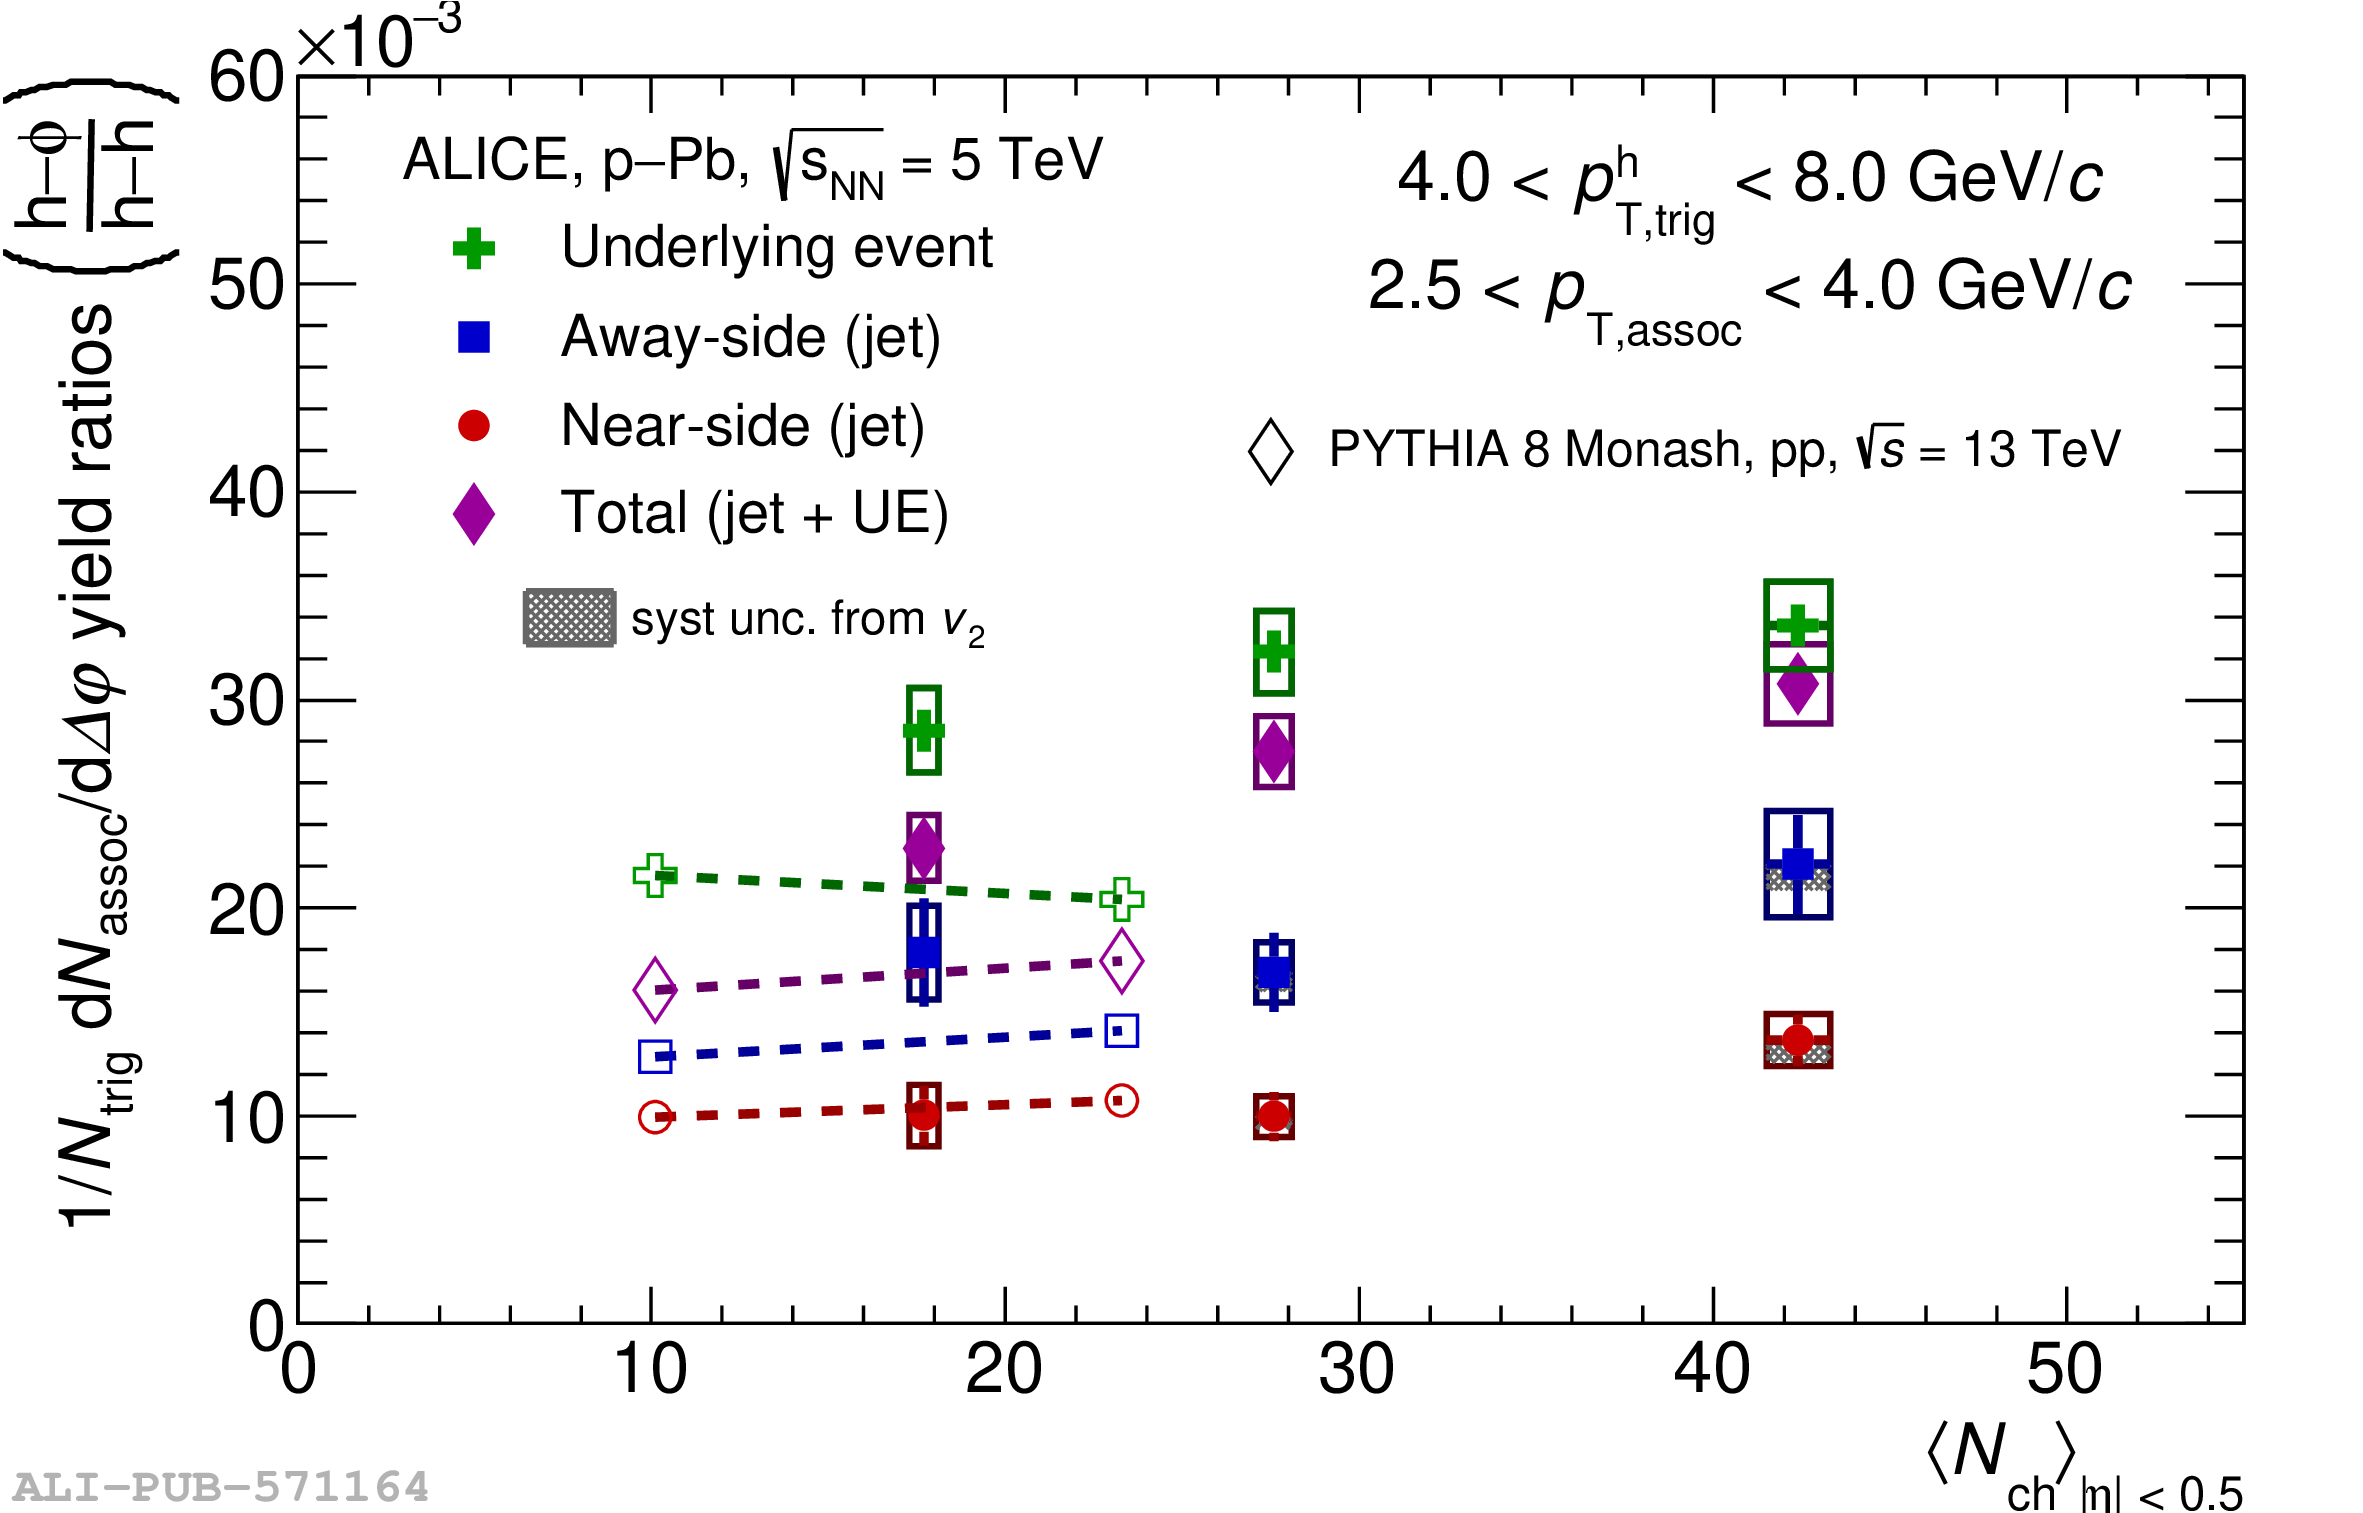 |