Per-trigger h--$\phi$ $\Delta\varphi$ angular correlations integrated over the range $|\Delta\eta| < 1.2$ for the lower $p_{\mathrm{T}}$ range of associated $\phi$(1020), $1.5 < p_{\rm T} < 2.5$ $\mathrm{ GeV}/c$ (top), and the higher $p_{\mathrm{T}}$ range of associated $\phi$(1020), $2.5 < p_{\rm T} < 4.0$ $\mathrm{ GeV}/c$ (bottom). The three multiplicity classes are plotted in increasing order from left to right. All plots for a given associated particle $p_{\mathrm{T}}$ have the same axis scale, with offsets set to their respective underlying background estimation. Statistical uncertainties are represented as error bars, while systematic uncertainties are marked with open rectangles. The grey band shows the systematic range for the different background estimation methods. The long dashed line shows the flat background assumption, while the short dotted line shows the alternative background with non-zero $v_2$ (used as systematic for pair yields). |     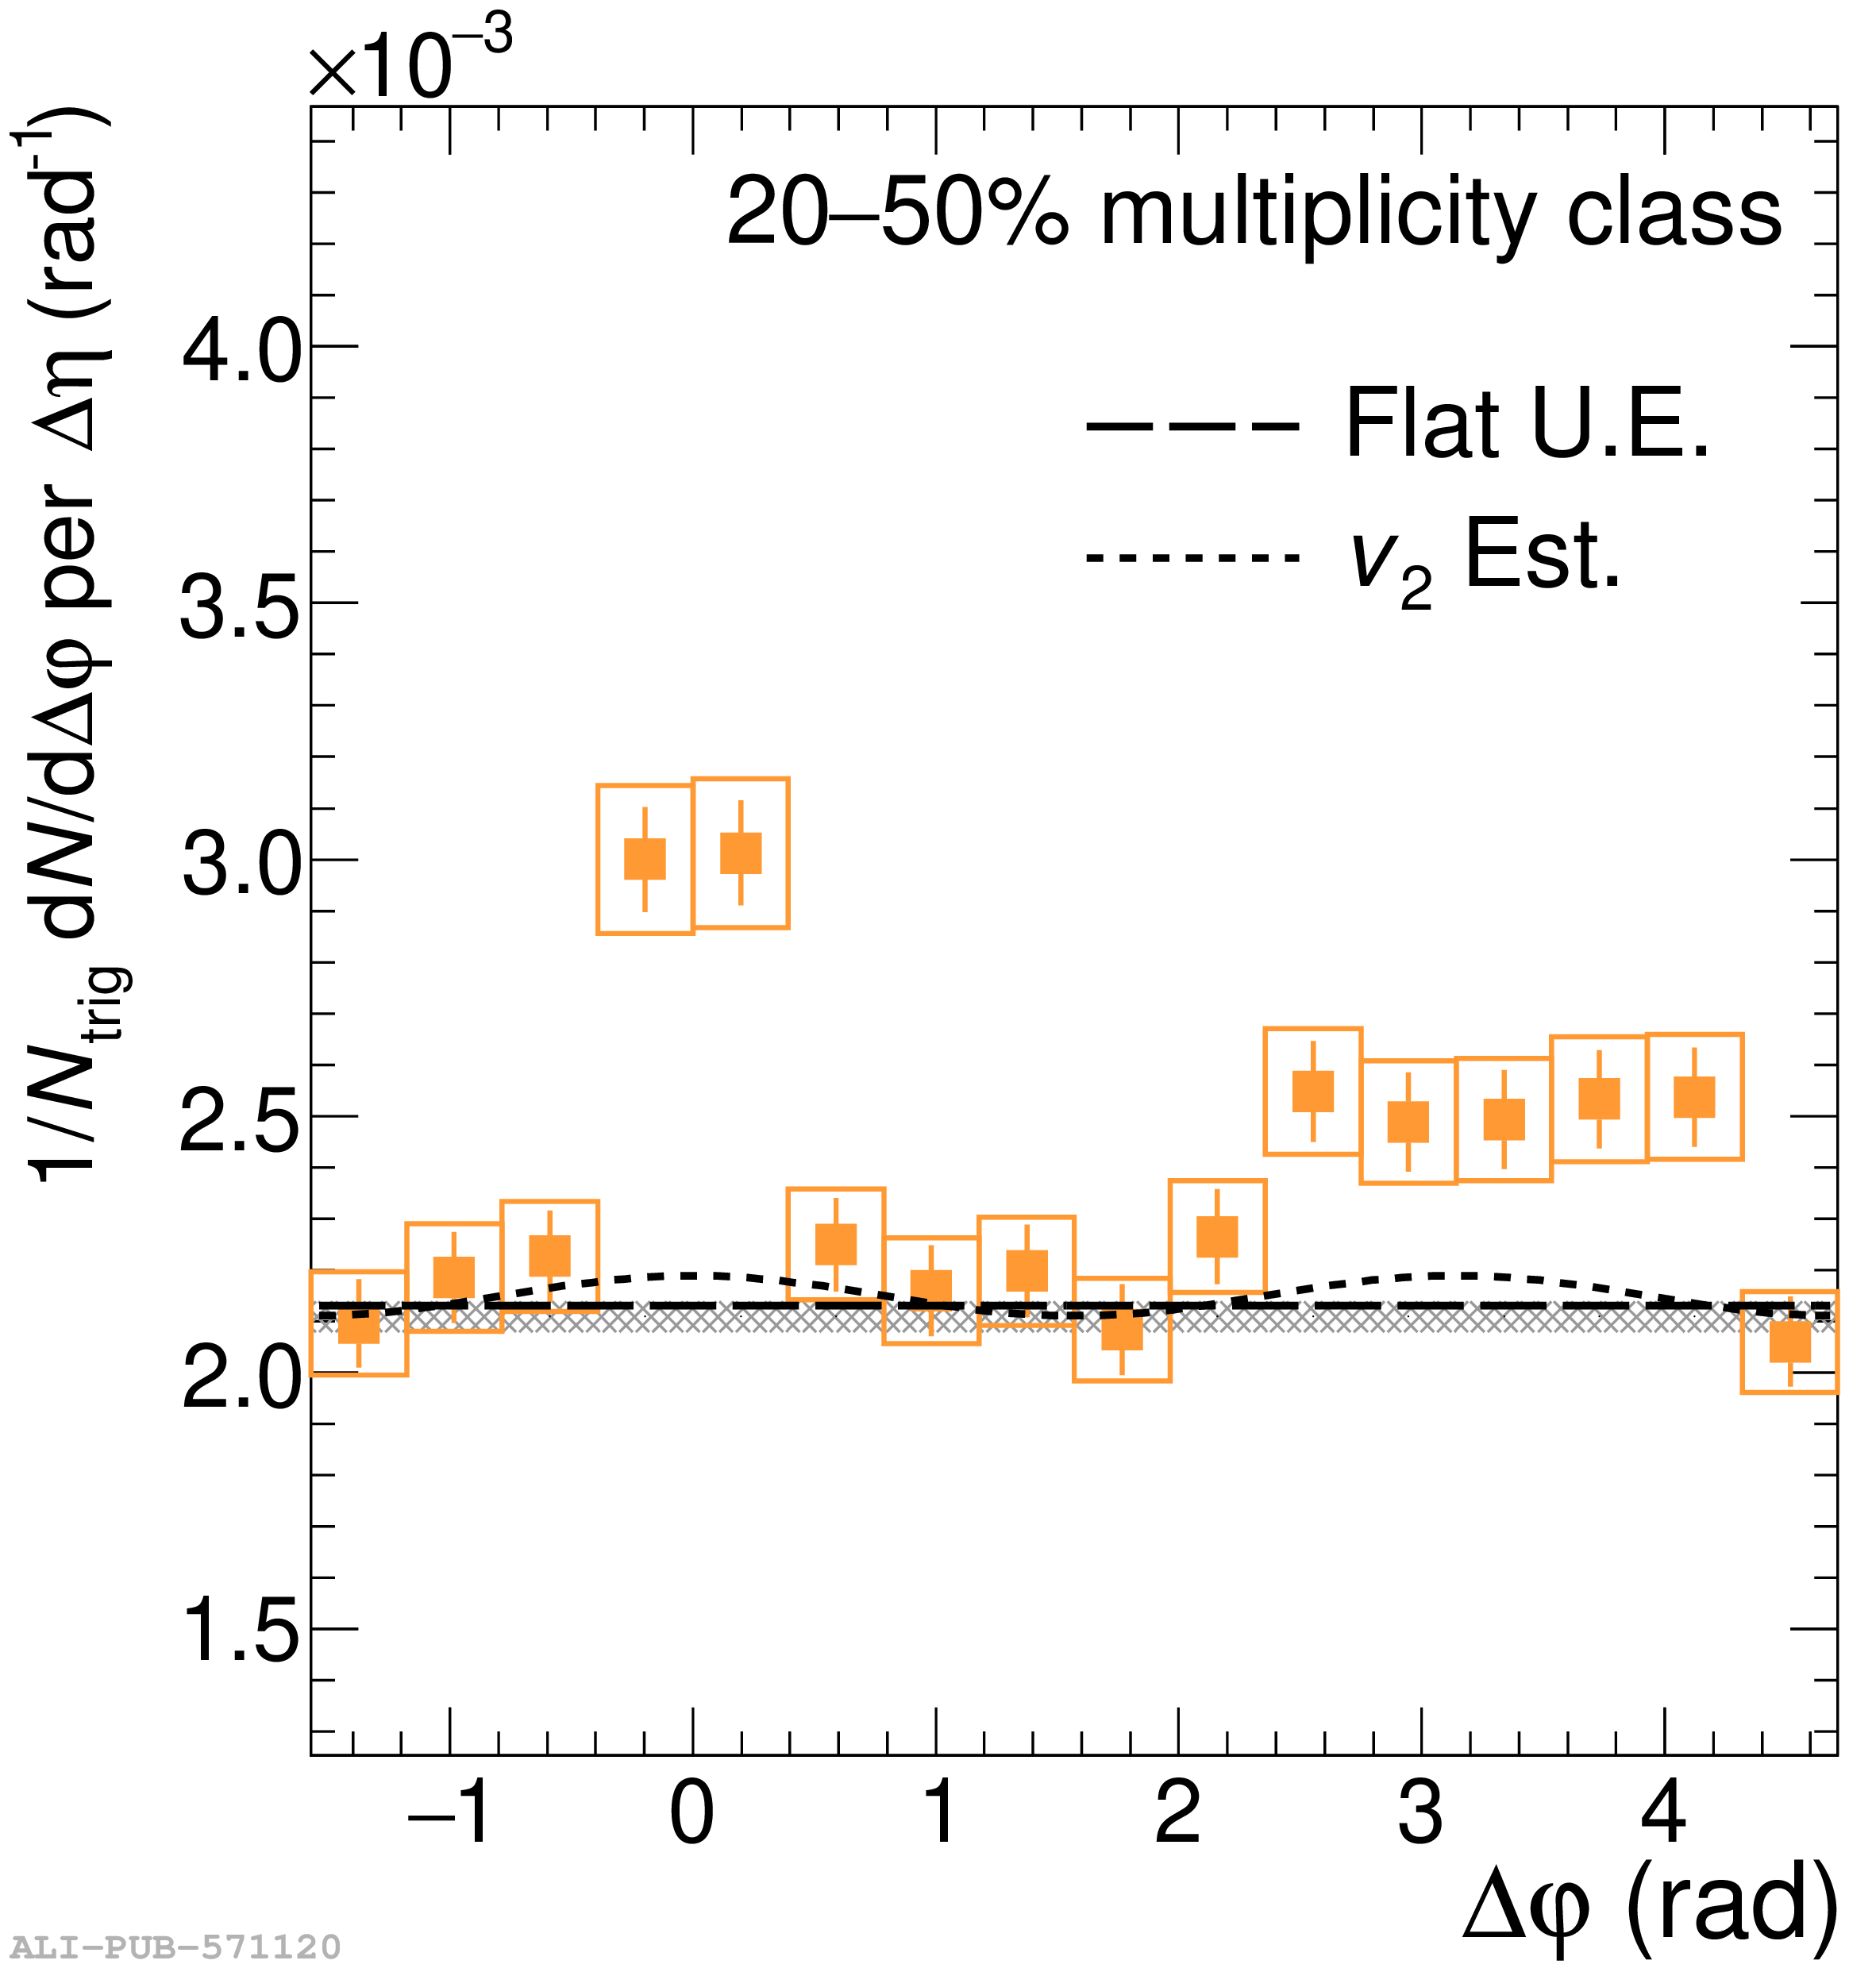  |