The azimuthal-correlation distributions between electrons from the decays of heavy-flavor hadrons and associated charged particles in Pb-Pb collisions at $\sqrt{s_{\rm NN}} = 5.02$ TeV are reported for the 0-10% and 30-50% centrality classes. This is the first measurement to provide access to the azimuthal-correlation observables in the heavy-flavor sector in Pb-Pb collisions. The analysis is performed for trigger electrons from heavy-flavor hadron decays with transverse momentum $4 <~ p_{\rm T}^{\rm e} <~ 16$ GeV/$c$, considering associated particles within the transverse-momentum range $1 <~ p_{\rm T}^{\rm assoc} <~ 7$ GeV/$c$, and a pseudorapidity difference of $|\Delta\eta| <~ 1$ between the trigger electron and associated particles. The per-trigger nuclear modification factor ($I_{\rm AA}$) is calculated to compare the near- and away-side peak yields to those in pp collisions at $\sqrt{s} = 5.02$ TeV. In 0-10% central collisions, the $I_{\rm AA}$ indicates a hint of enhancement of associated-particle yields with $p_{\rm T} <~ 3$ GeV/$c$ on the near side, and a suppression of yields with $p_{\rm T} > 4$ GeV/$c$ on the away side. The $I_{\rm AA}$ for electron triggers from heavy-flavor hadron decays is compared with that for light-flavor and strange-particle triggers to investigate the dependence on different fragmentation processes and parton-medium dynamics, and is found to be the same within uncertainties.
Eur. Phys. J. C (2026) 86:598
HEP Data
e-Print: arXiv:2507.13197 | PDF | inSPIRE
CERN-EP-2025-137
Figure group
Figure 1
Azimuthal-correlation distributions of electrons from heavy-flavor hadron decays and charged particles before baseline subtraction for $4 \pt^{\rm e} 12$ \GeVc and different associated \pt intervals, for the central (0--10\%, top panels) and semicentral (30--50\%, bottom panels) Pb--Pb collisions at $\sqrt{s_{\rm{NN}}} = 5.02$ TeV. The distributions are fitted with a von Mises function to describe the NS peak (solid gray line) and a baseline function which includes a constant term and $v_{\rm{n}}$ modulations (solid black curve). The statistical (uncorrelated systematic) uncertainties are shown as vertical lines (filled boxes). The uncertainties on the baseline are shown with a red band. | 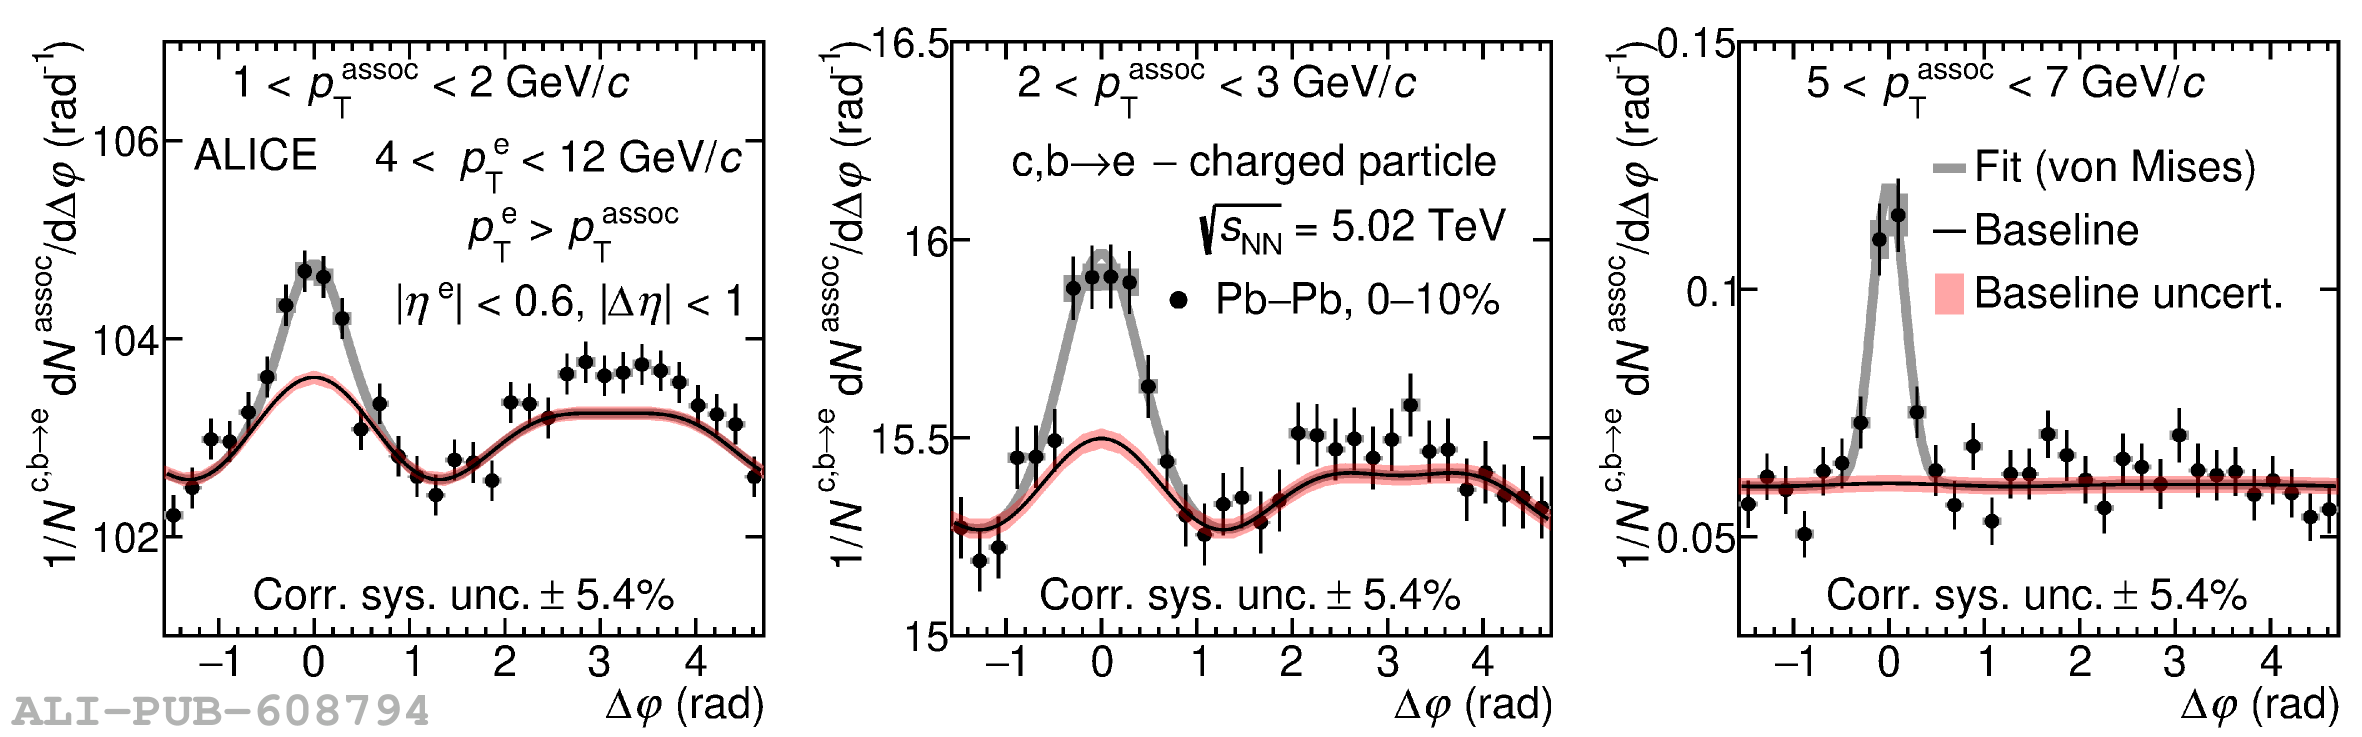 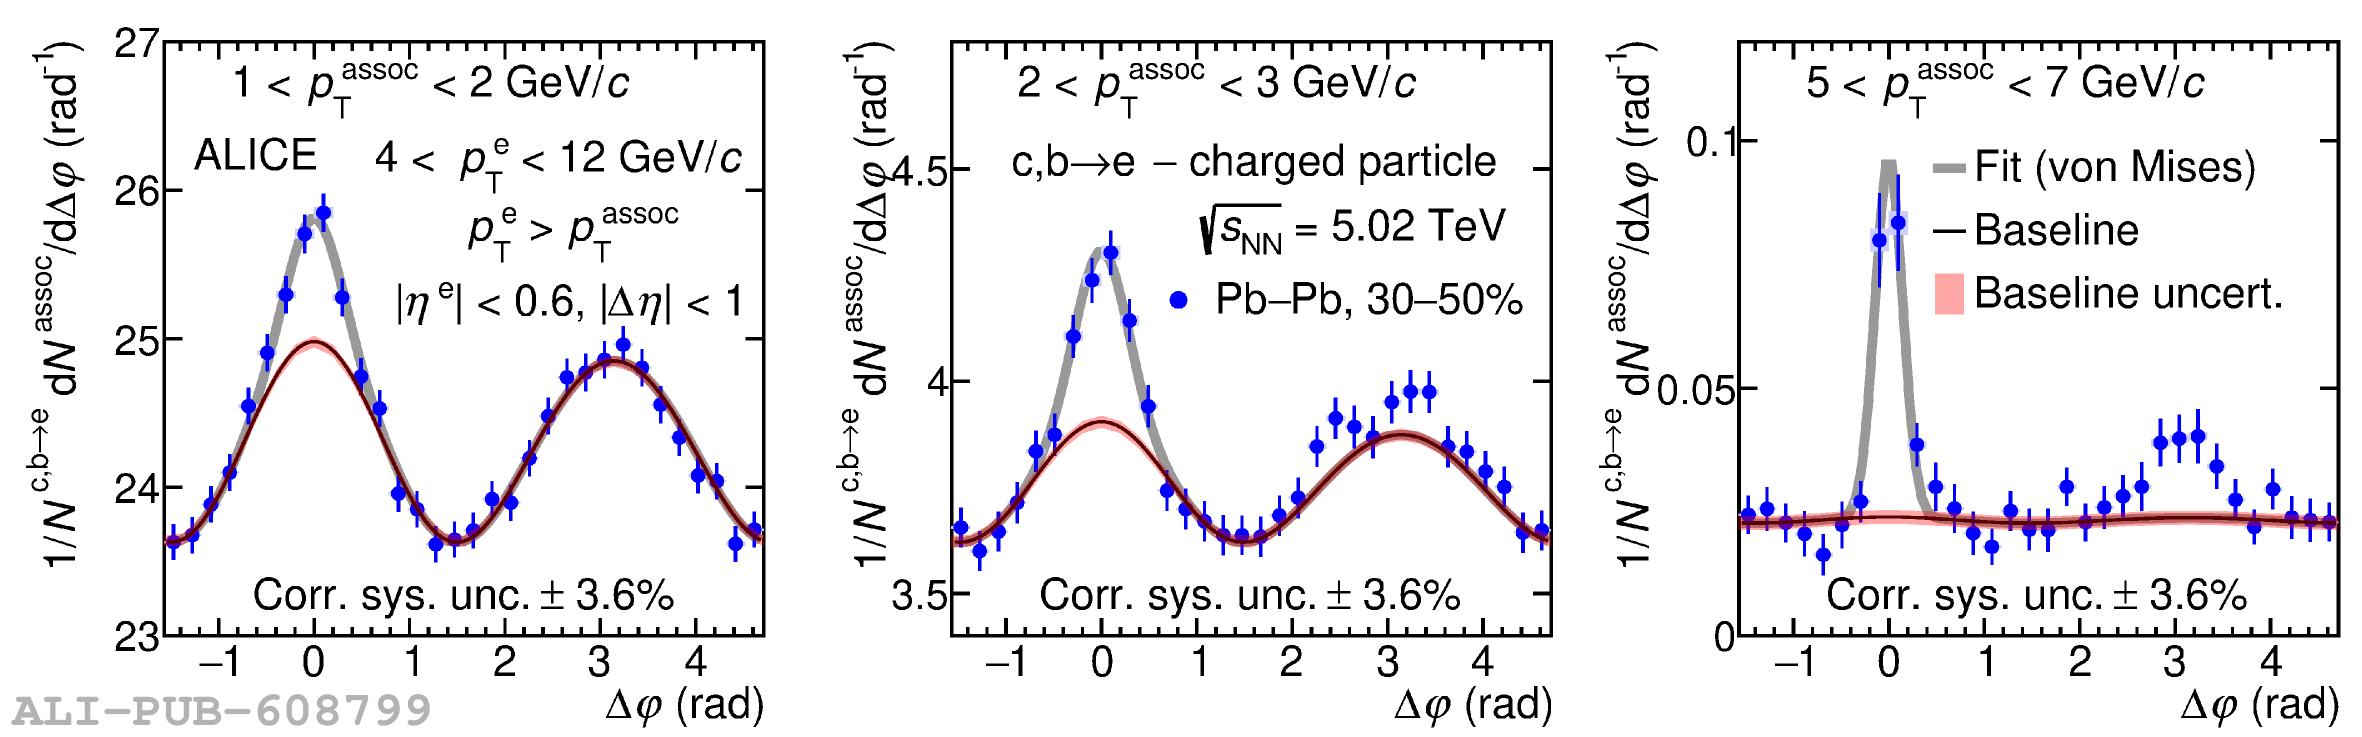 |
Figure 2
Comparison of the azimuthal-correlation distributions of electrons from heavy-flavor hadron decays and charged particles measured in the 0--10\% centrality class Pb--Pb collisions and in pp collisions , after the baseline subtraction, for $4 \pt^{\rm e} 12$ \GeVc and different associated \pt intervals. The statistical (uncorrelated systematic) uncertainties are shown as vertical lines (filled boxes). The uncertainties on the baseline estimation are shown as solid boxes at $\dph \sim -2$ and $5$ rad. The shaded gray area corresponds to the integrated regions in $\dph$ to obtain the NS and AS yield. | 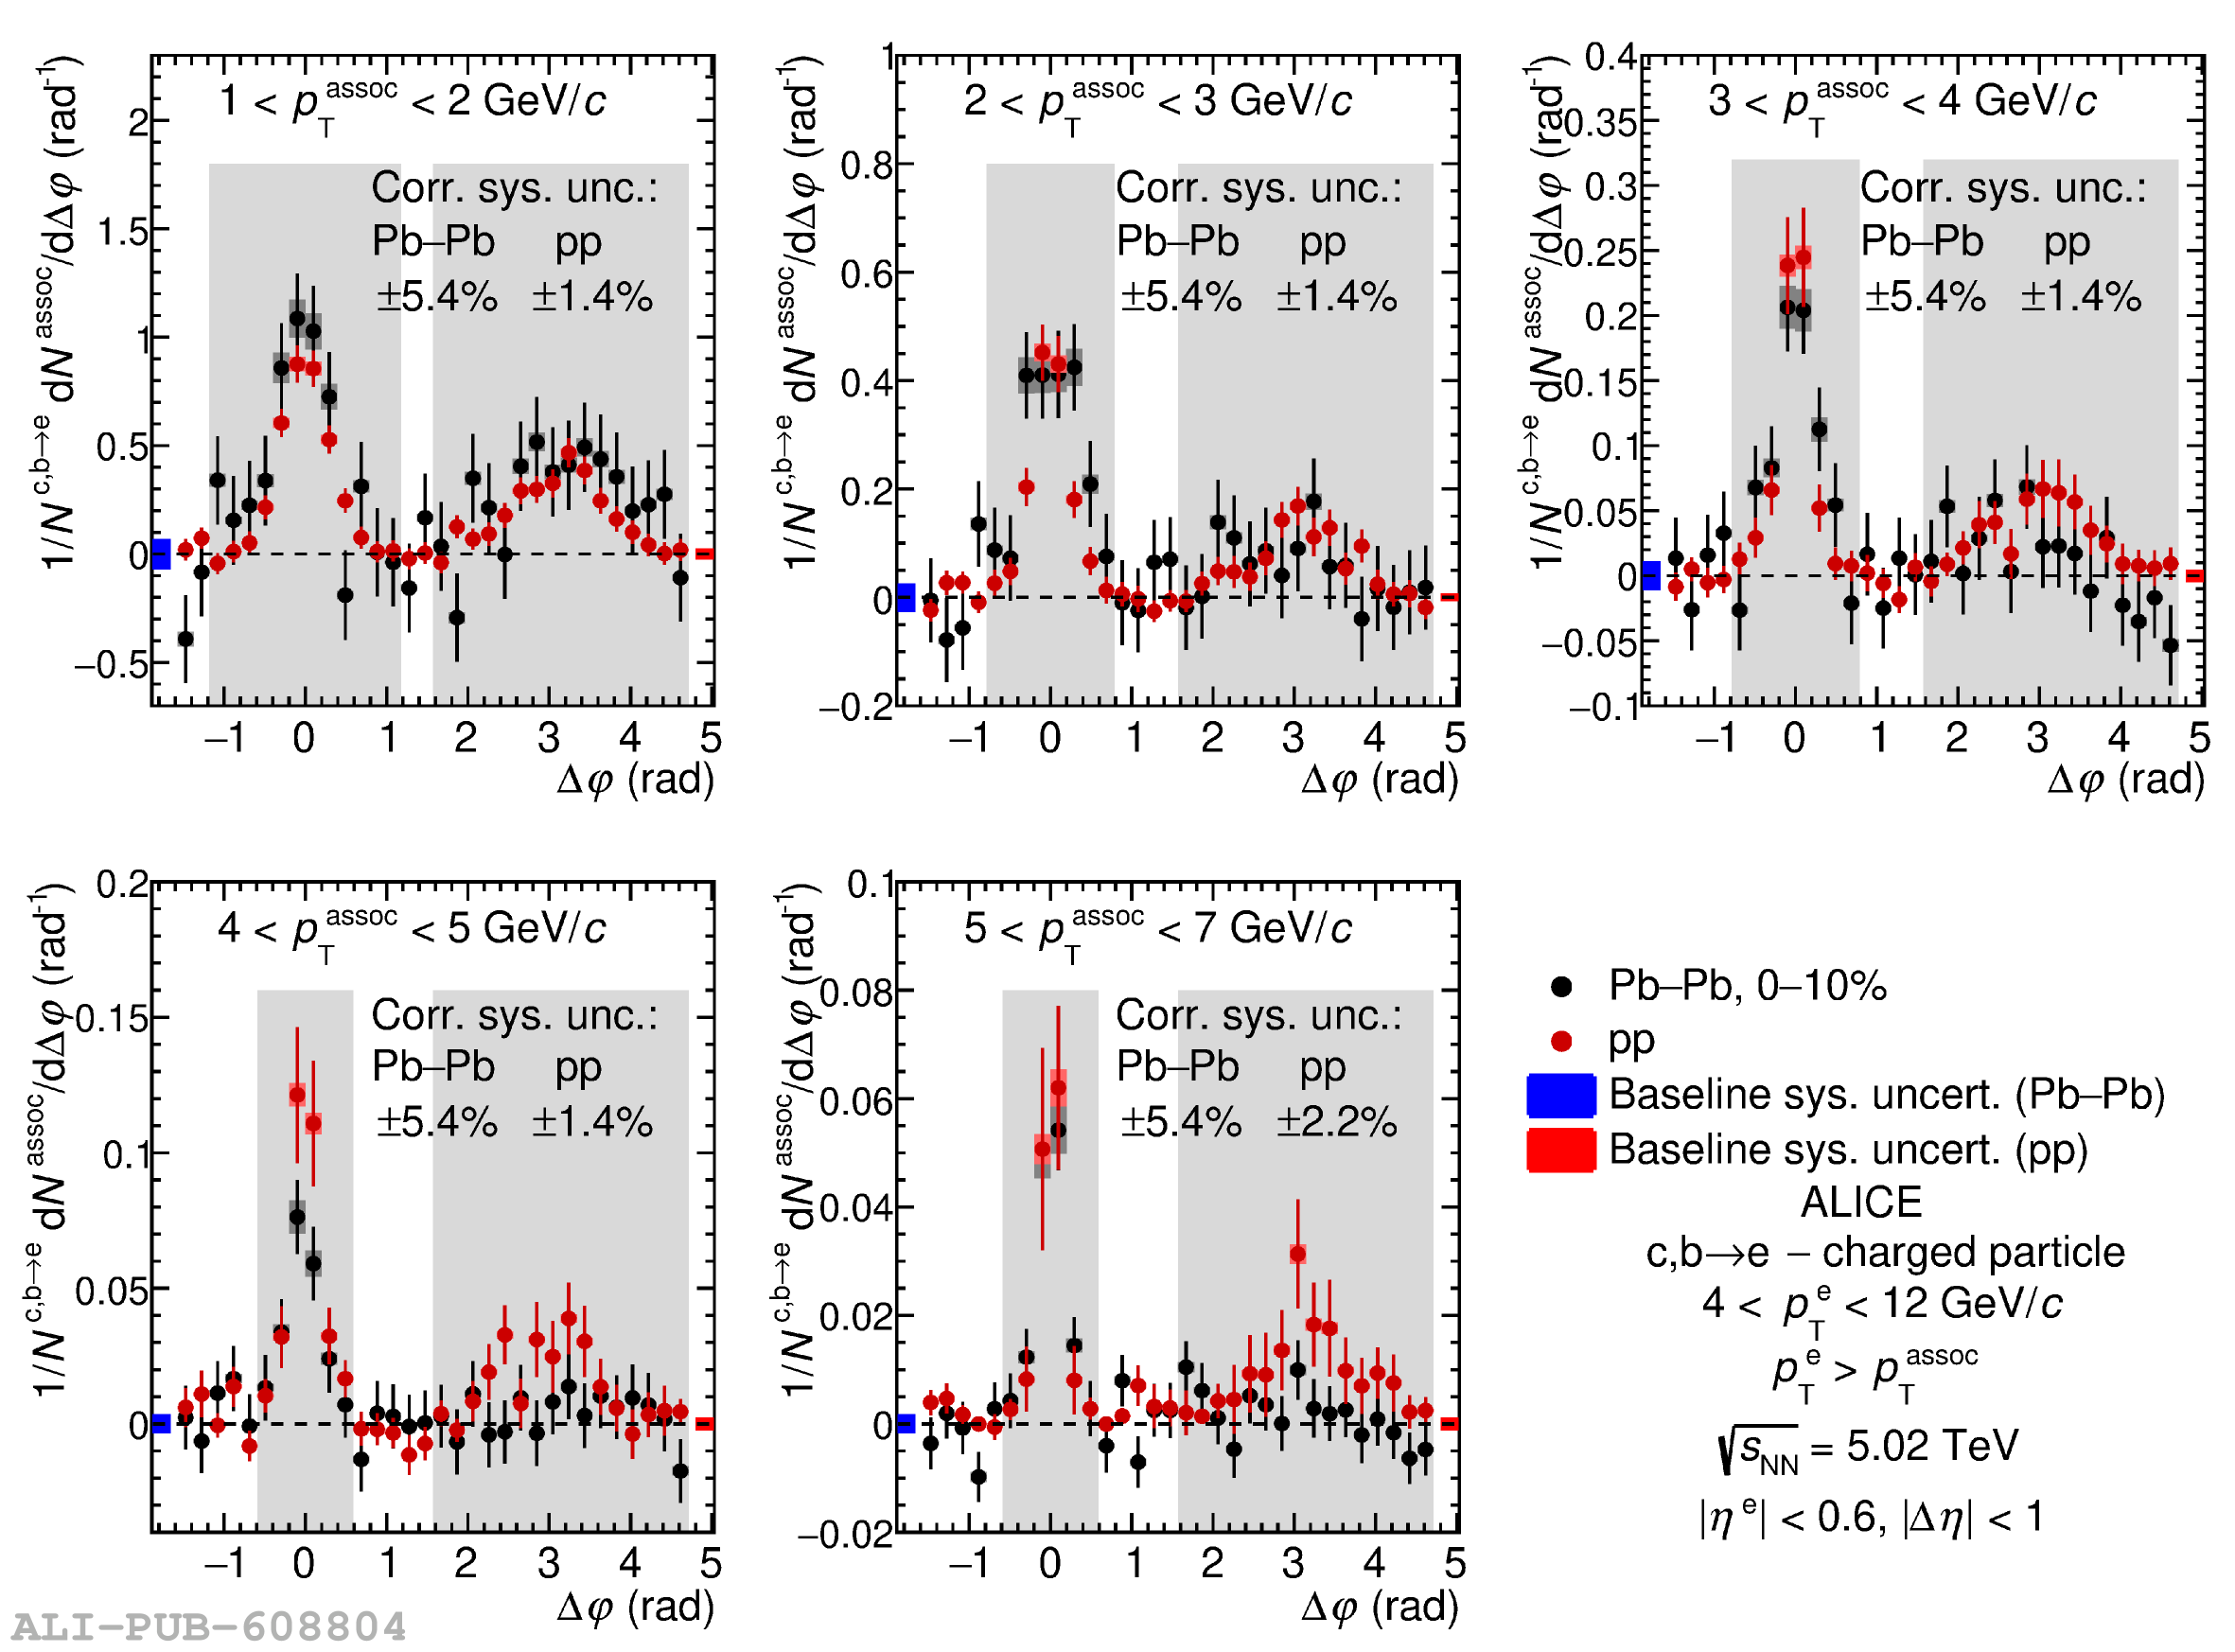 |
Figure 3
Comparison of the azimuthal-correlation distributions of electrons from heavy-flavor hadron decays and charged particles measured in the 30--50\% centrality class Pb--Pb collisions and in pp collisions , after the baseline subtraction, for $4 \pt^{\rm e} 12$ \GeVc and different associated \pt intervals. The statistical (uncorrelated systematic) uncertainties are shown as vertical lines (filled boxes). The uncertainties on the baseline estimation are shown as solid boxes at $\dph \sim -2$ and $5$ rad. The shaded gray area corresponds to the integrated regions in $\dph$ to obtain the NS and AS yield. | 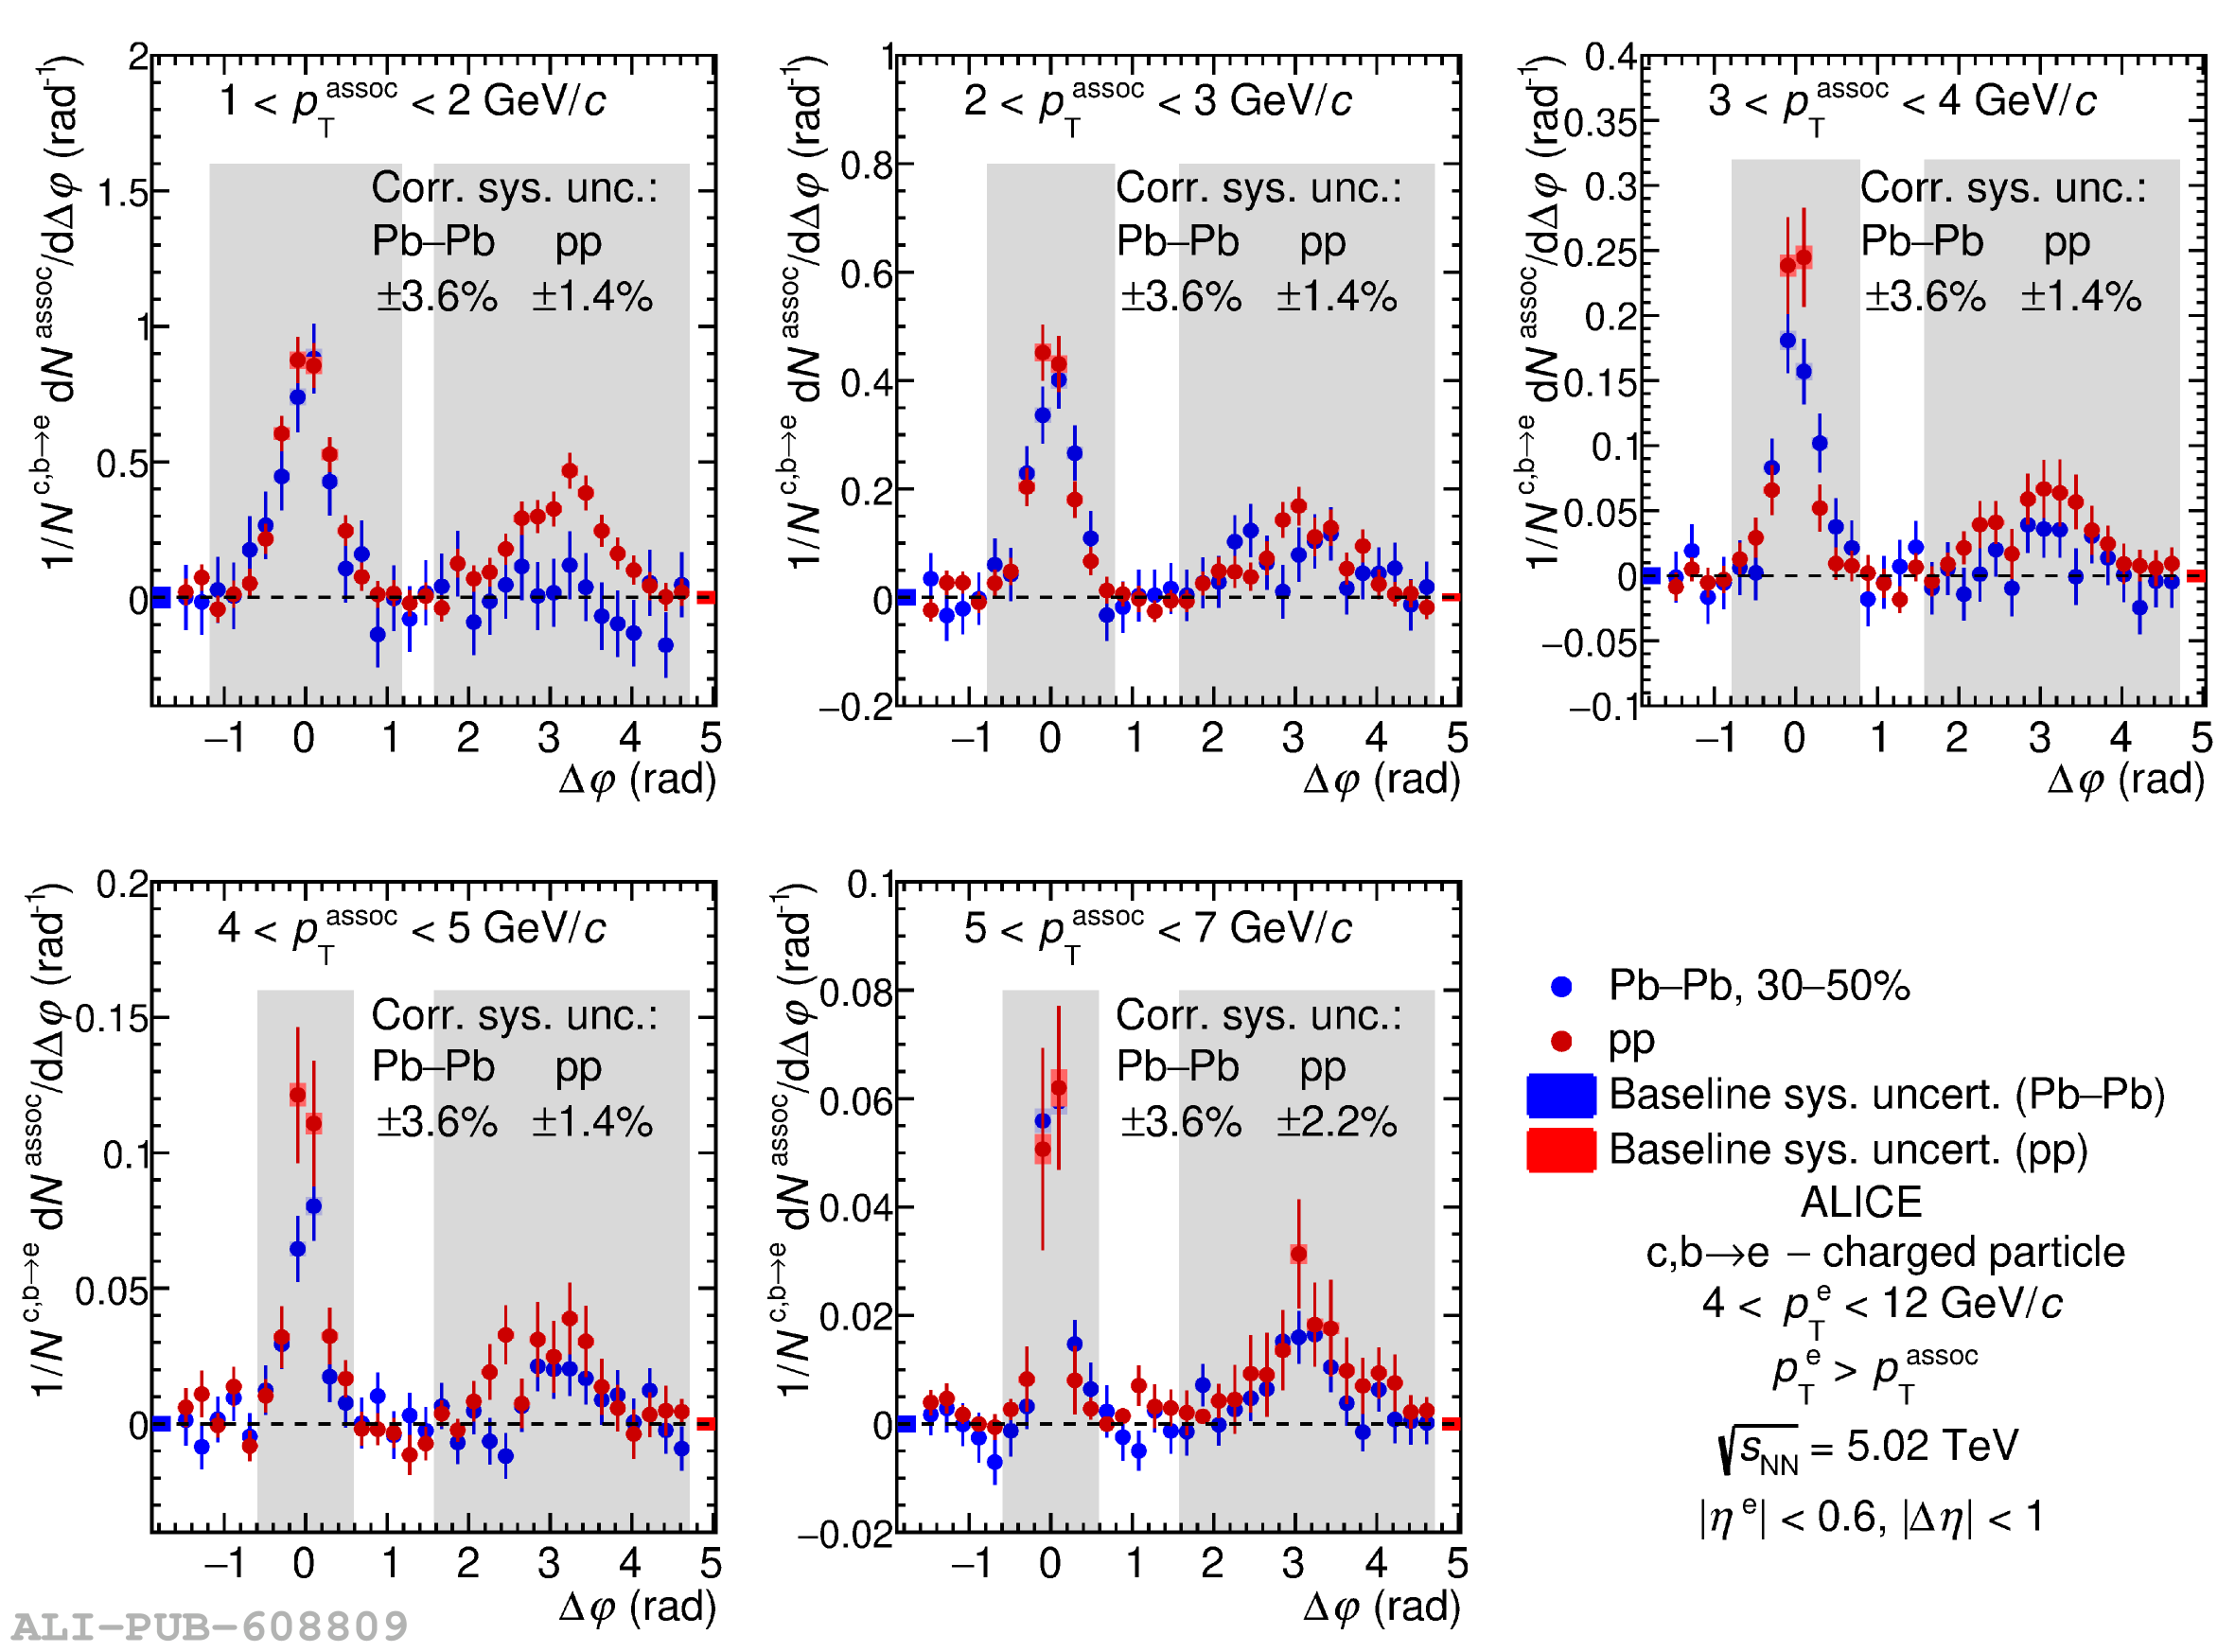 |
Figure 4
Per-trigger associated yields of the NS (left) and AS (right) peaks for $4 \pt^{\rm{e}} 12$ \GeVc as a function of $\pt^{\rm{assoc}}$ in Pb--Pb collision centrality classes 0--10\% and 30--50\%, compared to those obtained from minimum-bias pp collisions. The statistical (systematic) uncertainties are shown as vertical lines (empty boxes). In some $\pt^{\rm{assoc}}$ intervals, the AS yield is consistent with zero within one standard deviation of statistical and systematic uncertainties added in quadrature. For those intervals, upper limits on the yields for 68\% and 95\% confidence levels are evaluated, and are shown with arrows and boxes, respectively. | 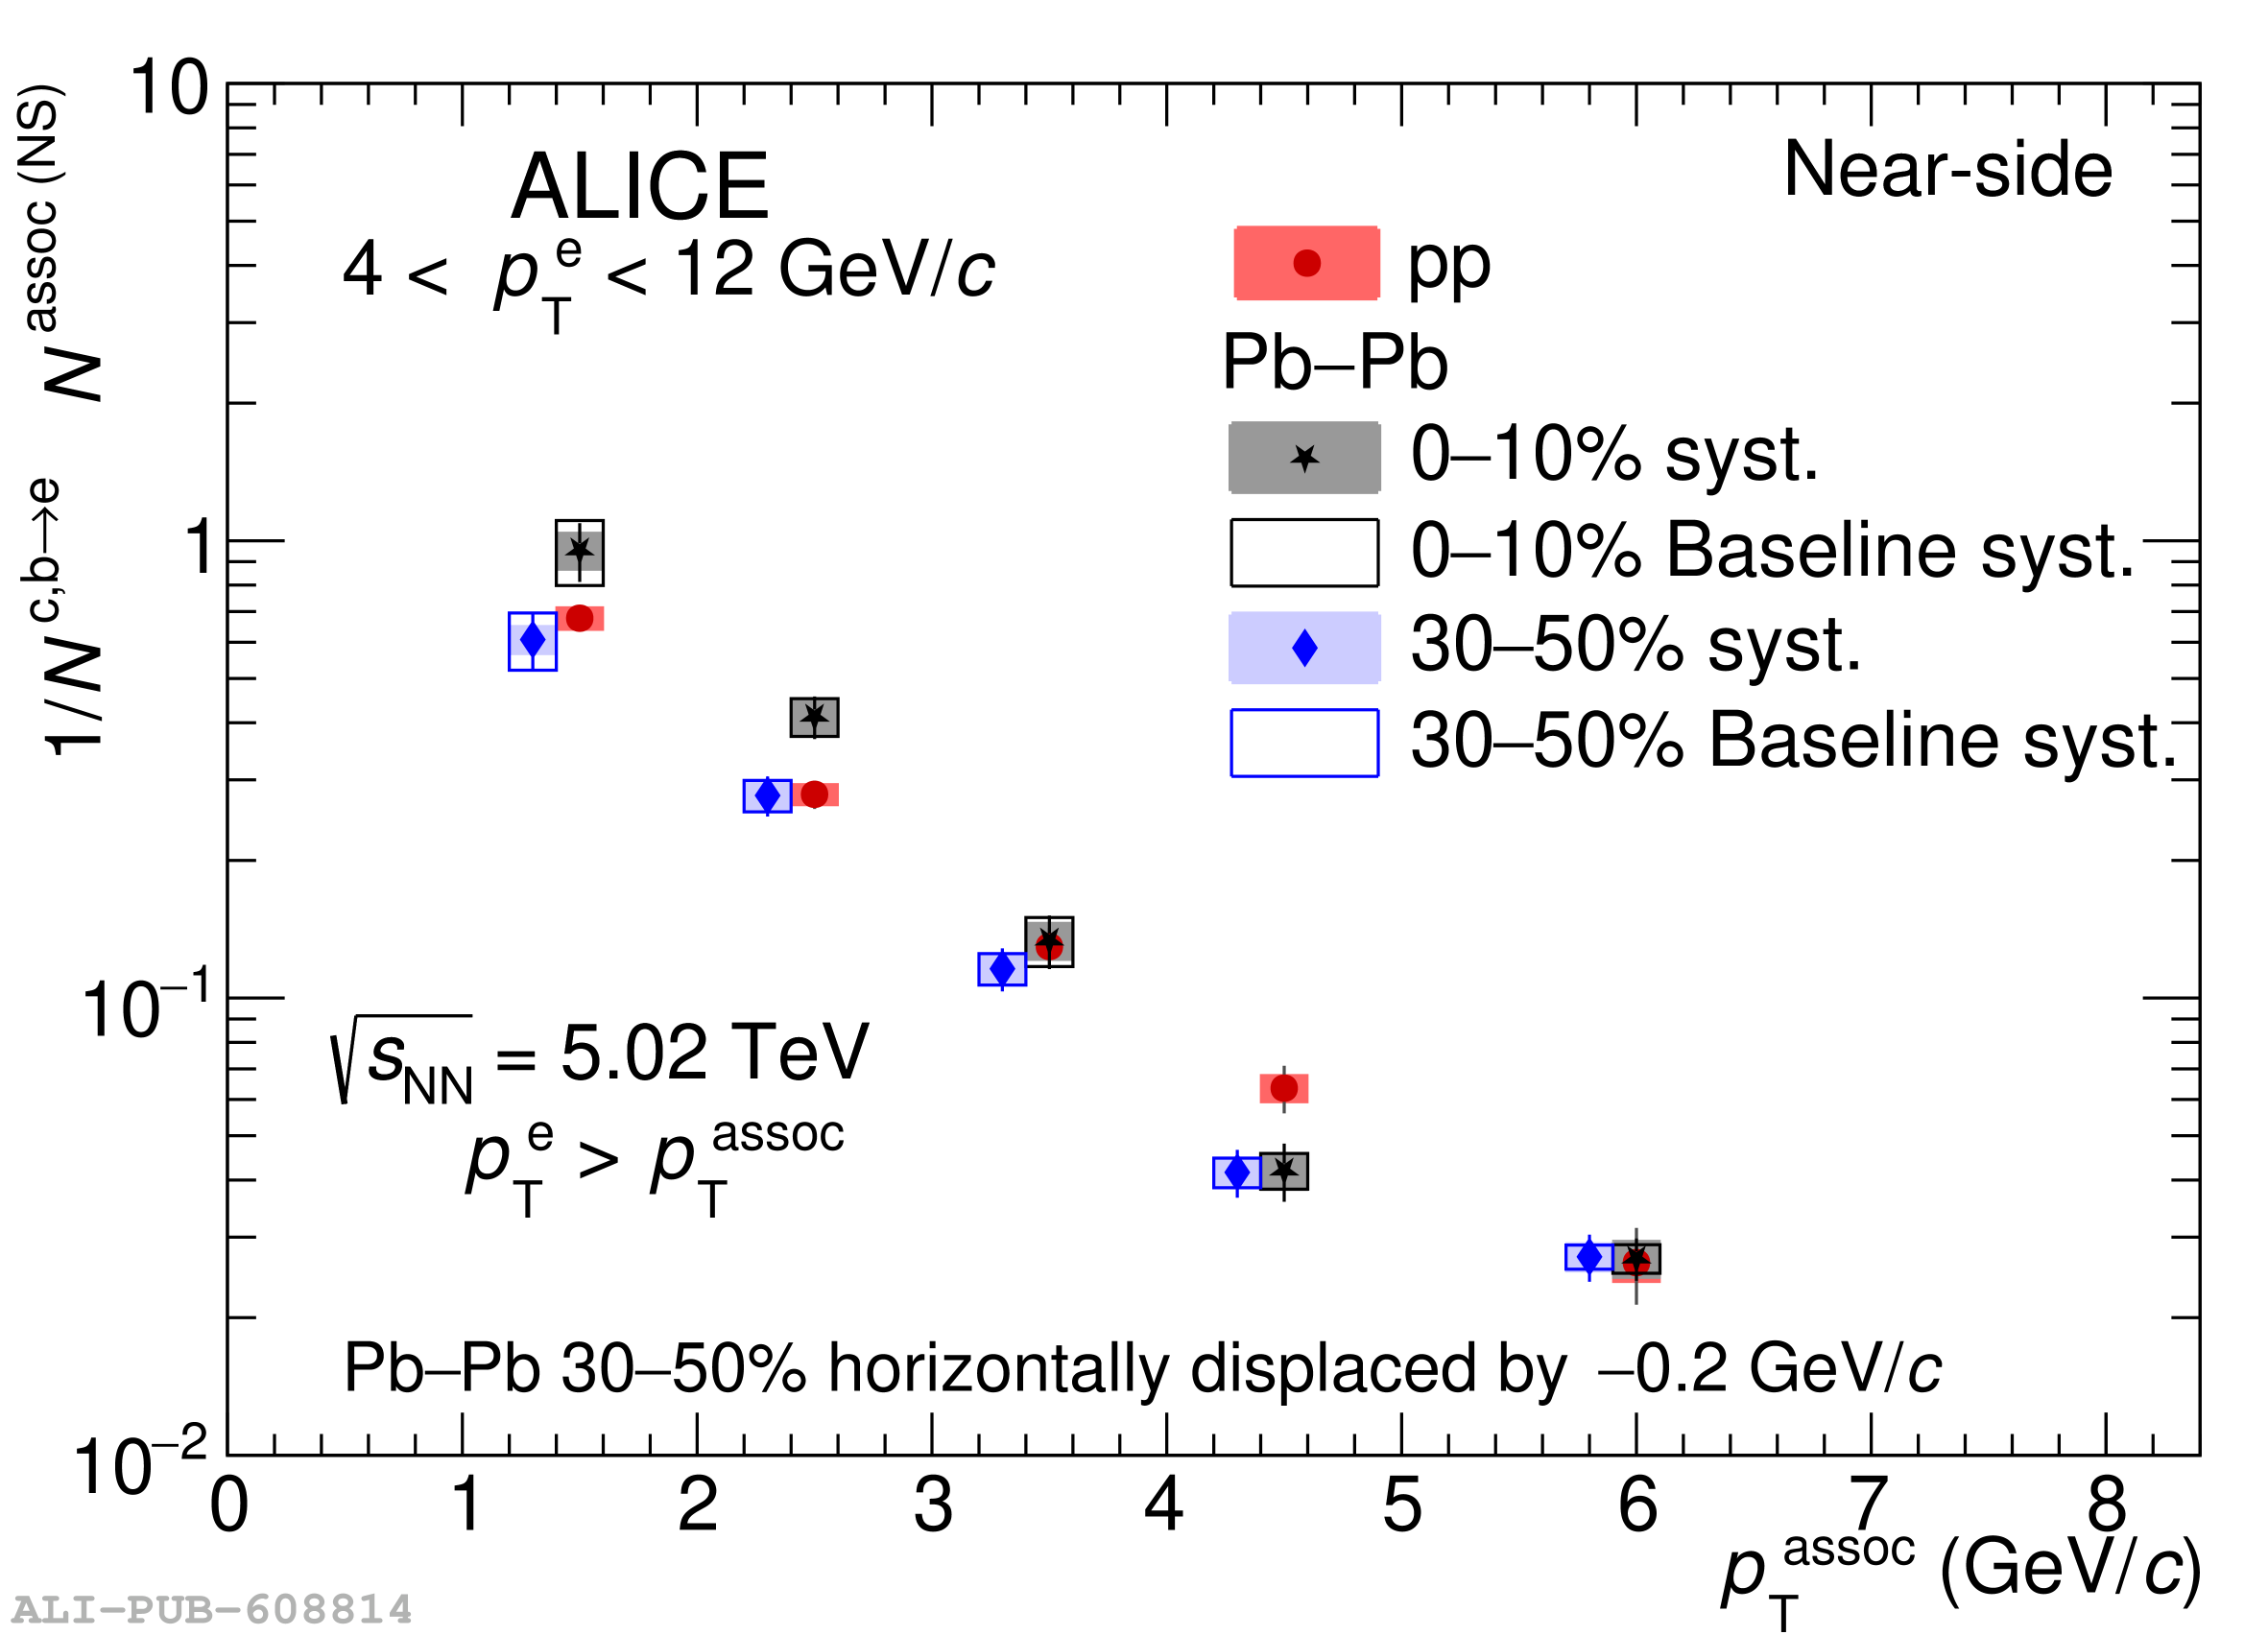 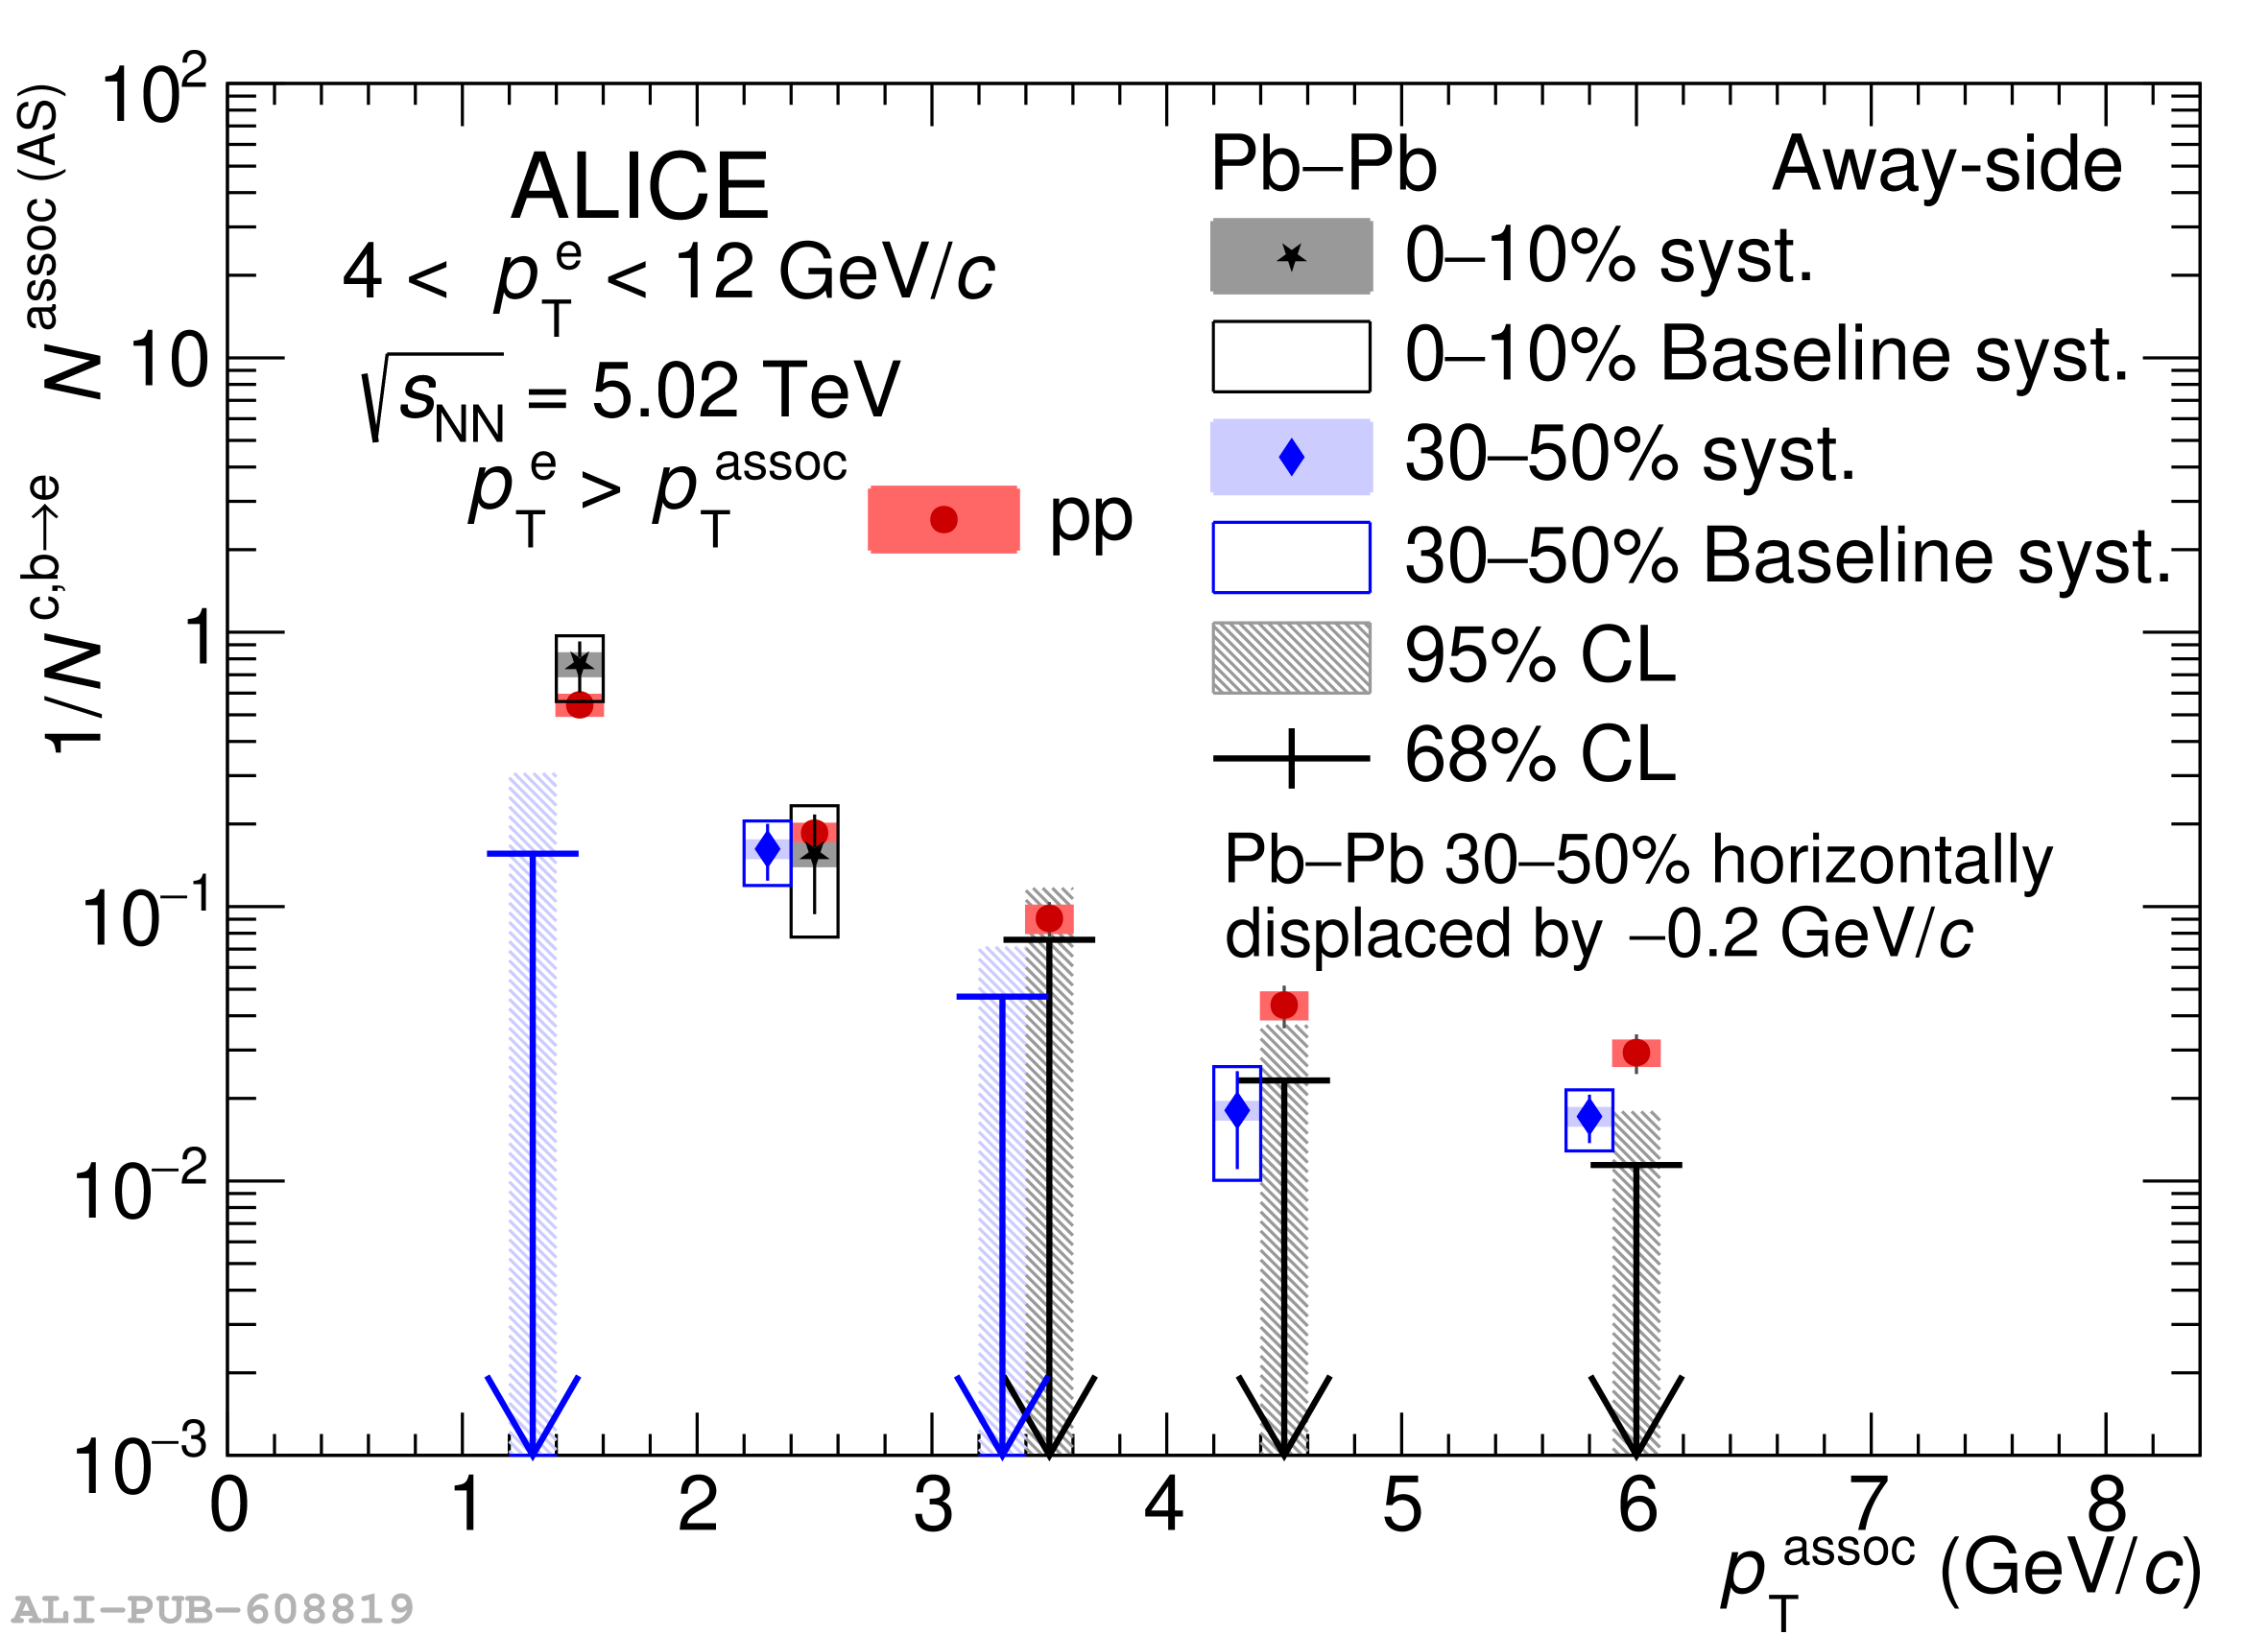 |
Figure 5
Per-trigger nuclear modification factor ($I_{\rm{AA}}$) of NS (left) and AS (right) associated yields, for electrons from heavy-flavor hadron decays in the interval $4 \pt^{\rm{e}} 12$ \GeVc as a function of $\pt^{\rm{assoc}}$ in Pb--Pb collisions of centrality classes 0--10\% and 30--50\%. The statistical (systematic) uncertainties are shown as vertical lines (empty boxes). In some $\pt^{\rm{assoc}}$ intervals the AS yield is consistent with zero within one standard deviation of total uncertainty. For those intervals, upper limits on the $I_{\rm{AA}}$ for 68\% and 95\% confidence levels are shown with arrows and boxes, respectively. | 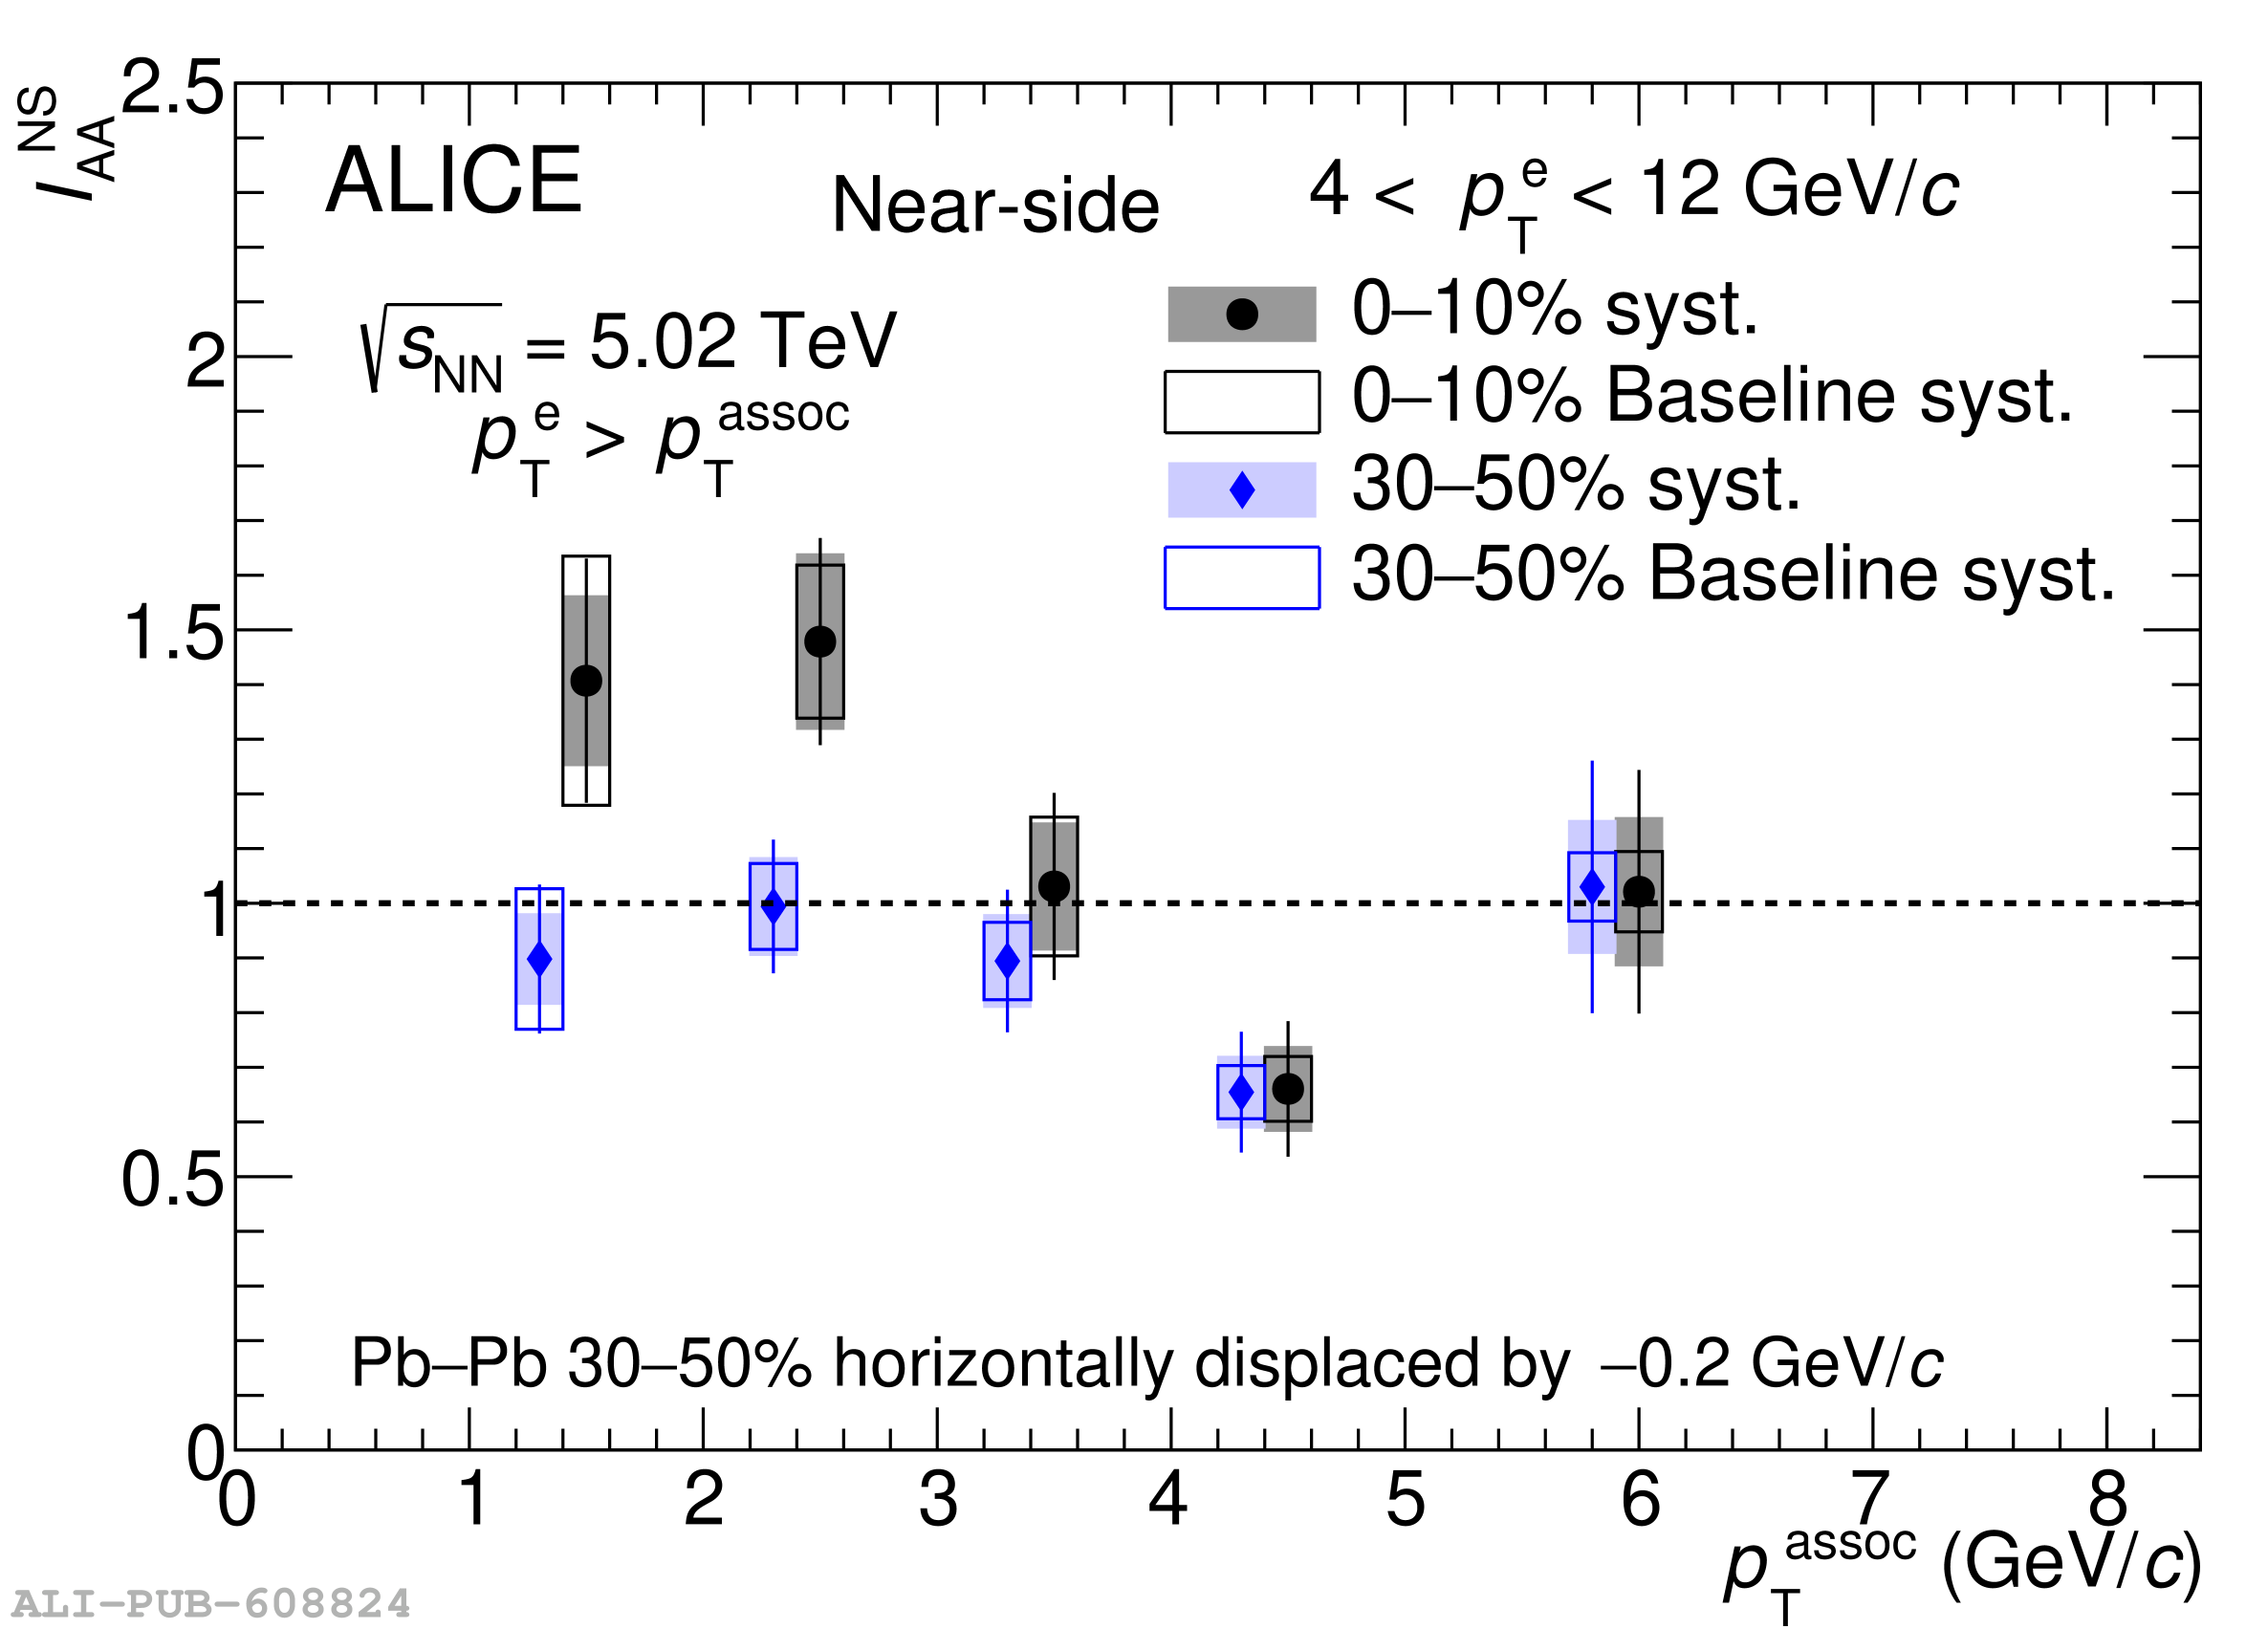 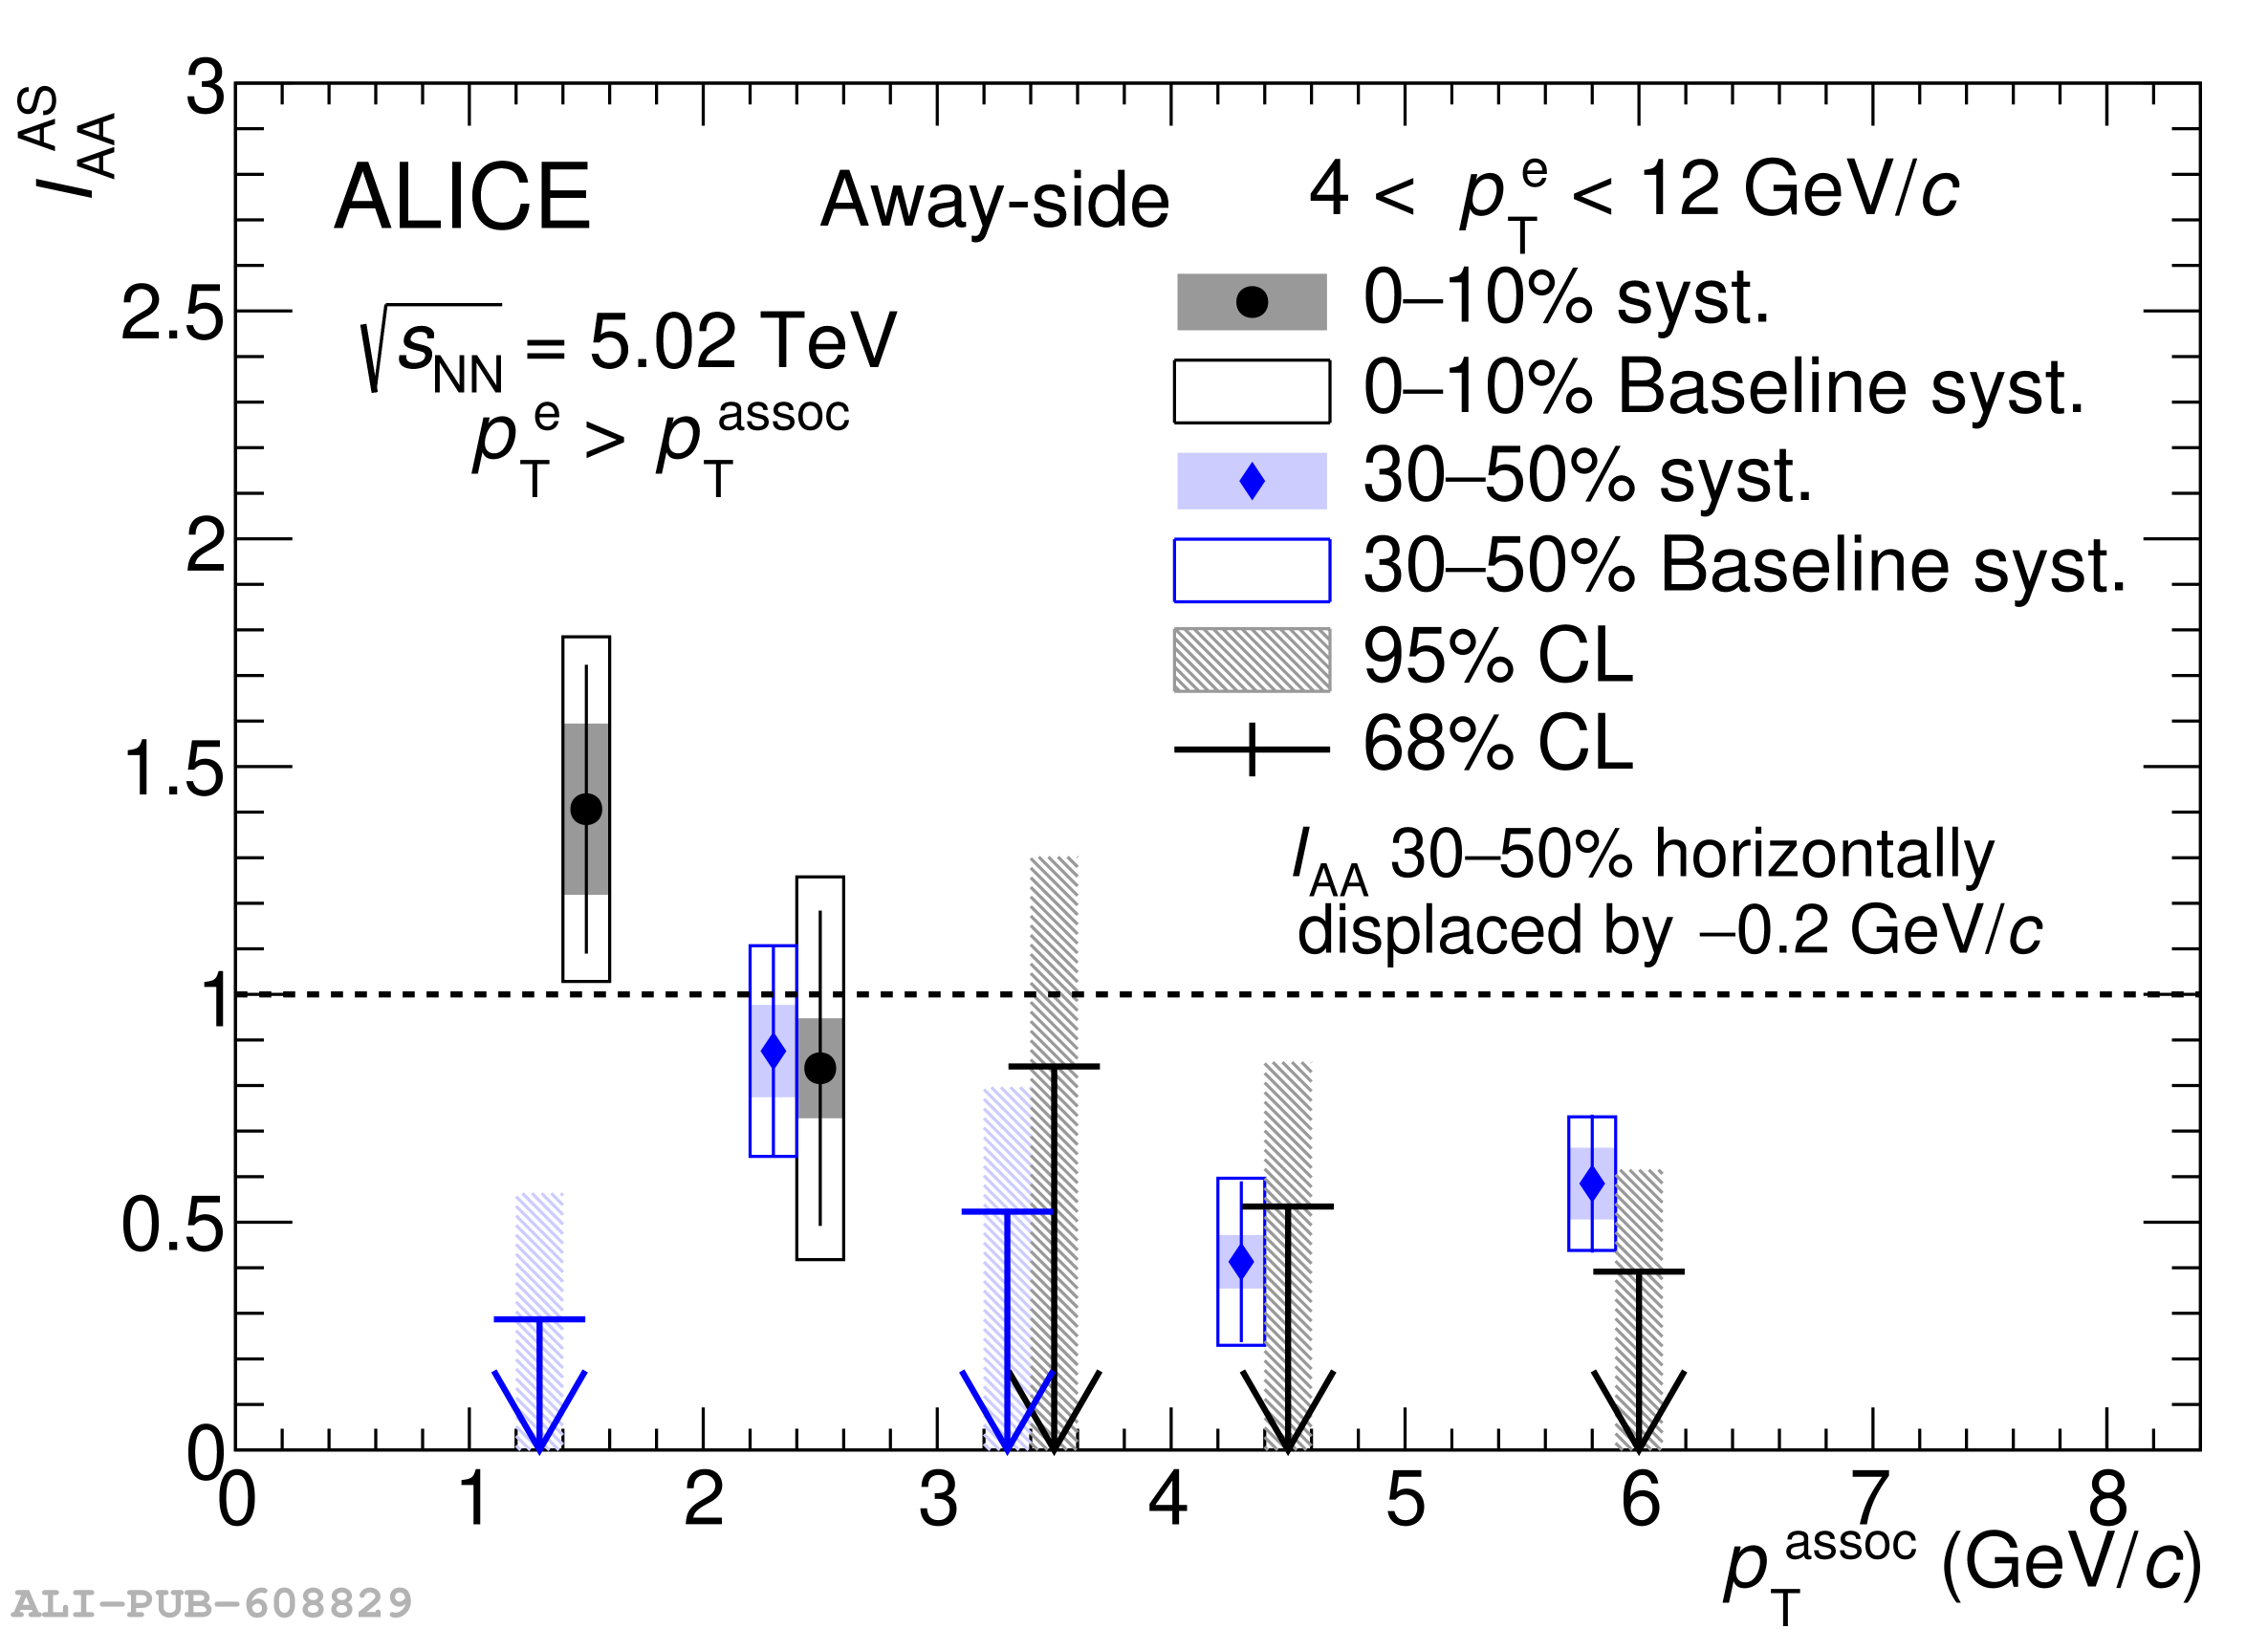 |
Figure 6
Per-trigger NS (left) and AS (right) associated peak yields for electrons from heavy-flavor hadron decays in the intervals $4 \pte 7$ \GeVc and $7 \pte 16$ \GeVc as a function of $\ptassoc$ in central Pb--Pb collisions, compared to measurements in pp collisions . The statistical (systematic) uncertainties are shown as vertical lines (empty boxes). In some $\ptassoc$ intervals the AS yield is consistent with zero within one standard deviation of total uncertainties. For those intervals, upper limits on the yields for 68\% and 95\% confidence levels are shown with arrows and boxes, respectively. | 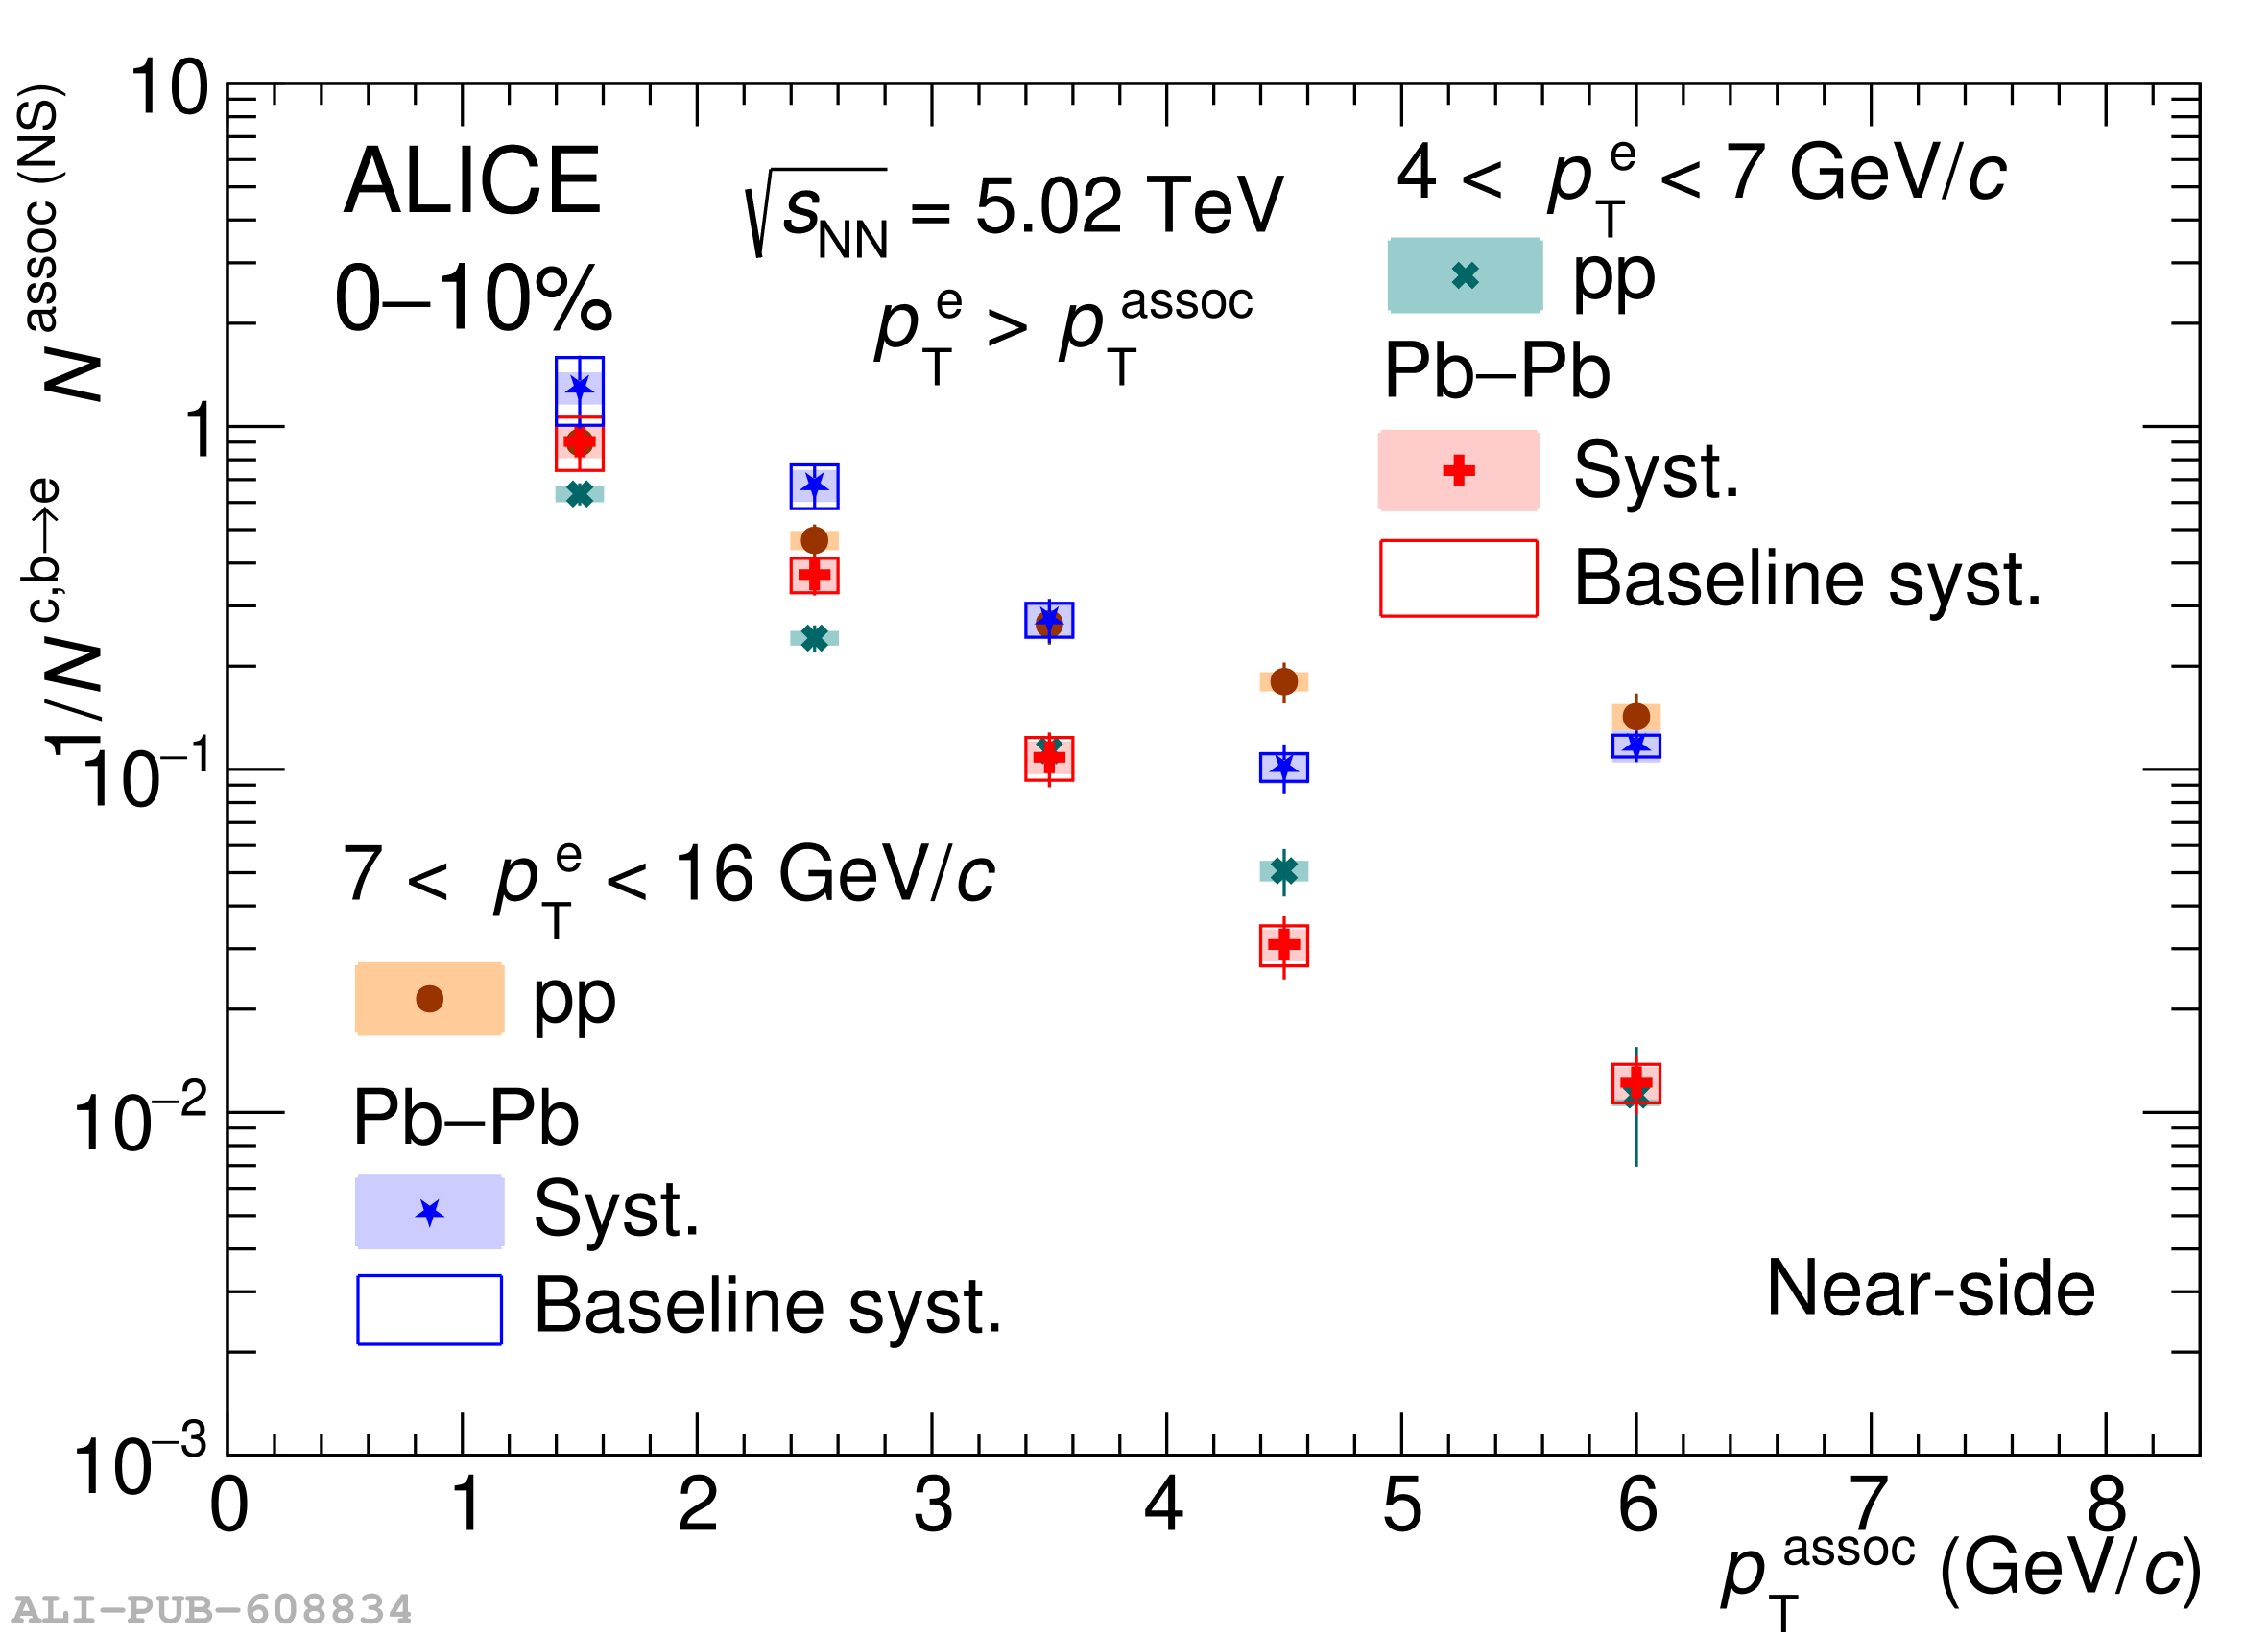 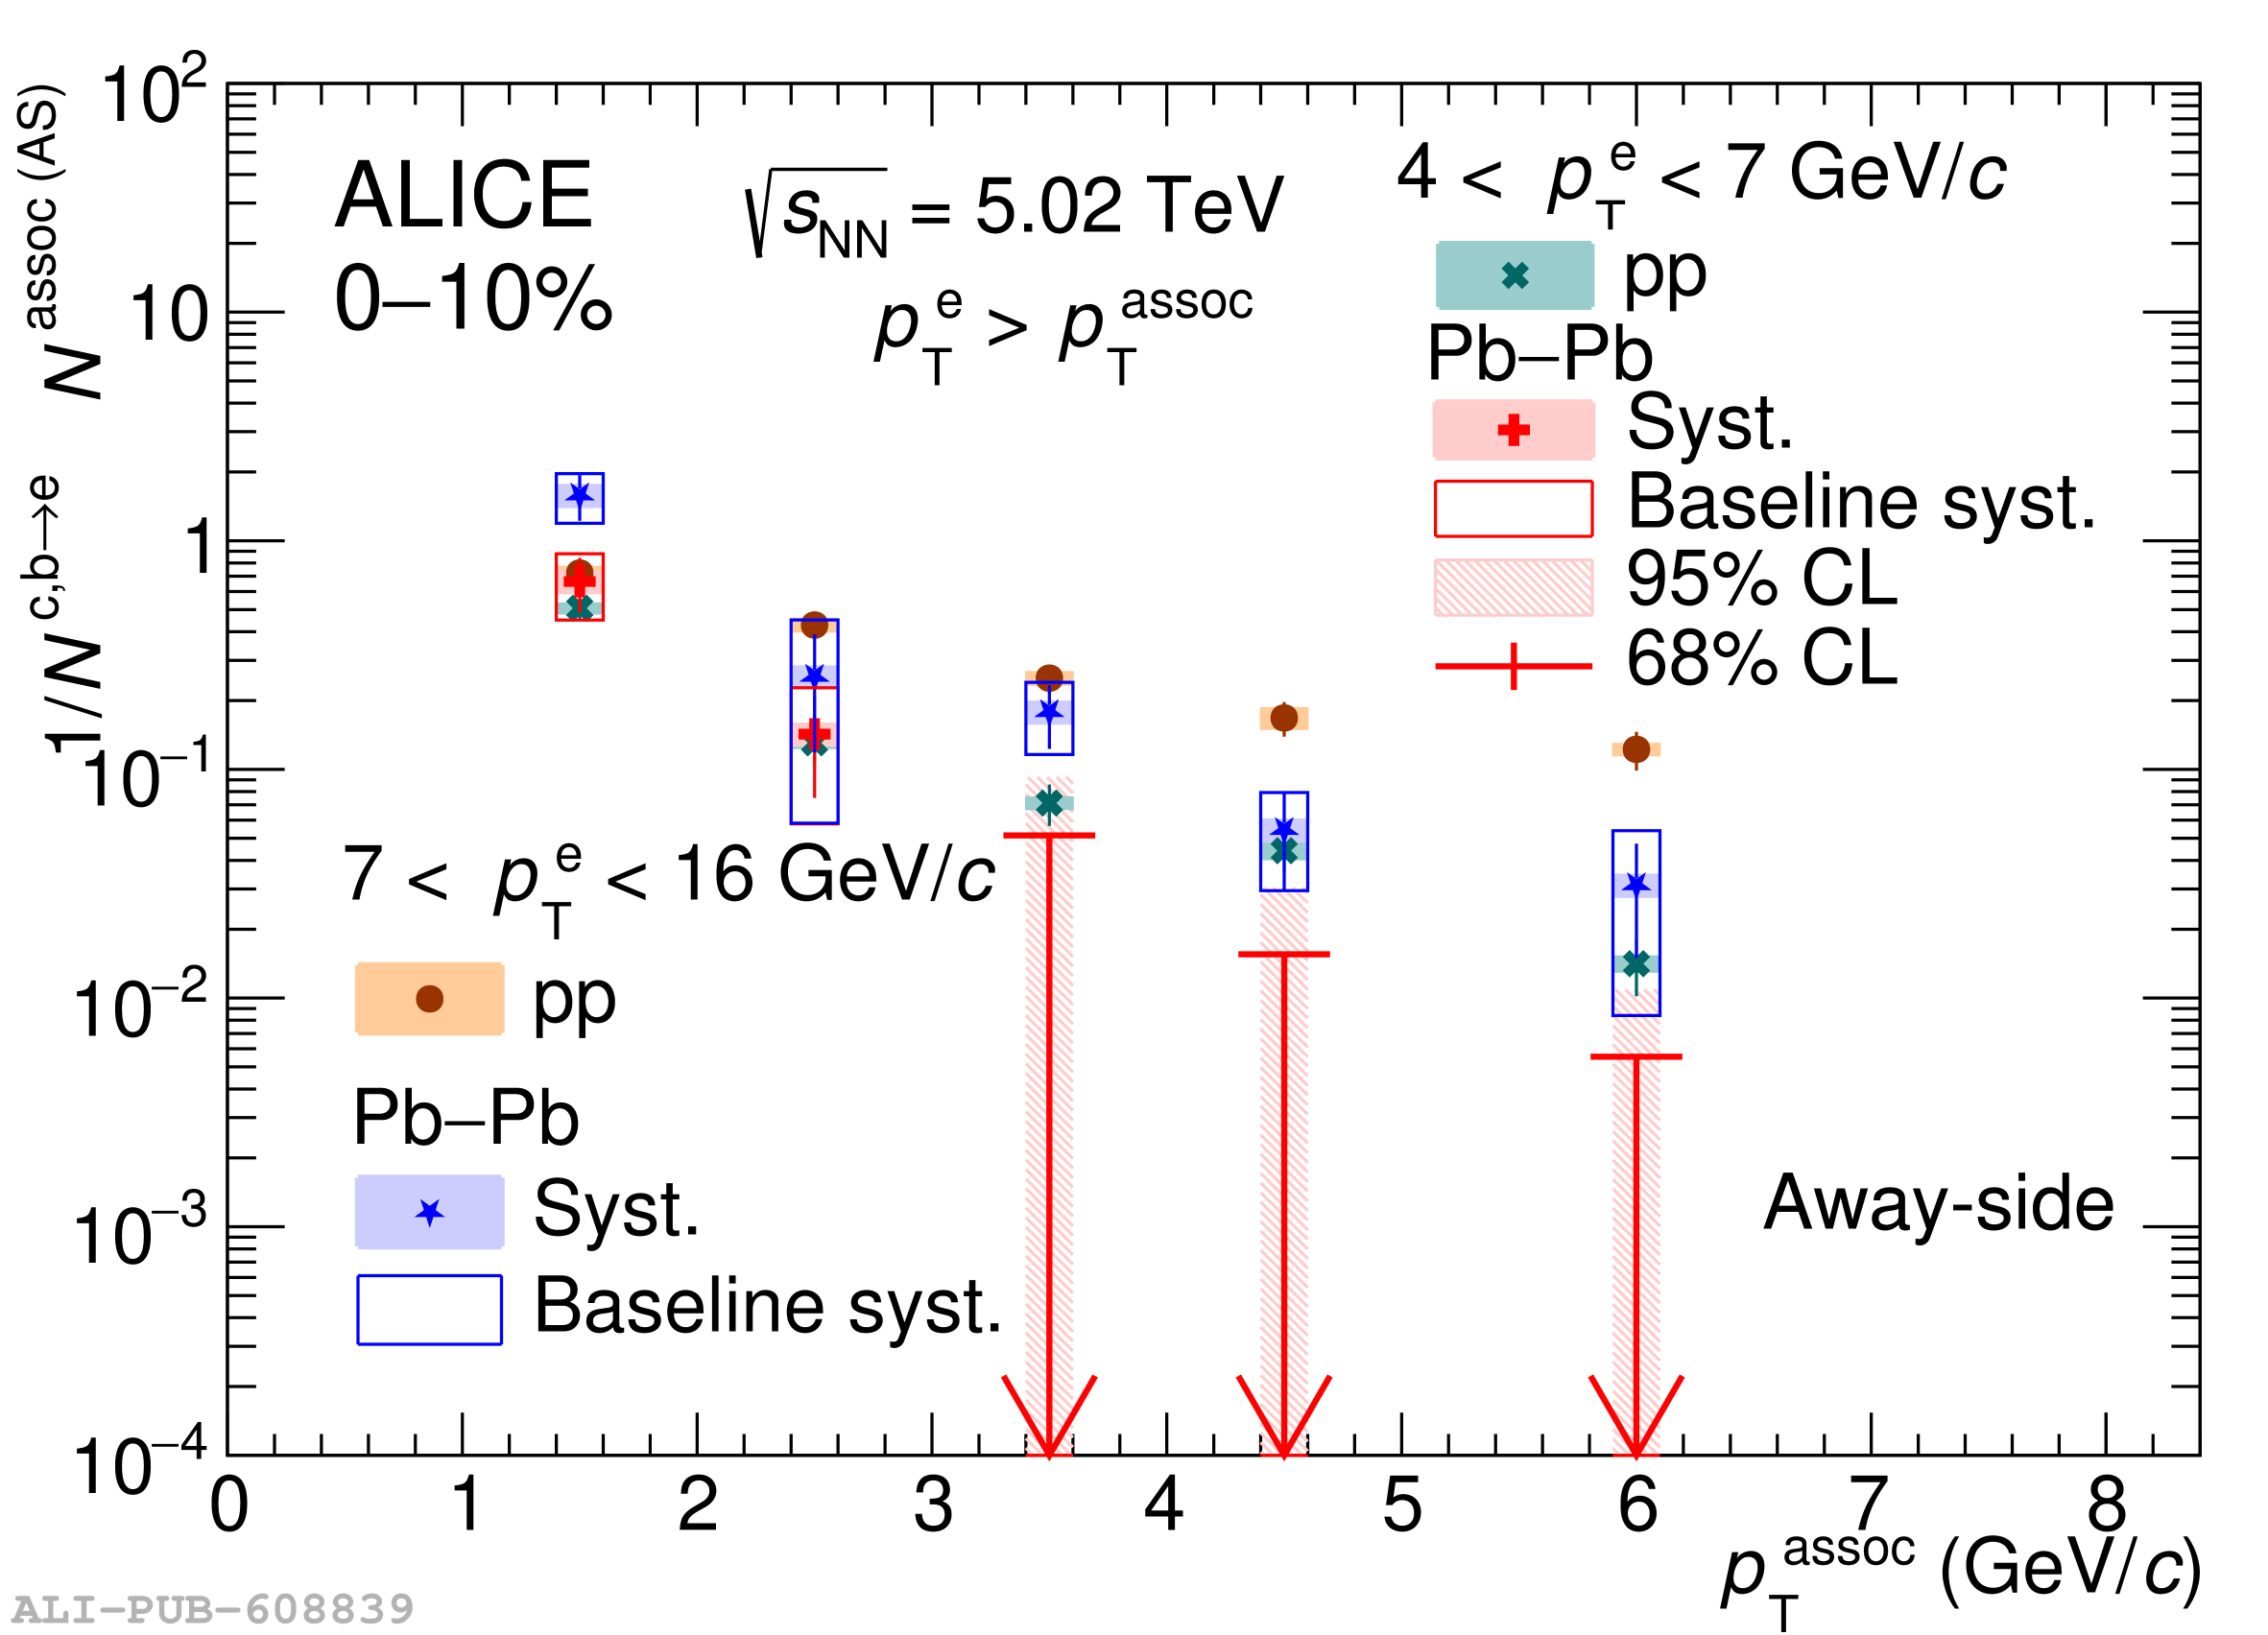 |
Figure 7
Per-trigger nuclear modification factor ($I_{\rm{AA}}$) of the NS (left) and AS (right) associated peak yields for electrons from heavy-flavor hadron decays in intervals $4 \pt^{\rm{e}} 7$ \GeVc compared to $7 \pt^{\rm{e}} 16$ \GeVc as a function of $\pt^{\rm{assoc}}$ in central Pb--Pb collisions. The statistical (systematic) uncertainties are shown as vertical lines (empty boxes). In some $\pt^{\rm{assoc}}$ intervals the AS yield is consistent with zero within one standard deviation of total uncertainty. For those intervals, upper limits on the $I_{\rm{AA}}$ for 68\% and 95\% confidence levels are shown with arrows and boxes, respectively. | 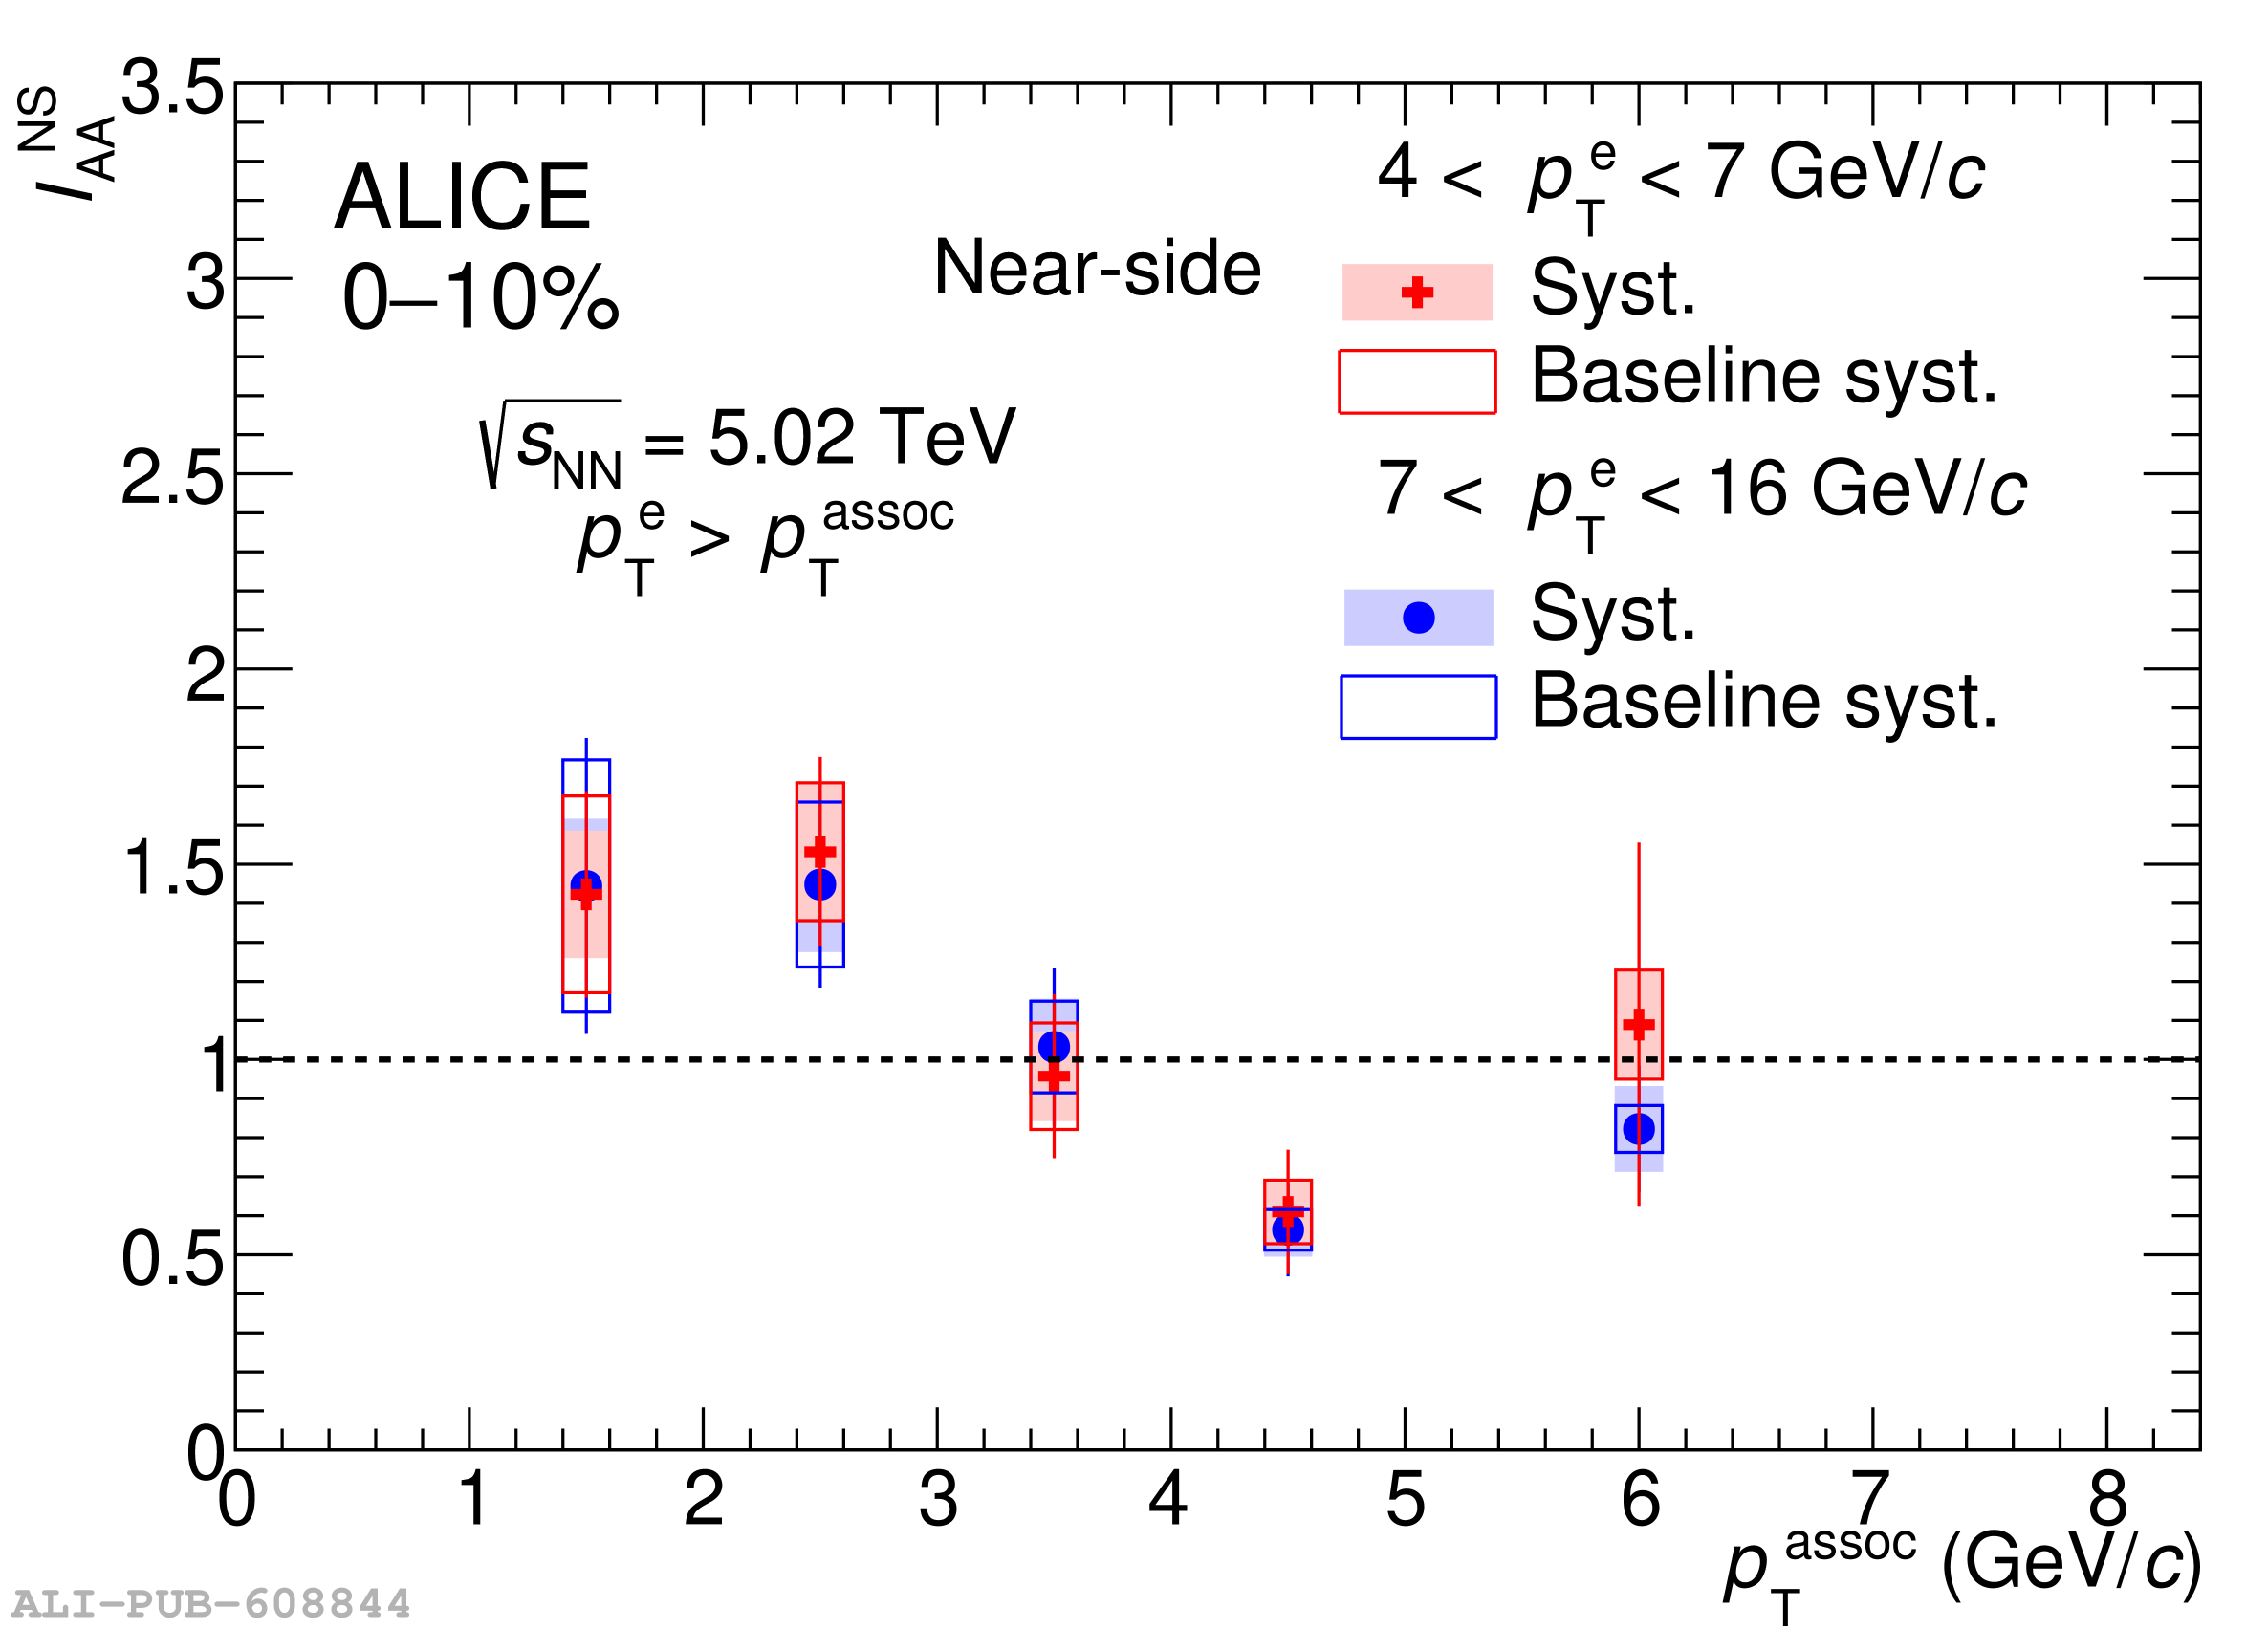  |
Figure 8
$I_{\rm{AA}}$ of NS (left) and AS (right) associated peak yield from correlation distributions of electron from heavy-flavor hadron decays as the trigger particle ($7 p_\text{T}^\text{e} 16$ \GeVc) compared with that of charged hadrons and $\mathrm{K}^{0}_\mathrm{S}$ as trigger particles ($8 \pt^{\rm{trig}} 16$ \GeVc ). | 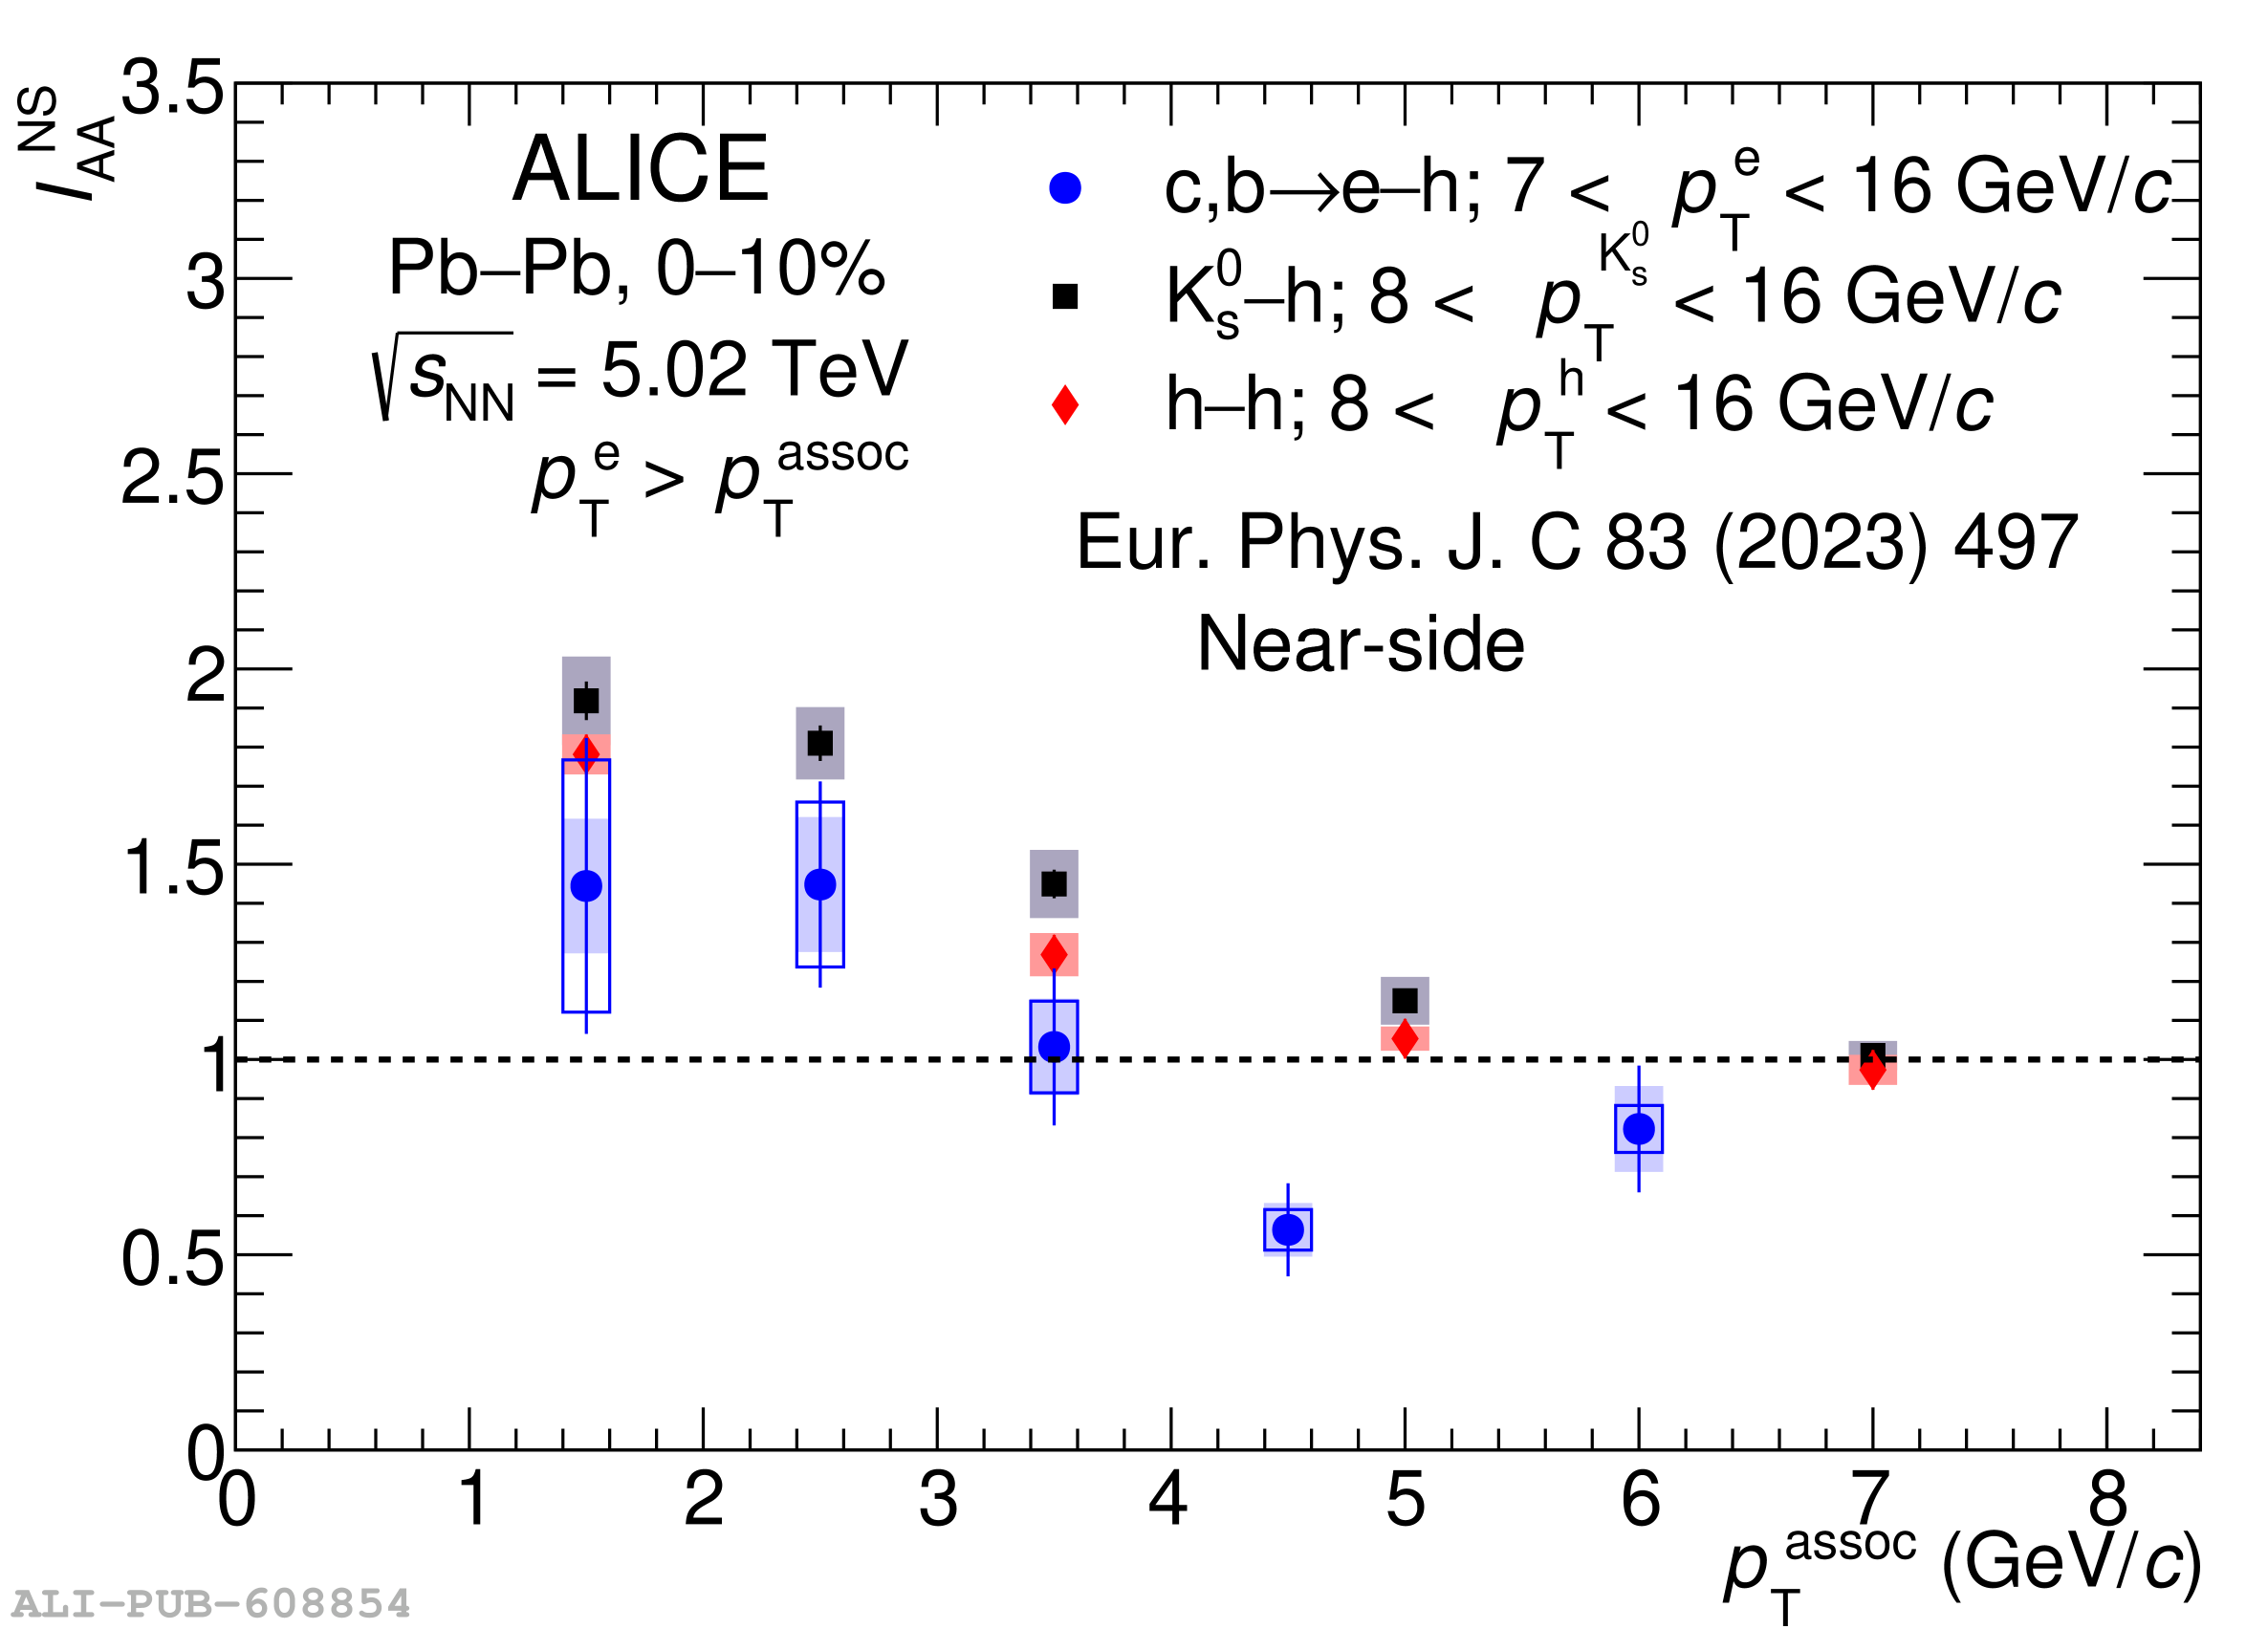 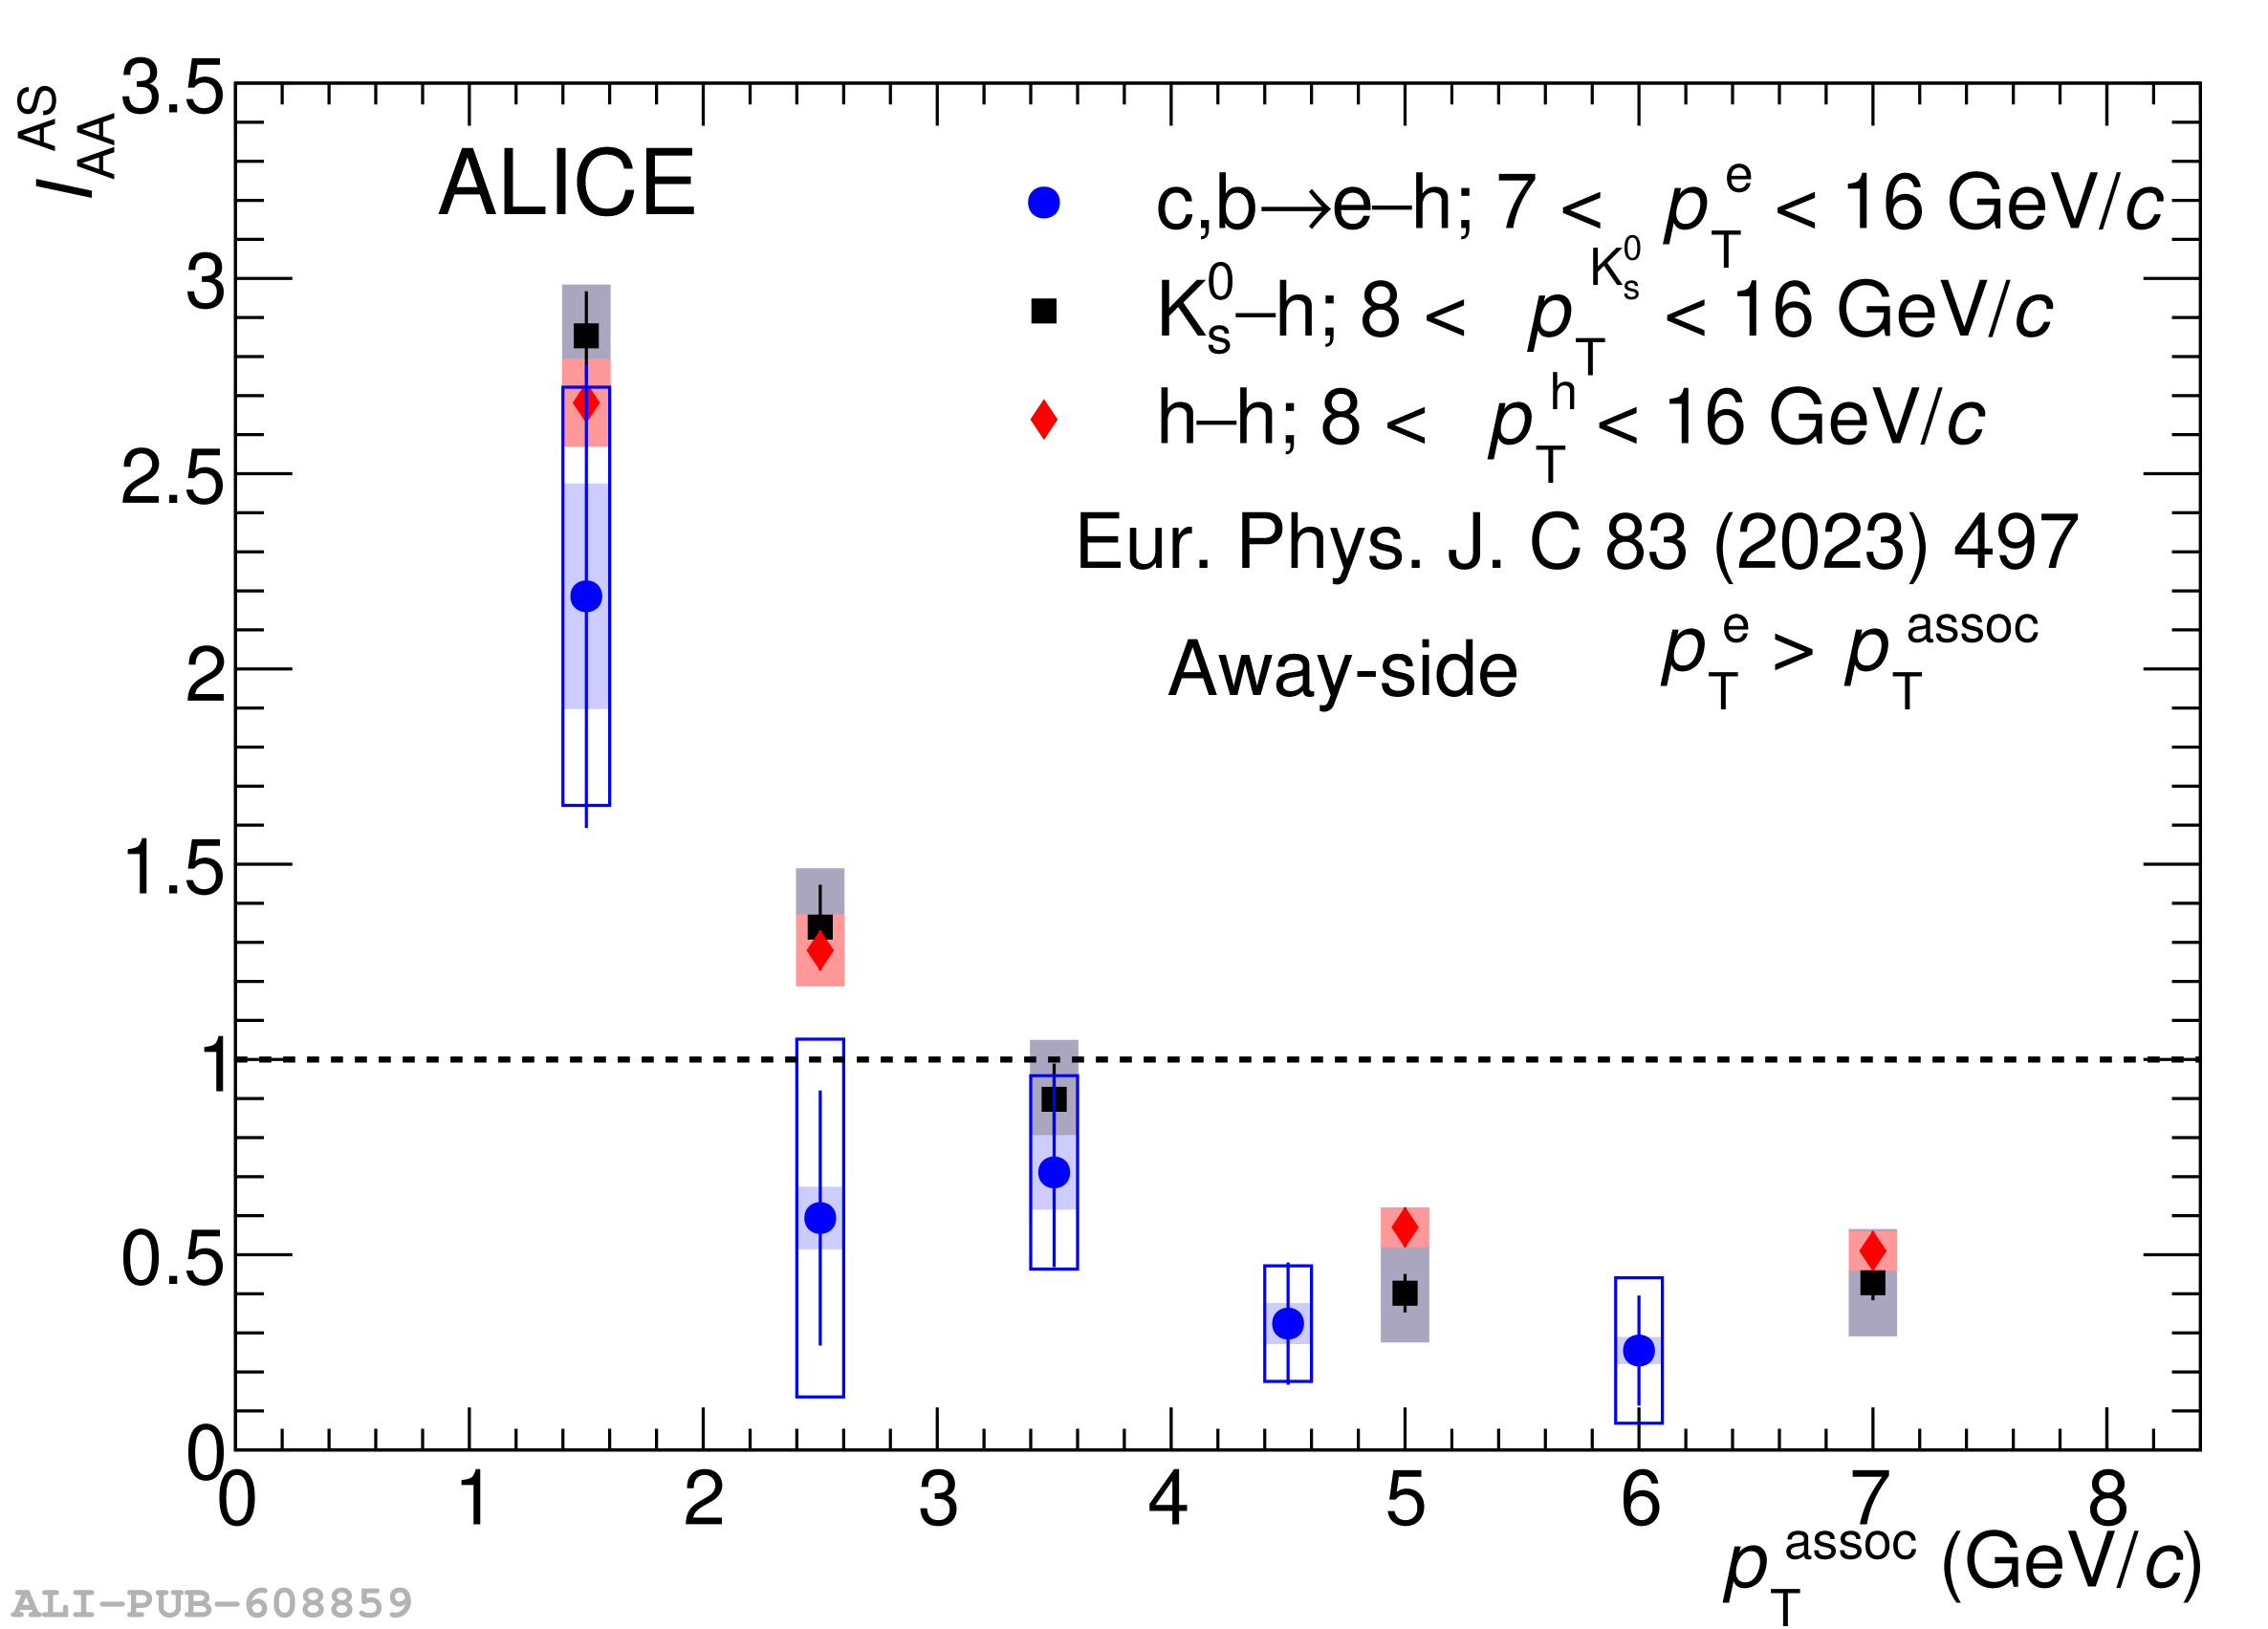 |
Figure A.1
Azimuthal-correlation distribution of electrons from heavy-flavor hadron decays and charged particles measured in 0--10\% central Pb--Pb collisions before background subtraction. The distributions are shown in the trigger range of $4 p_\mathrm{T}^\mathrm{e} 12$ \gevc and all $p_\mathrm{T}^\mathrm{assoc}$ intervals, where $1 - 2$, $2 - 3$, and $5 - 7$ GeV/$c$ are shown in Fig. \ref{fig:DeltaPhiPbPb}. | 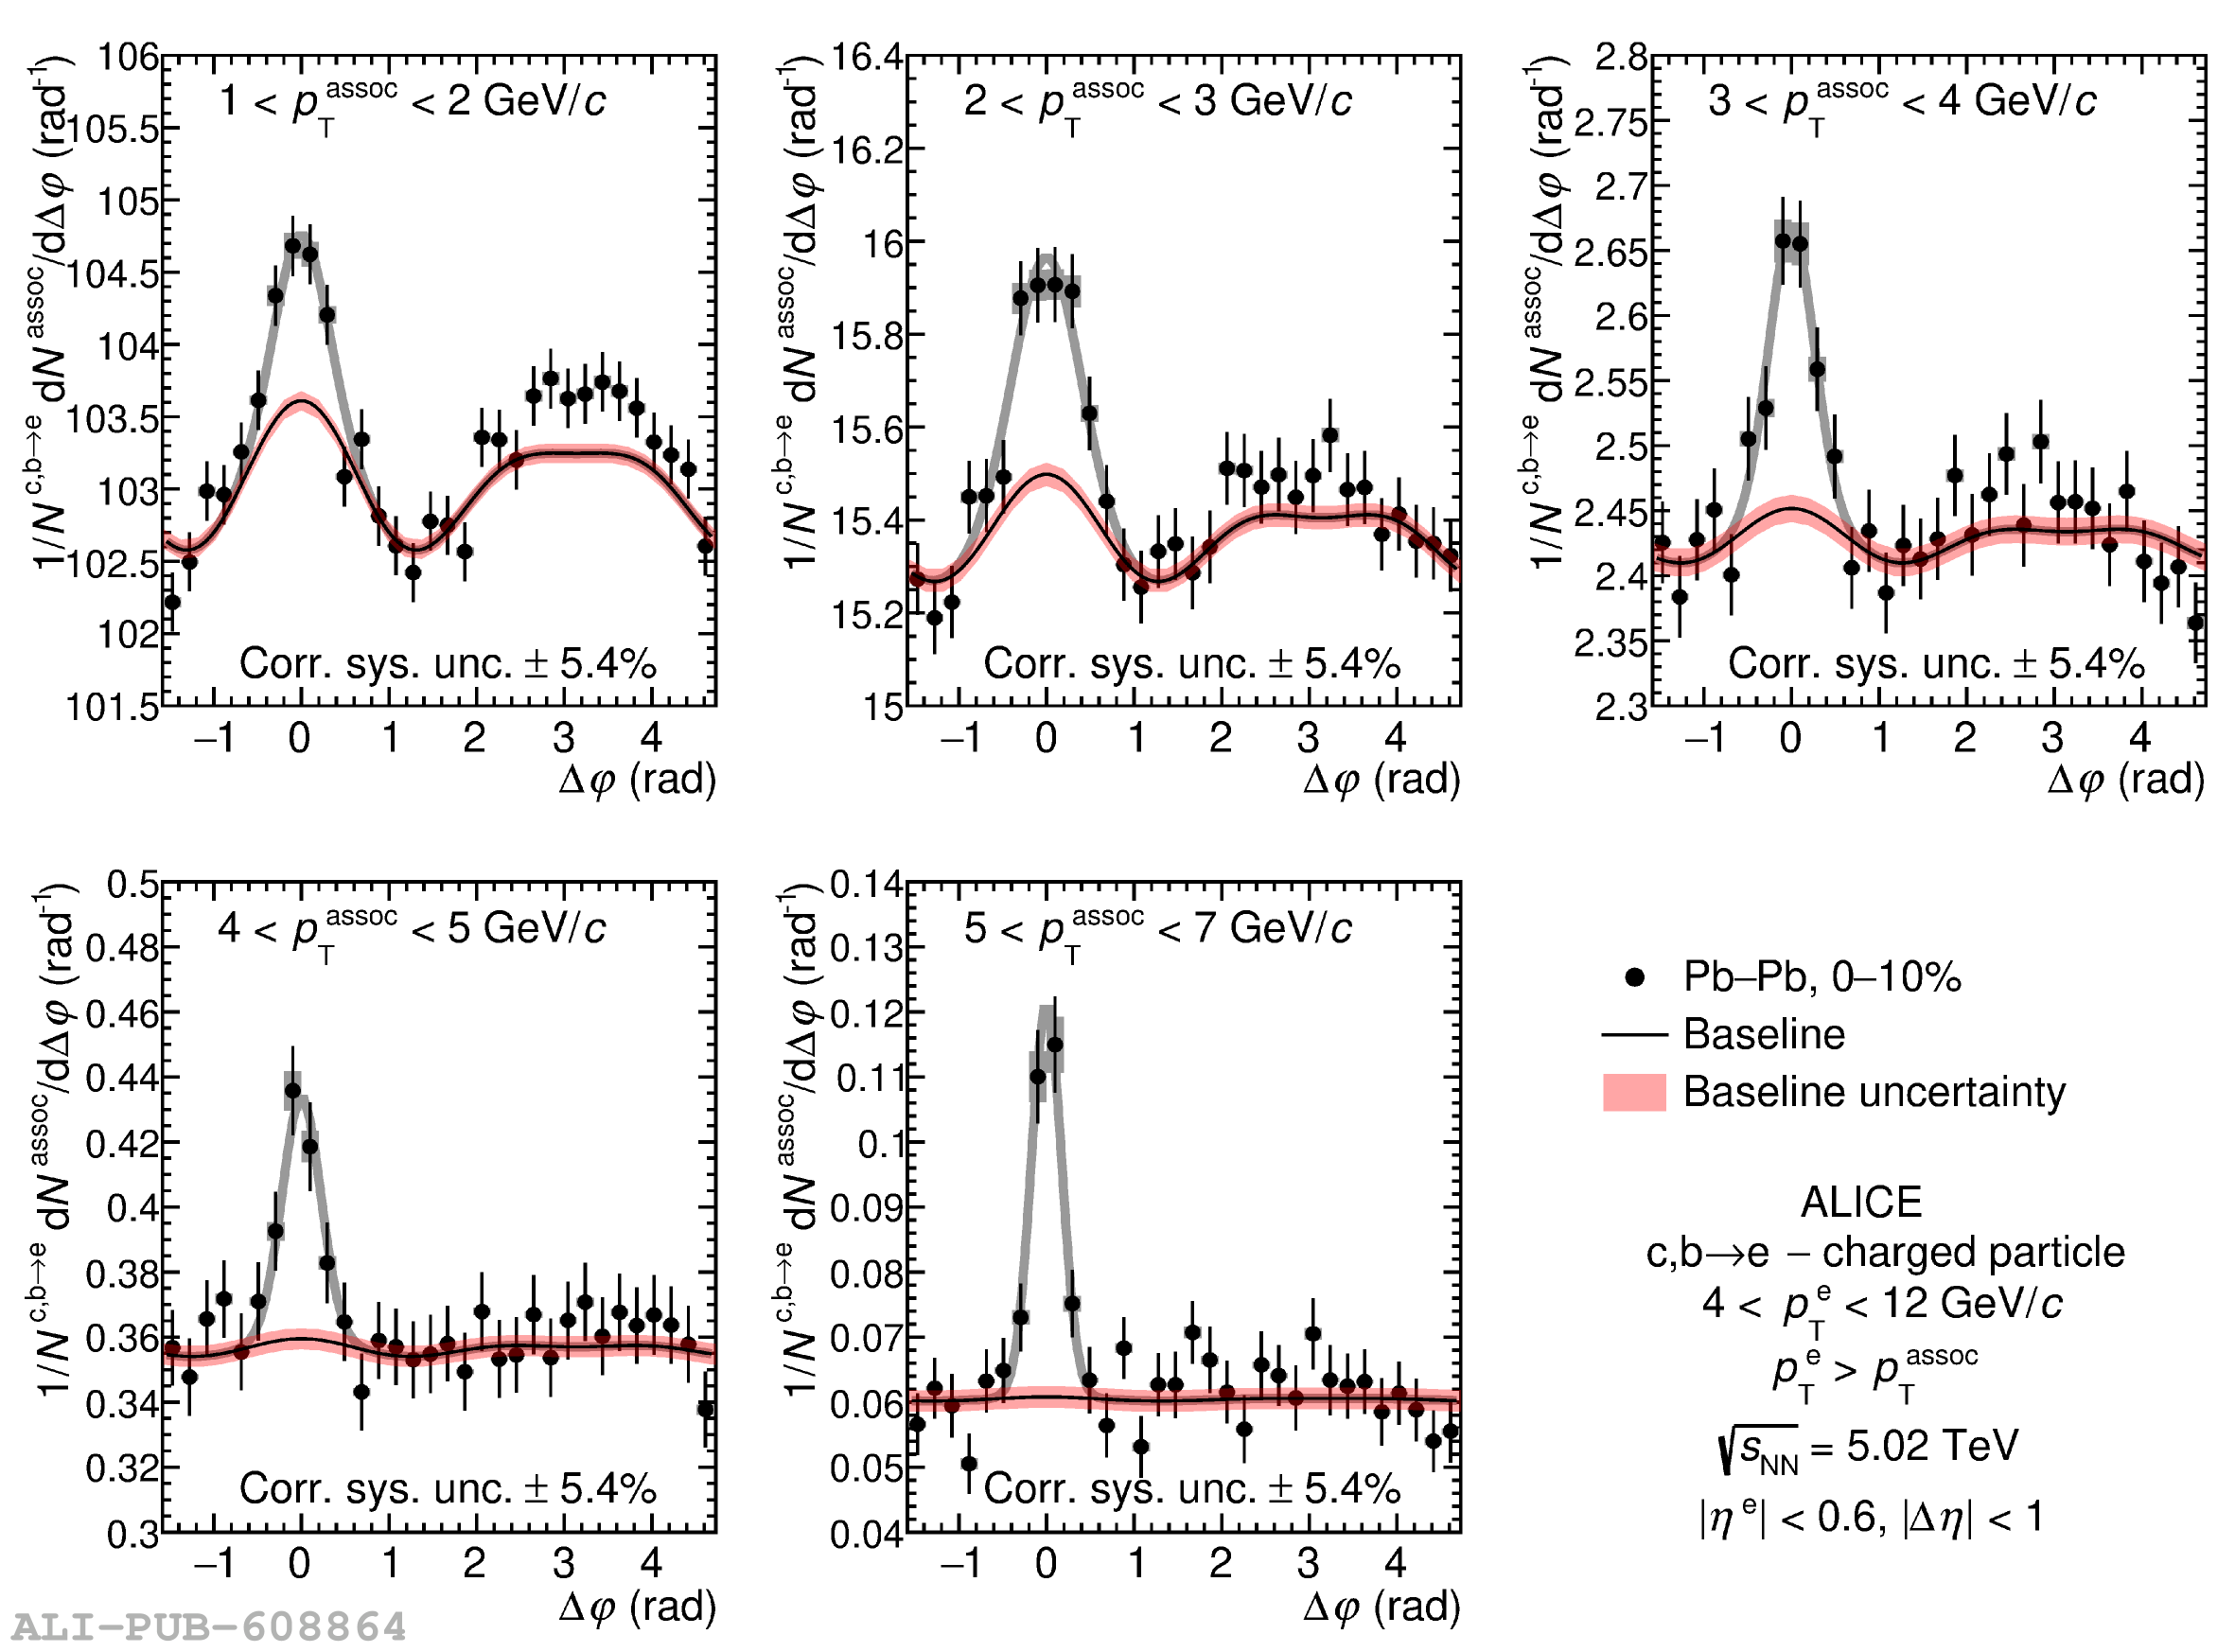 |
Figure A.2
Azimuthal-correlation distribution of electrons from heavy-flavor hadron decays and charged particles measured in 30--50\% central Pb--Pb collisions before background subtraction. The distributions are shown in the trigger range of $4 p_\mathrm{T}^\mathrm{e} 12$ \gevc and all $p_\mathrm{T}^\mathrm{assoc}$ intervals, where $1 - 2$, $2 - 3$, and $5 - 7$ GeV/$c$ are shown in Fig. \ref{fig:DeltaPhiPbPb}. | 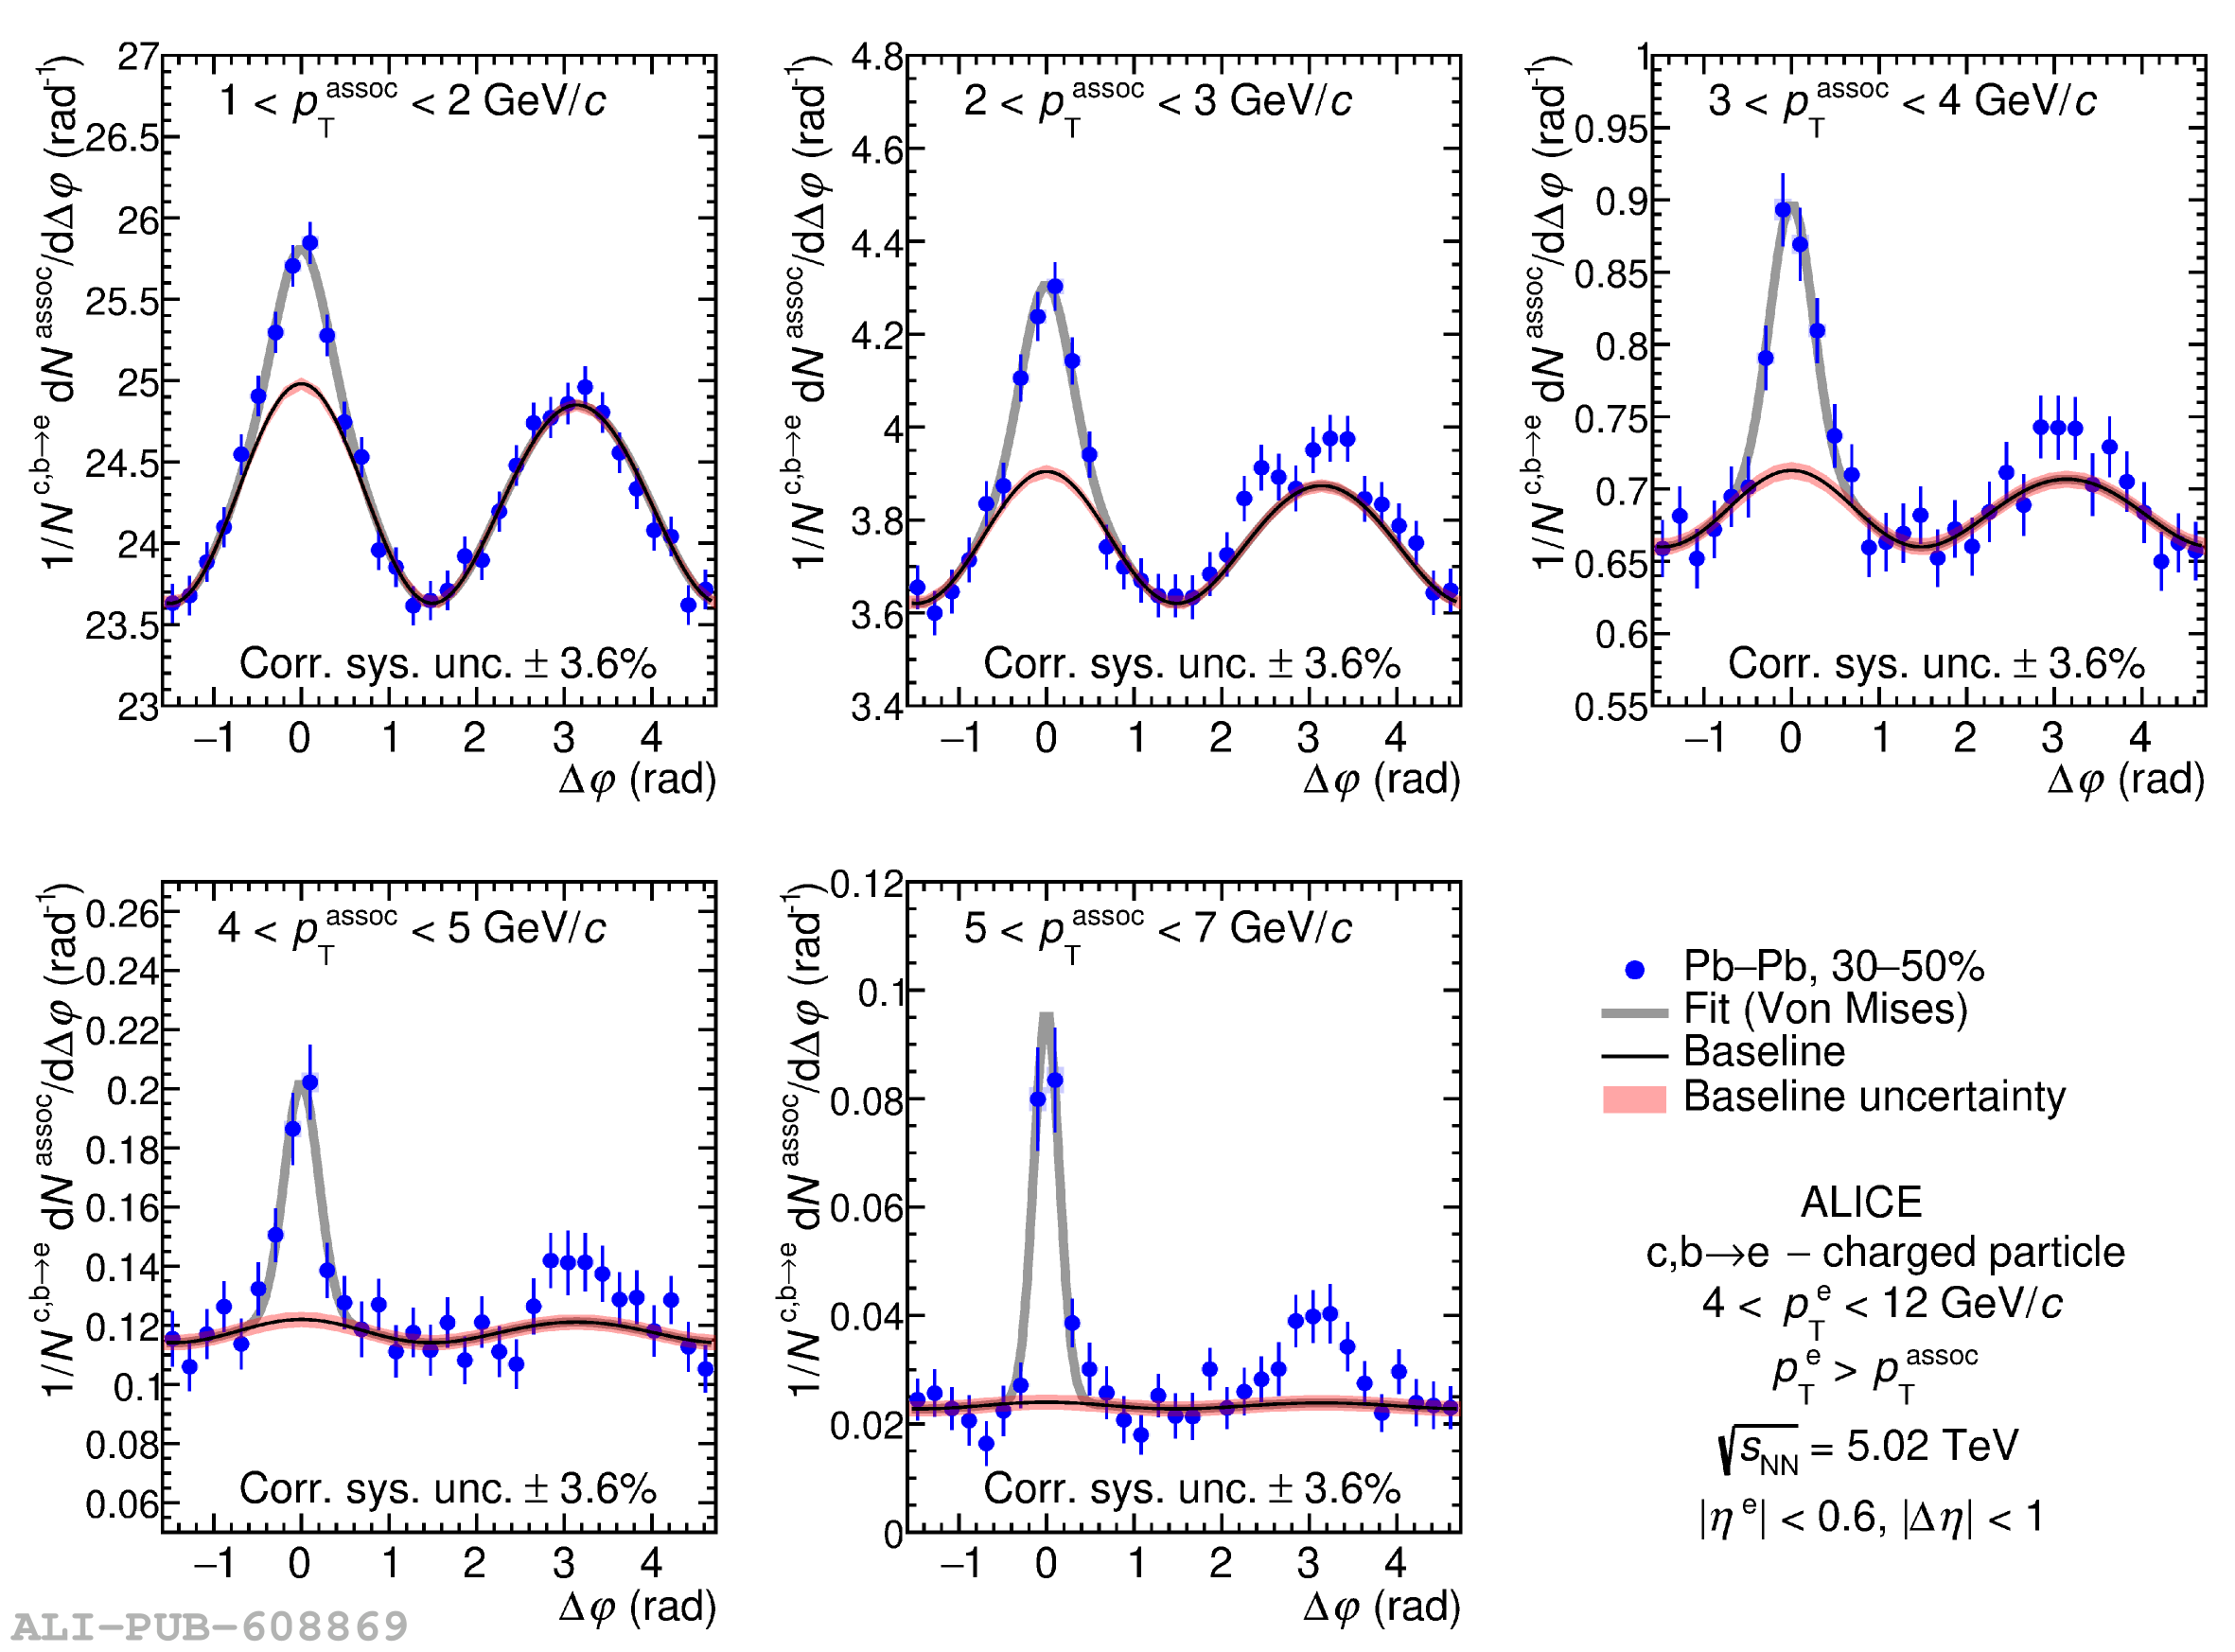 |