Nominal versus measured displacements in the horizontal (left) and vertical (right) length-scale calibration scans, obtained from events with reconstructed-track multiplicity ranging from 260 to 500. Data are represented by symbols, while a linear fit is represented by the solid lines. The uncertainties are smaller than the symbol sizes. The fit residuals are shown in the lower panel. The blue (green, red) lines and solid circles (triangles, squares) correspond to a nominal displacement step size of 21.06 $\mu$m (32.43 $\mu$m, 42.16 $\mu$m). | 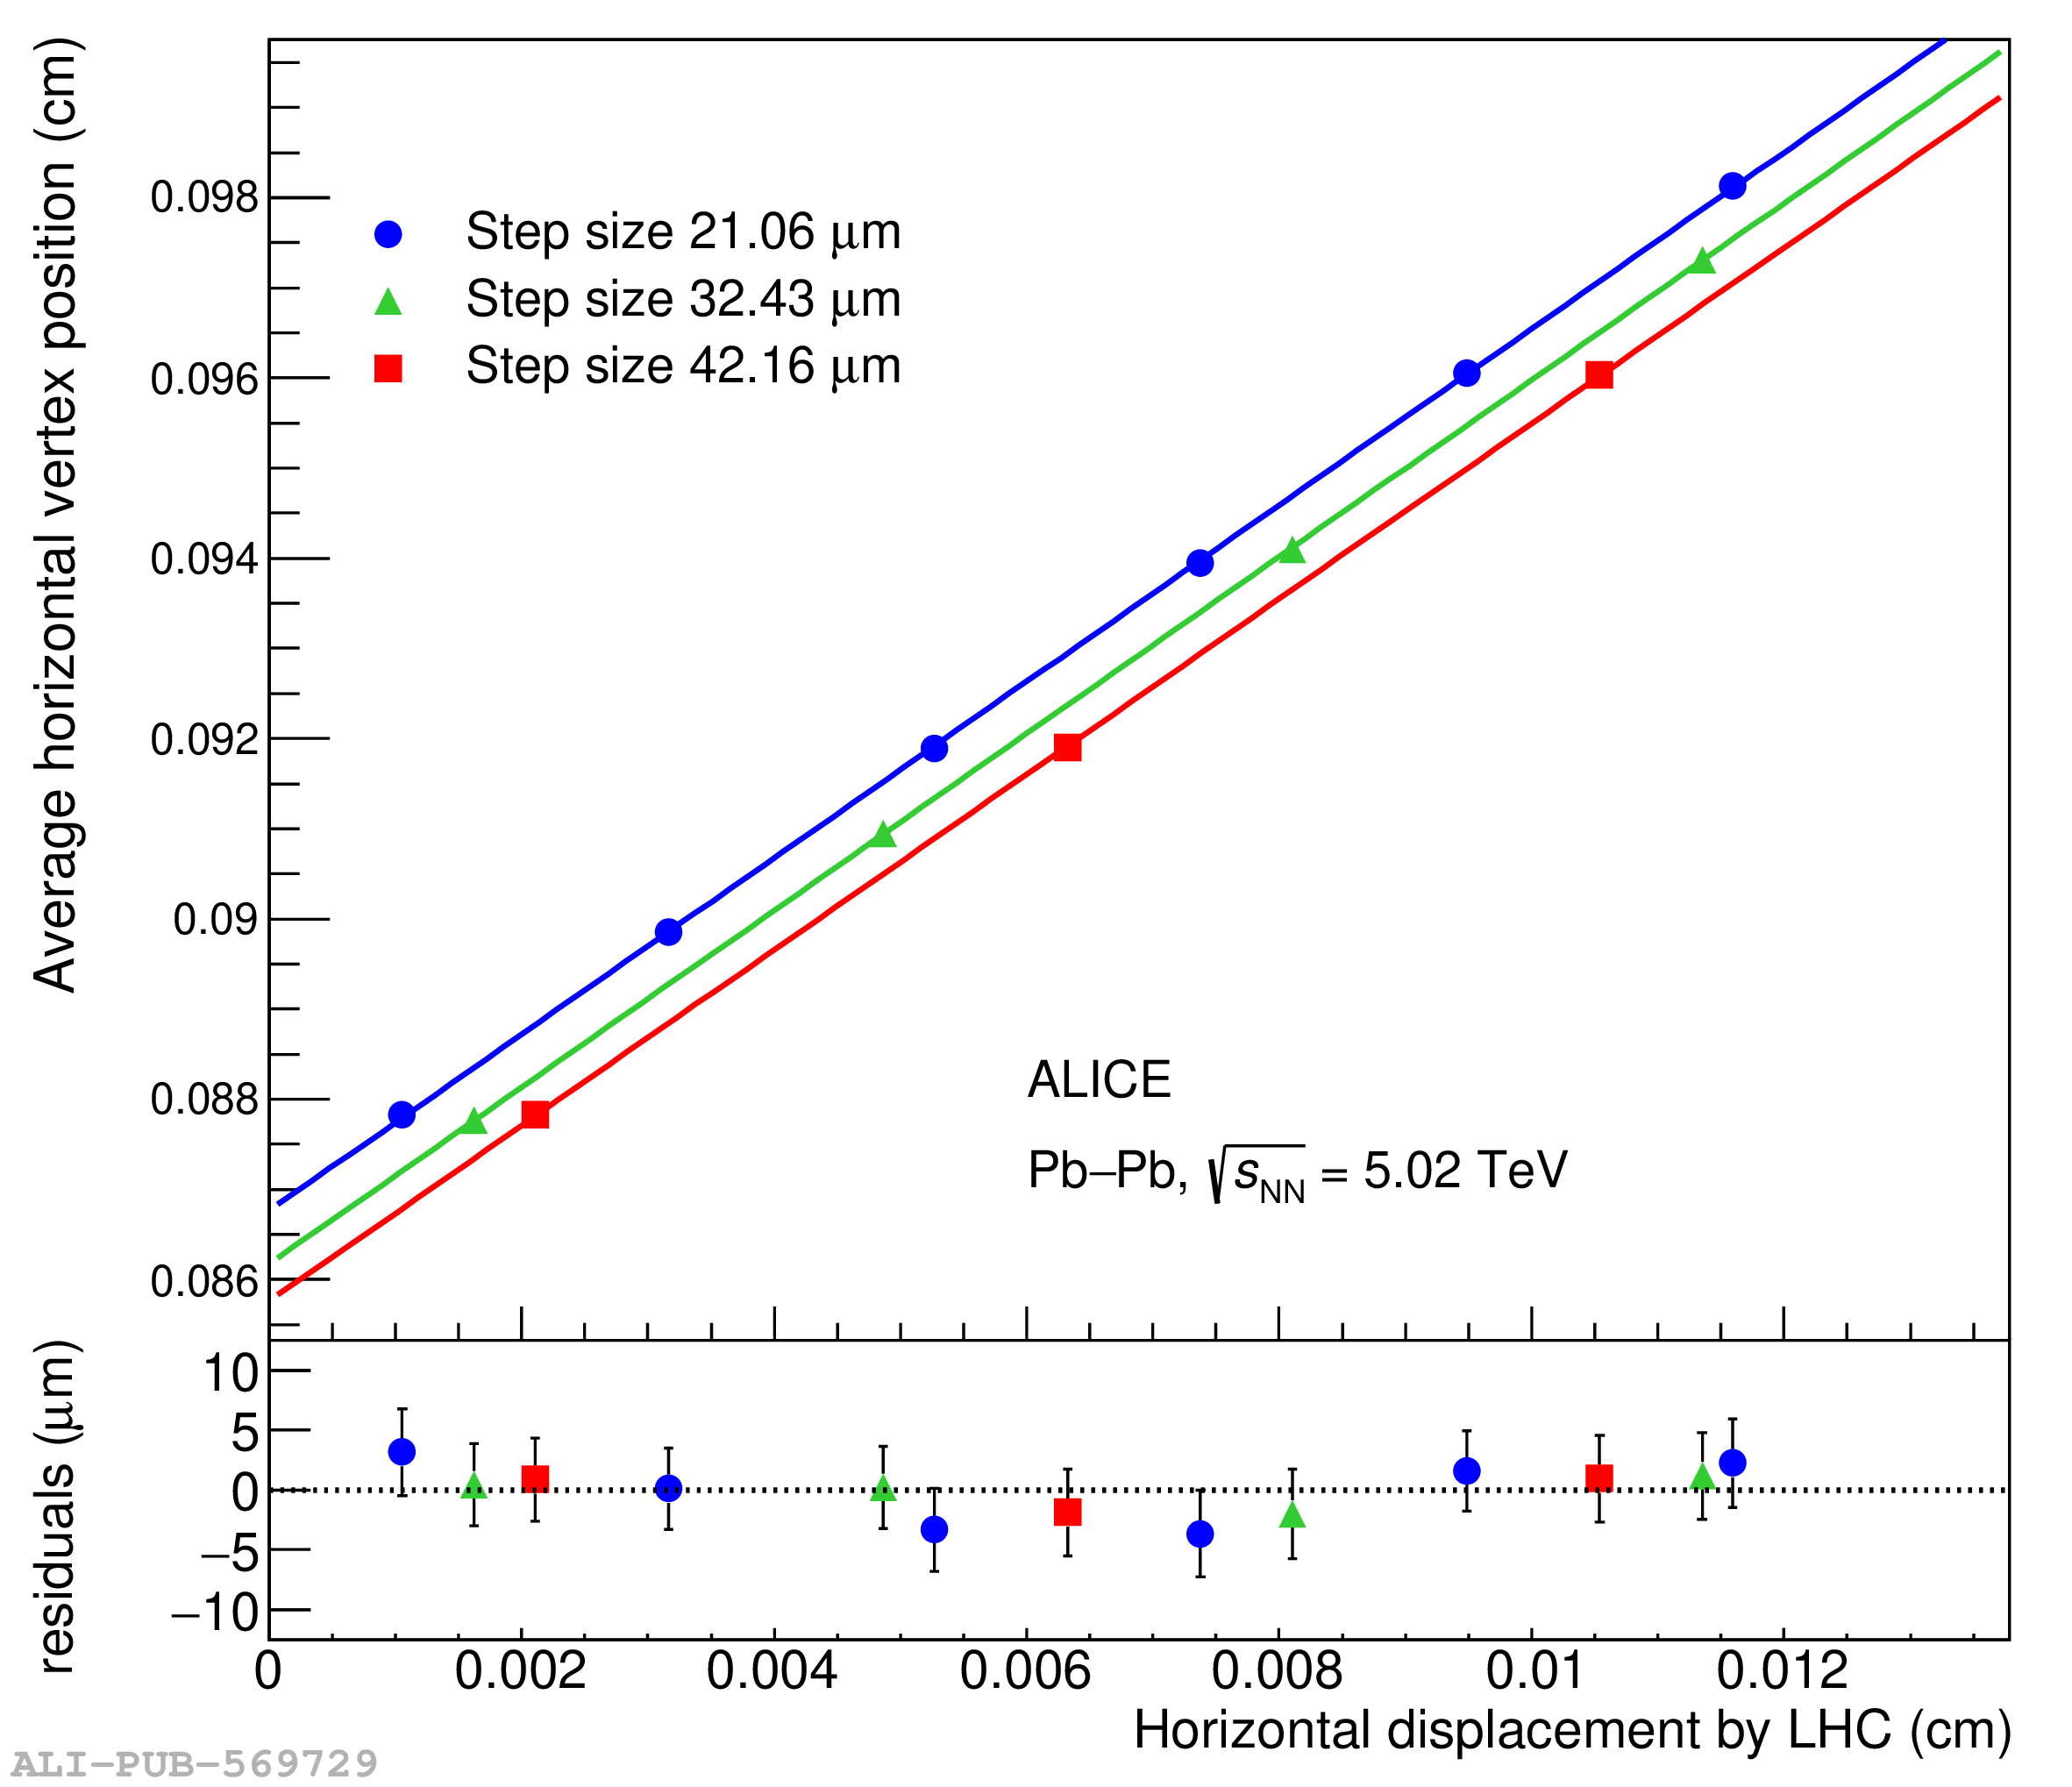 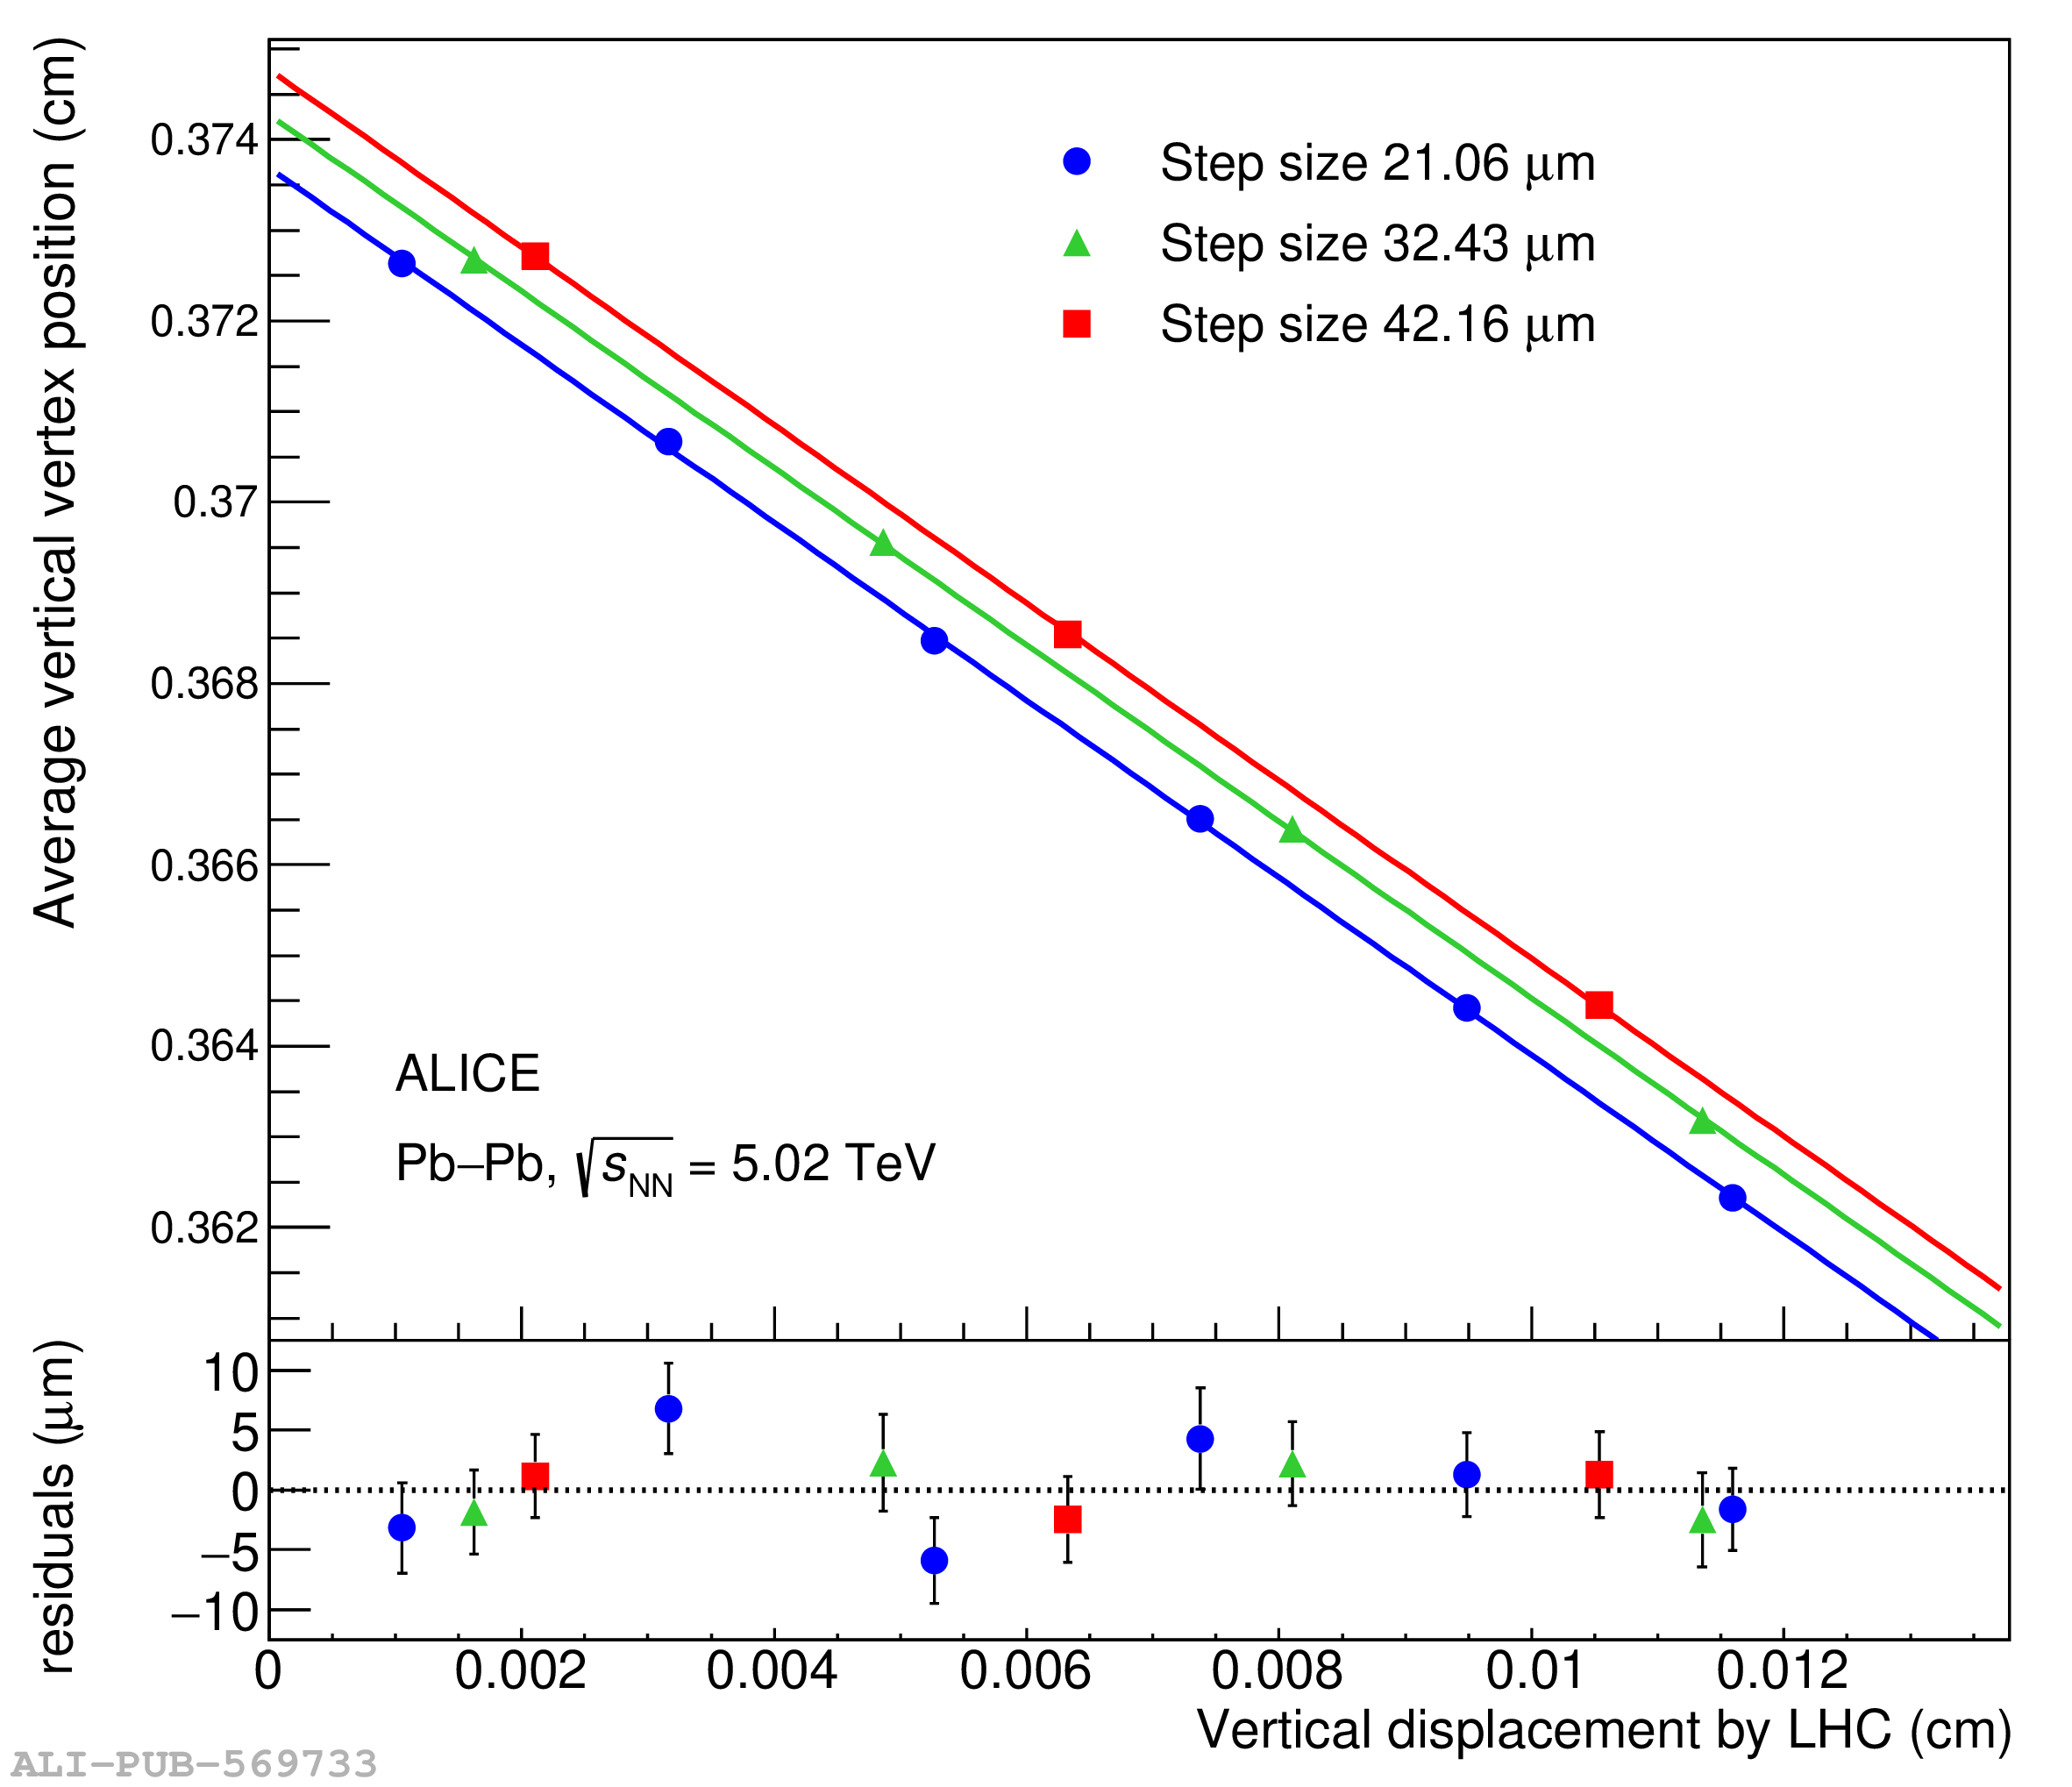 |