Left: correlationbetween the arrival times, relative to main--main collisions, of signals in ZNA and ZNC for events triggered by V0M. The square box depicts the satellite-collision rejection cut discussed in the text. Events outside the box are from main--satellite collisions (horizontal and vertical bands) and from satellite--satellite collisions (diagonal band) Right: distribution of the arrival time, relative to main-main collisions, in one of the two neutron calorimeters for ZED-triggered single-side neutron events. The superimposed curve shows a fit with a sum of Gaussian distributions. Both figures are for head-on collisions ($\Delta x=\Delta y=0$). | 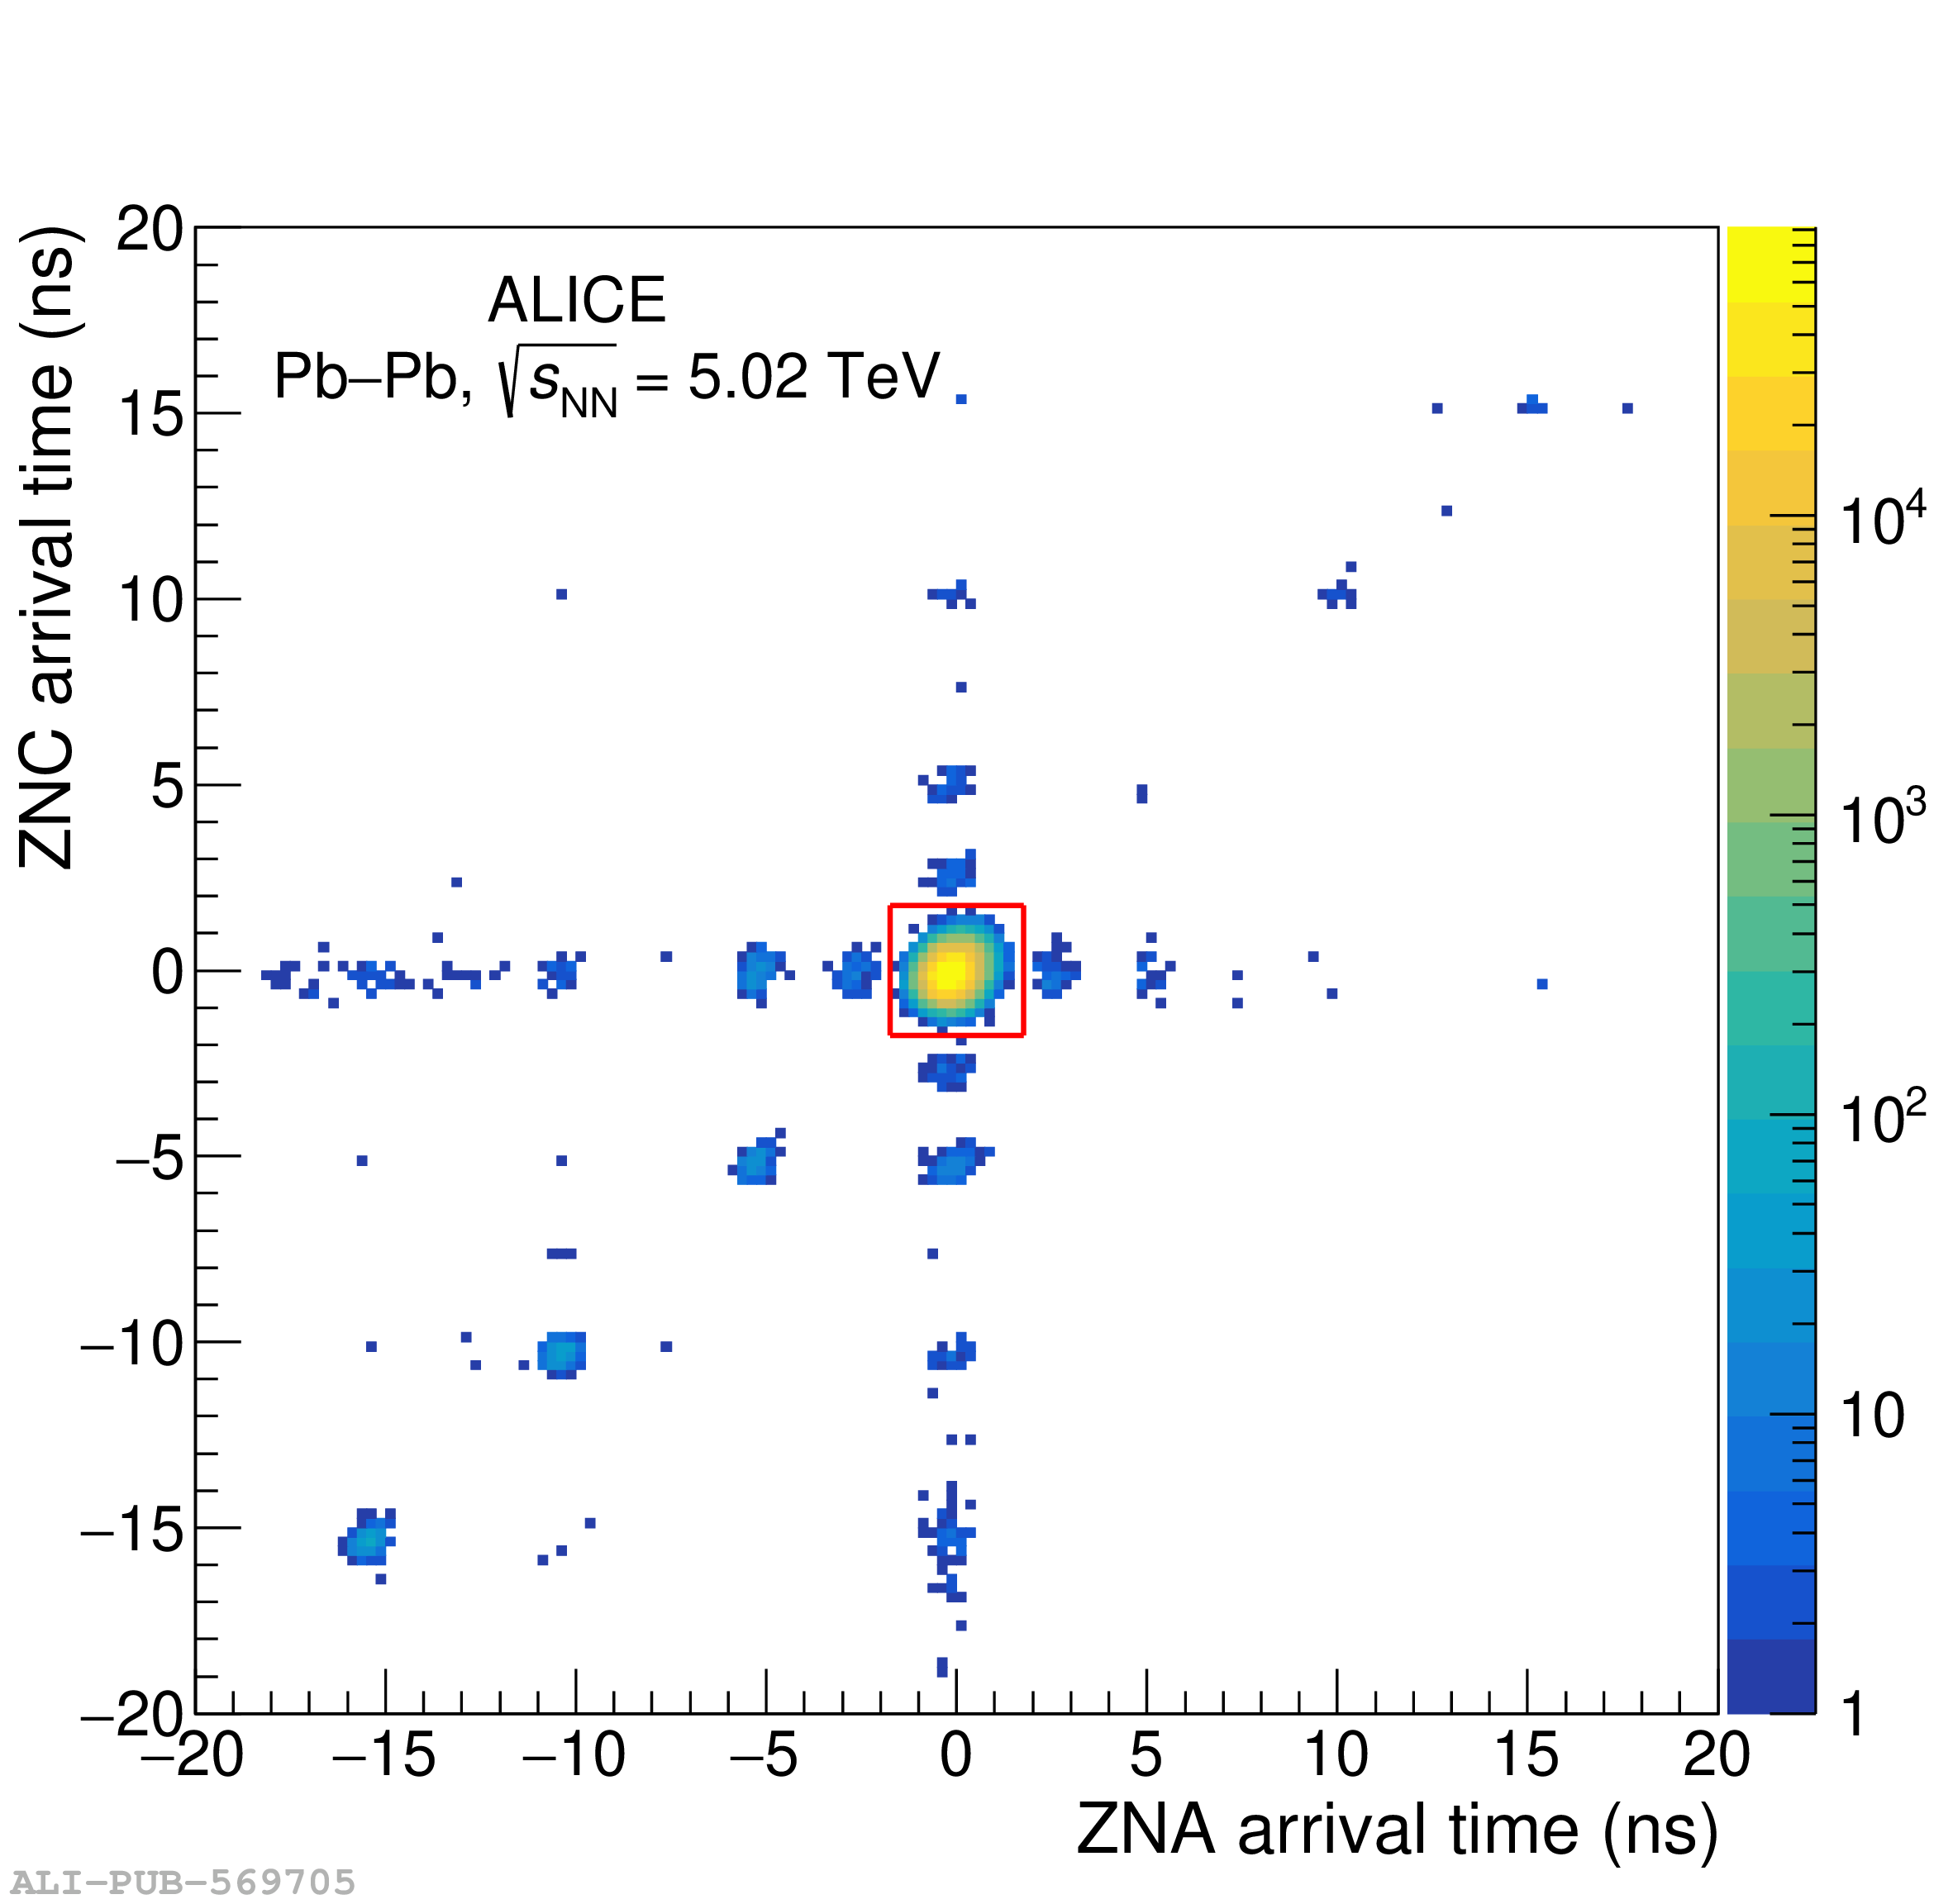 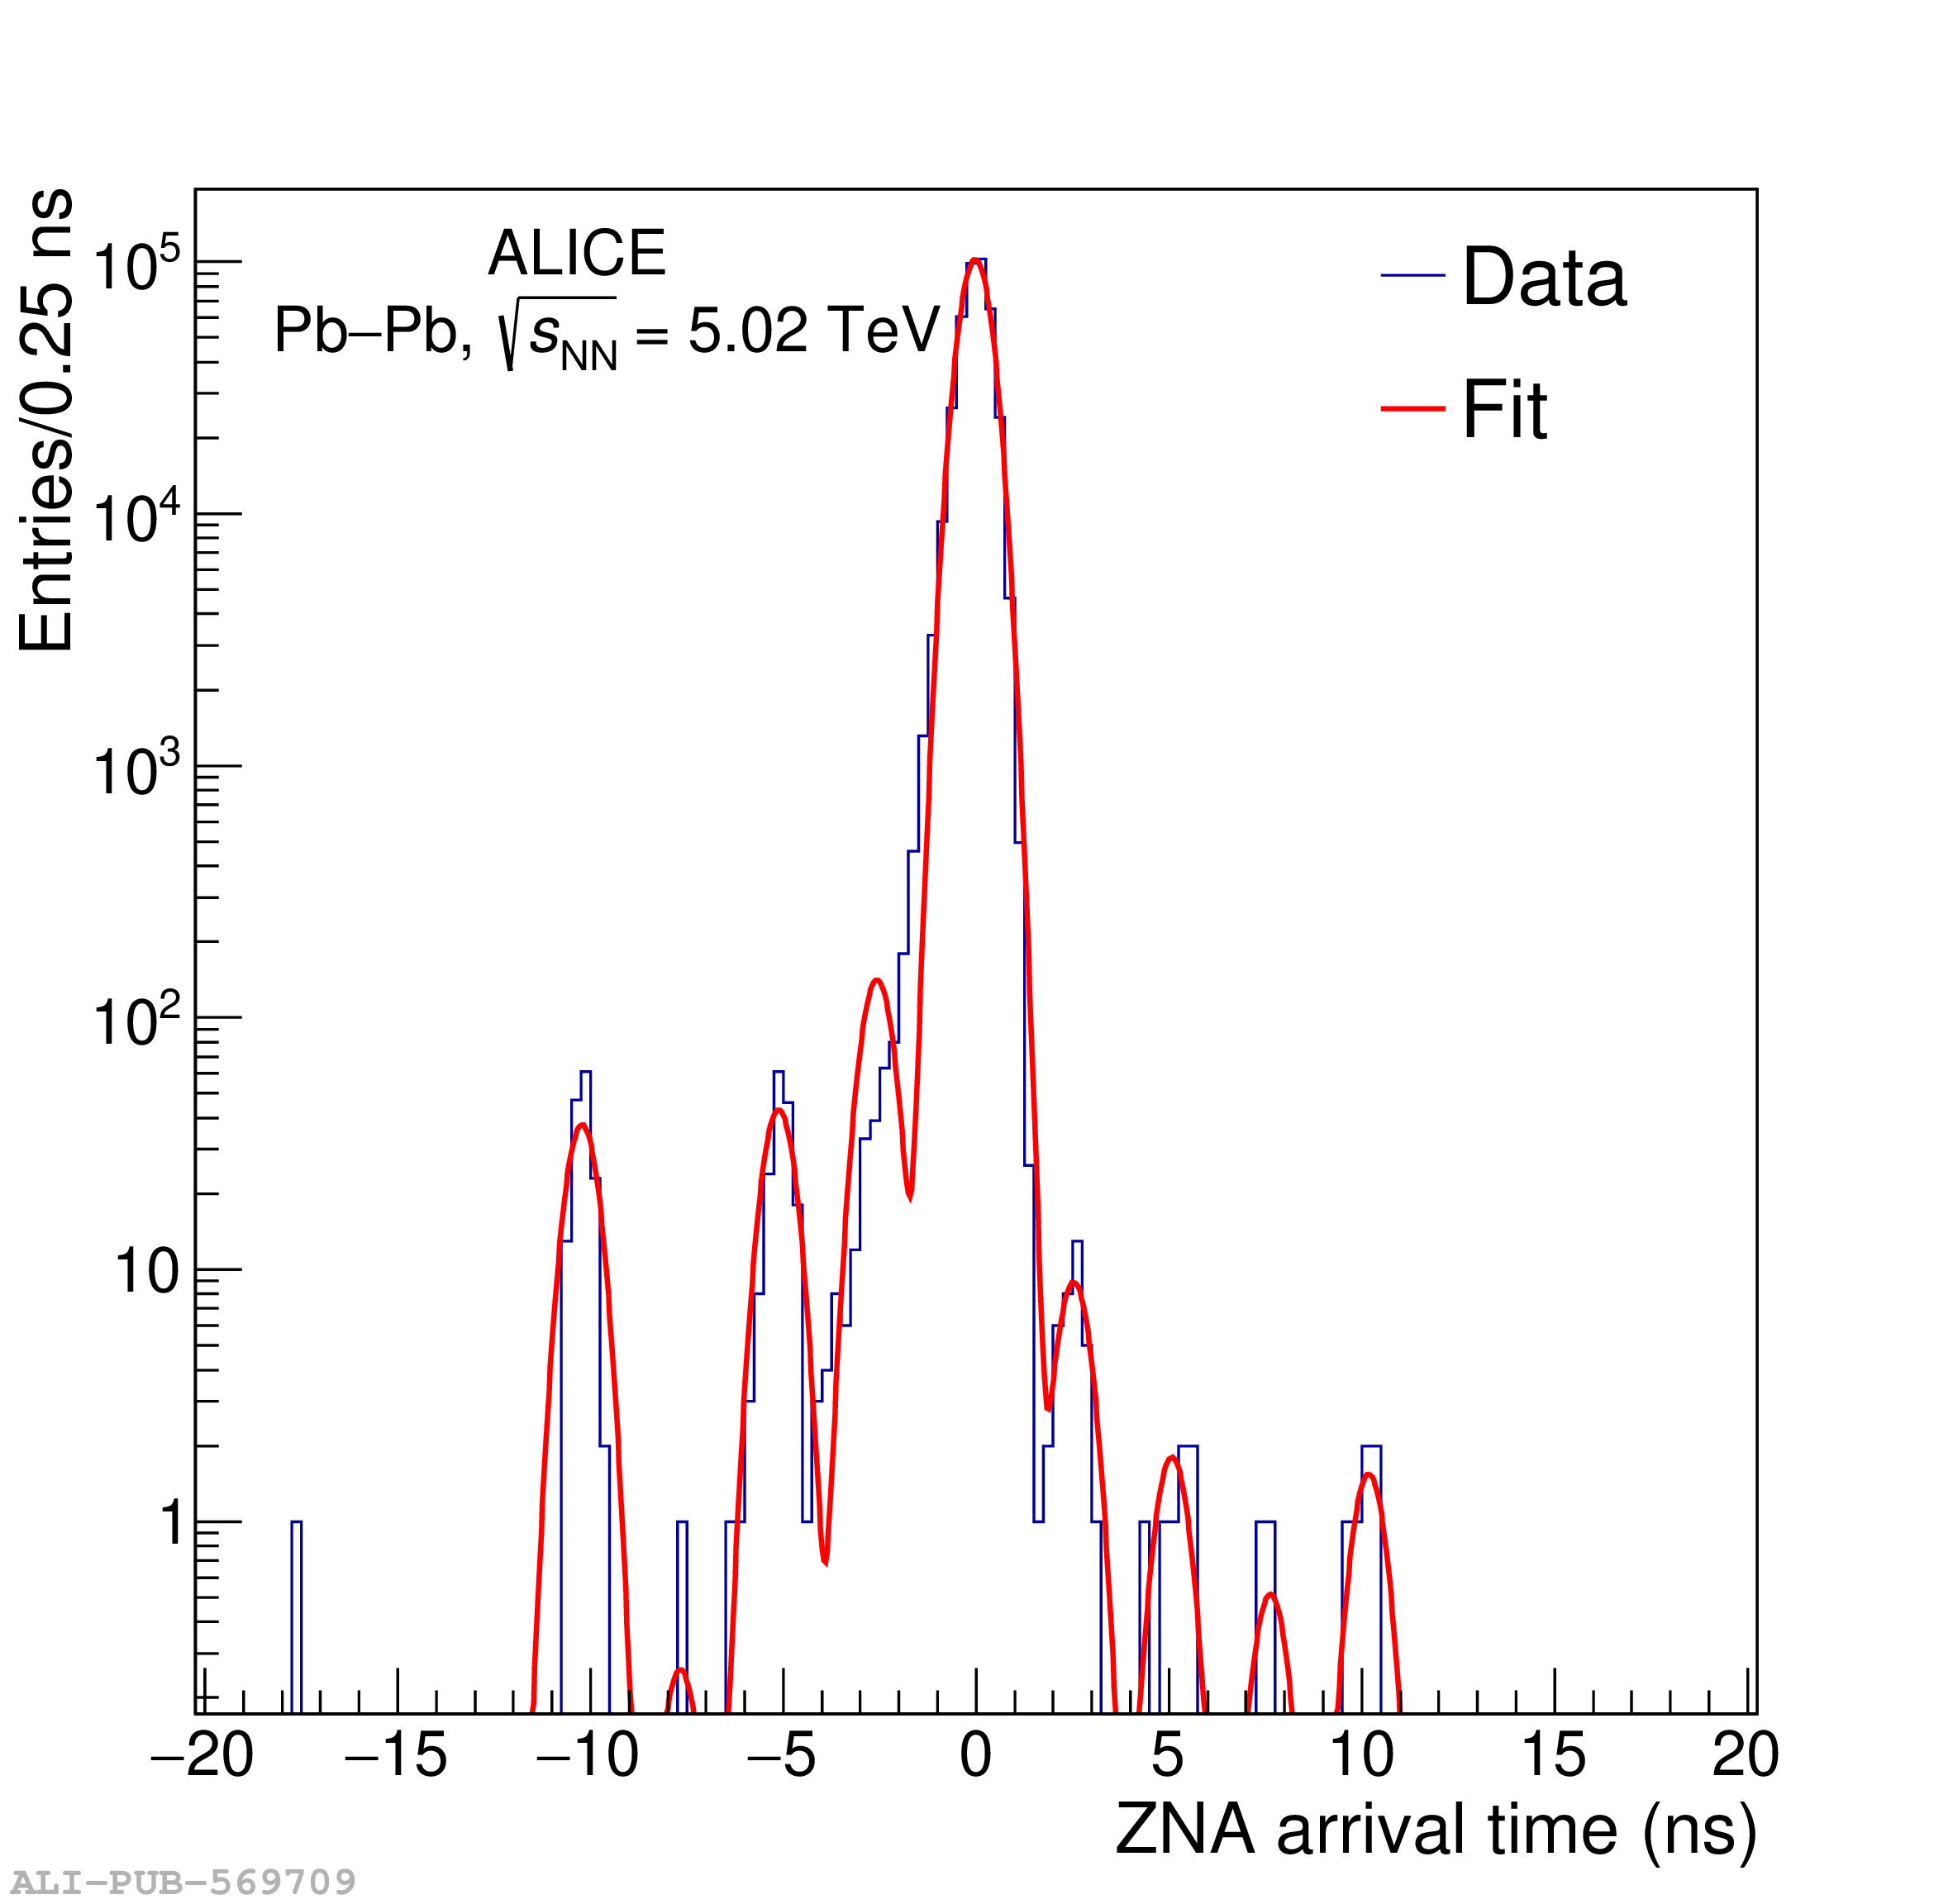 |