Left panel shows the $R_{\mathrm{AA}}$ comparison of various light-flavored hadrons , and the right panel shows the $R_{\mathrm{AA}}$ of ${\rm K}^{*\pm}$ for different centrality intervals both as a function of $\pt$ in Pb$-$Pb collisions at $\snn$ = 5.02 TeV. Statistical (systematic) uncertainties are shown by bars (shaded boxes). The shaded bands around unity reprsents the normalisation uncertainty on $R_{\mathrm{AA}}$. | 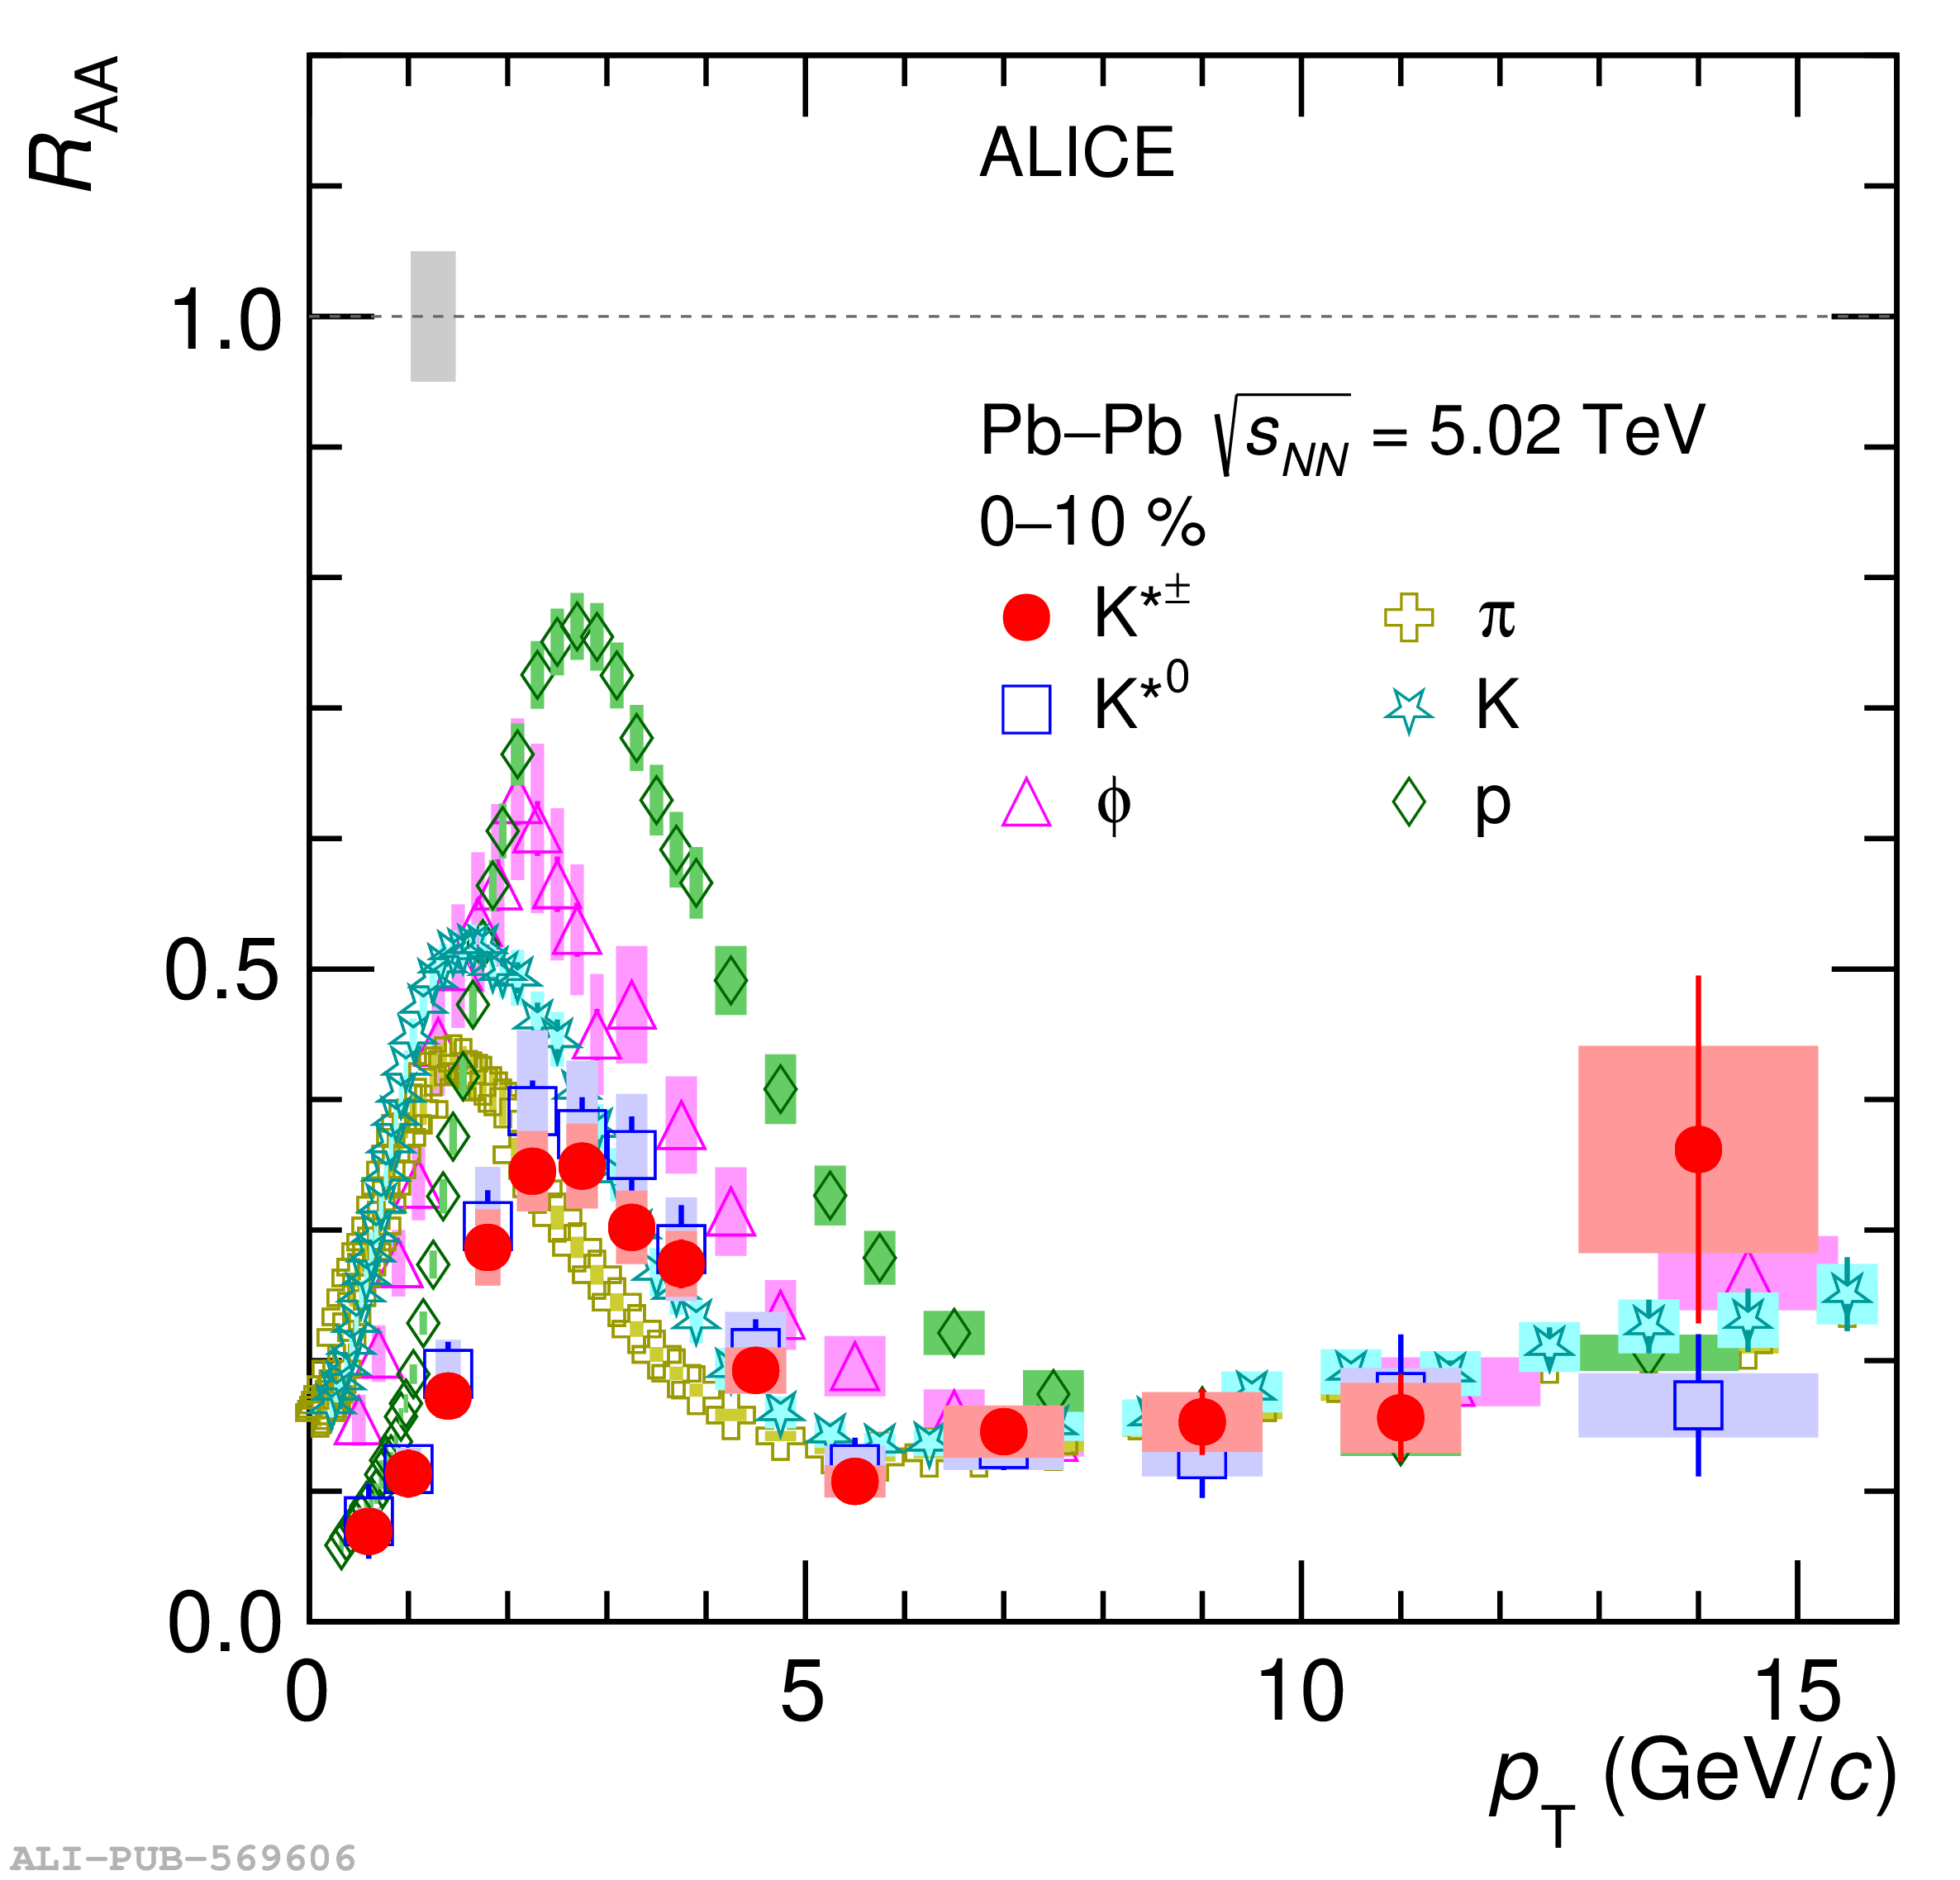 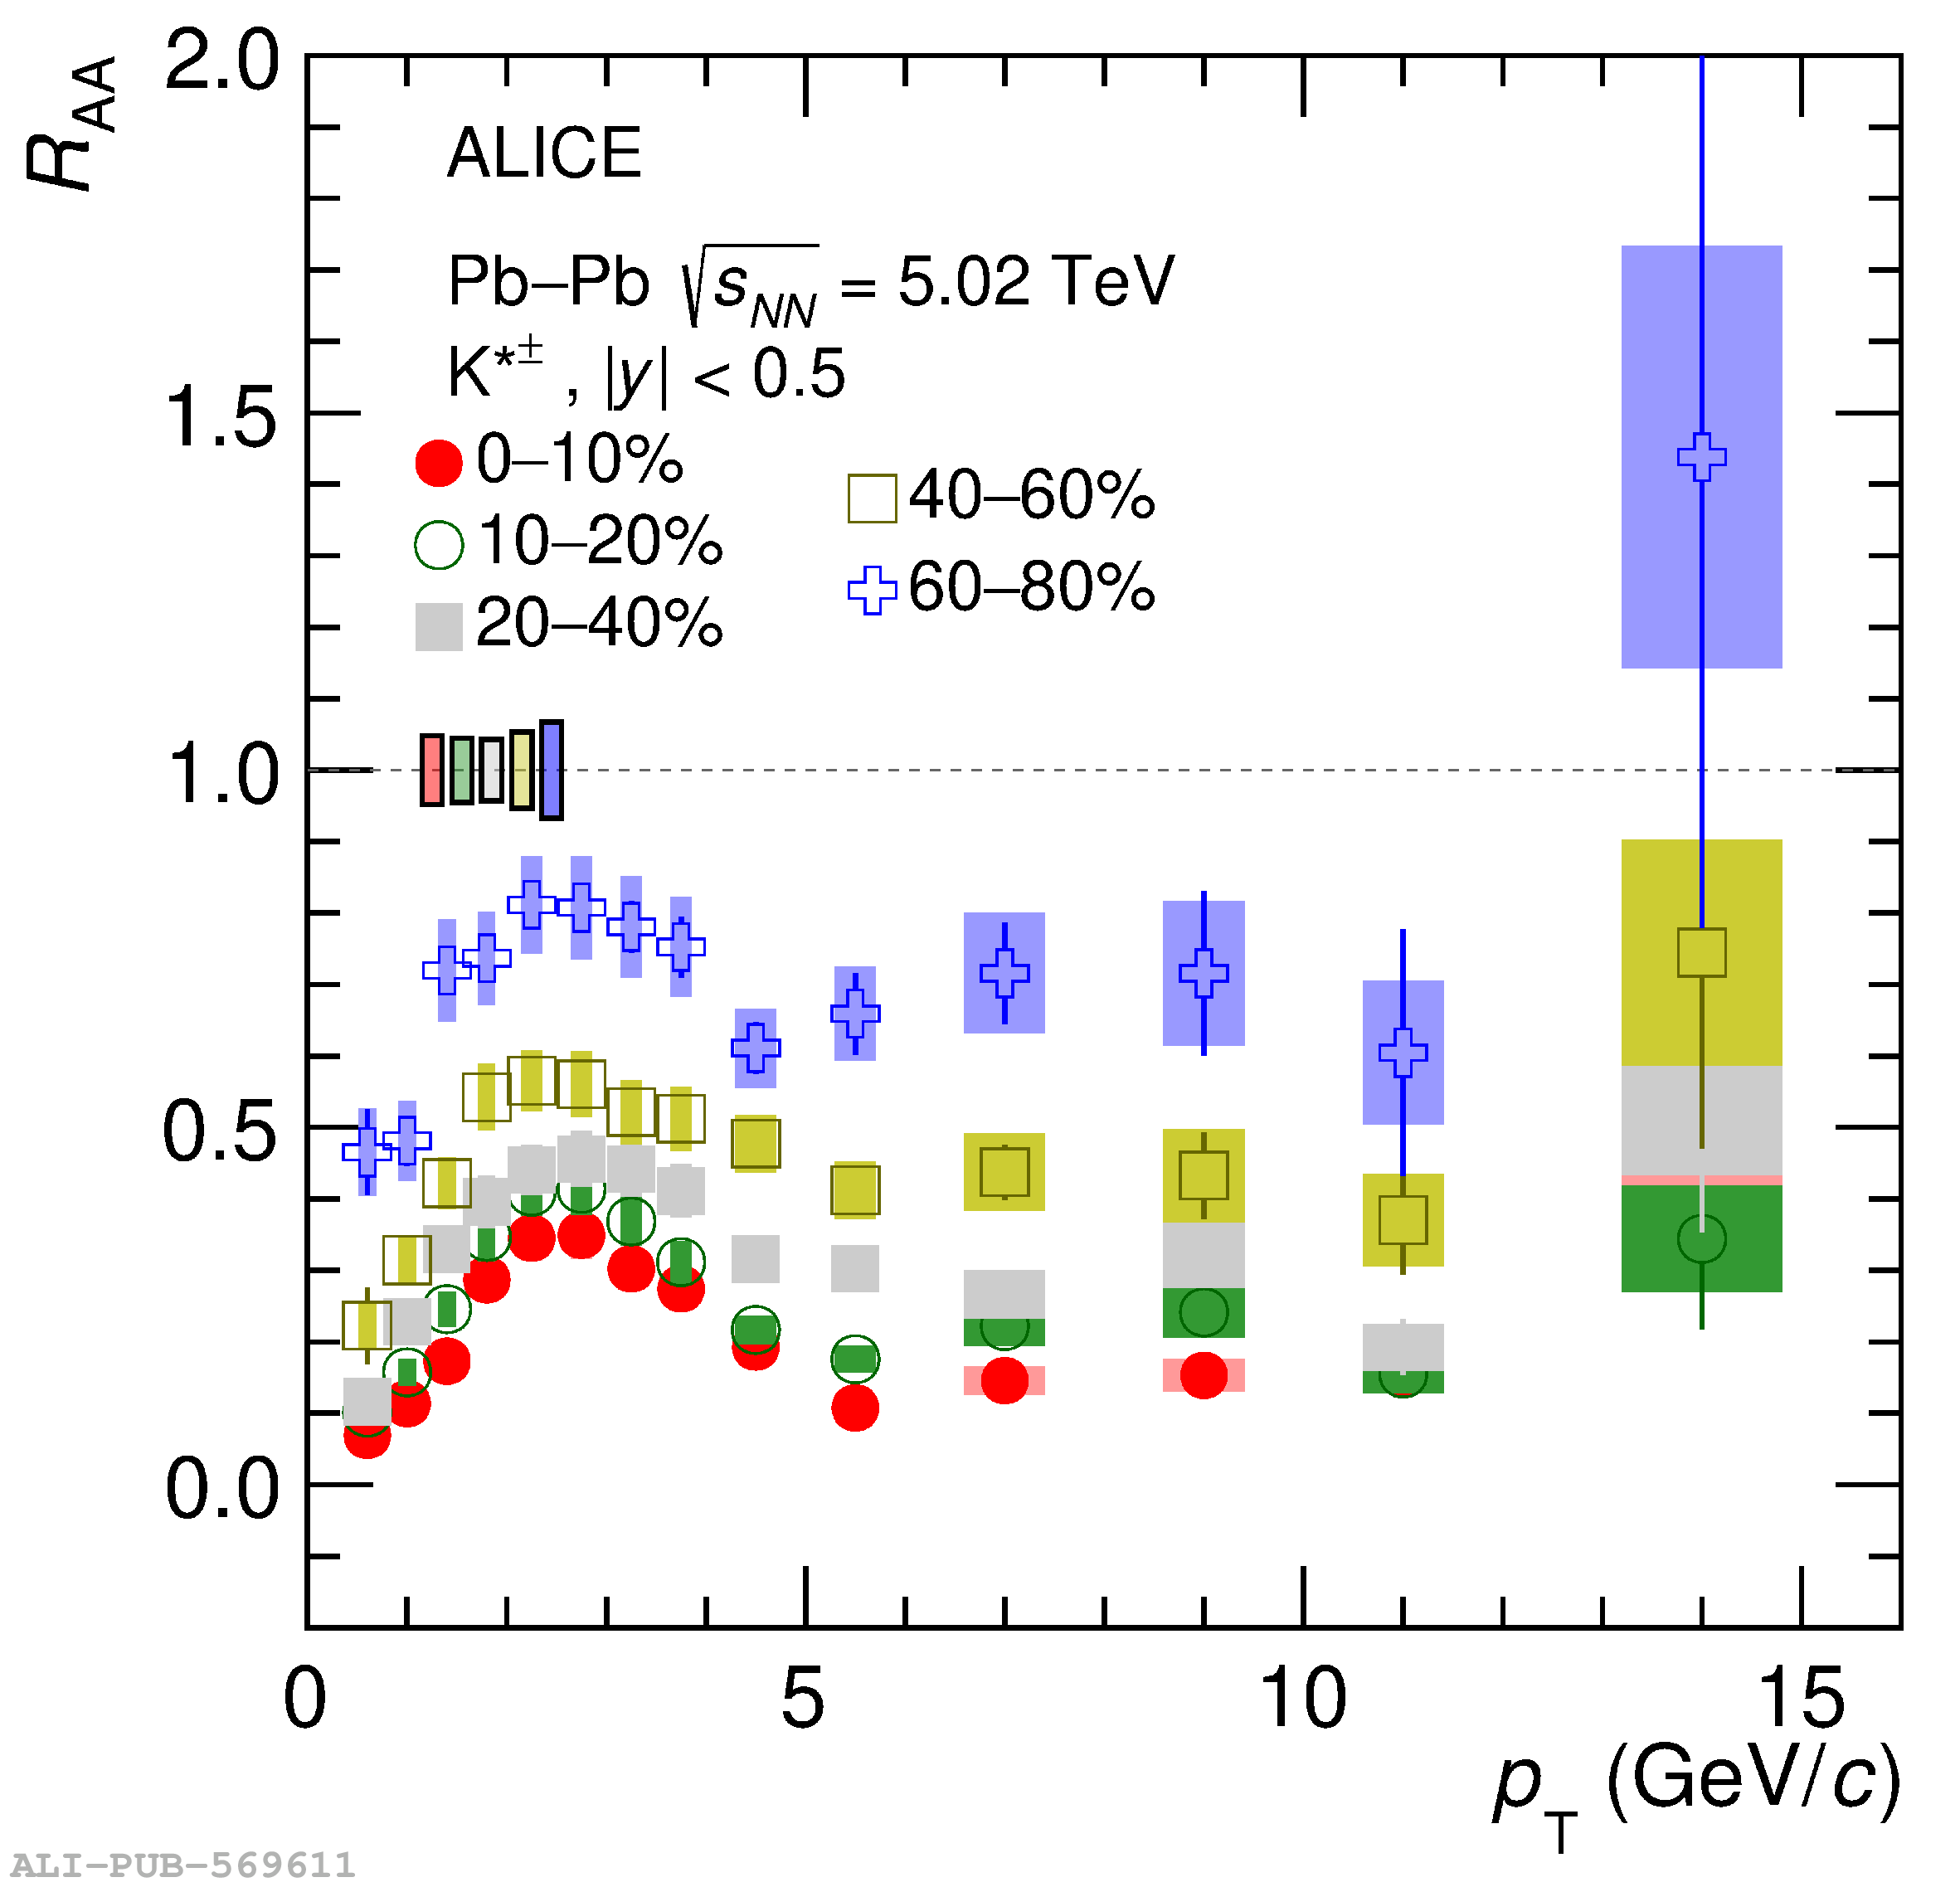 |