The $\pt$ distributions of ${\rm K}^{*\pm}$ (blue circles) and ${\rm K}^{*0}$ (red squares) in 0$-$10$\%$ (left) and 40$-$60$\%$ (right) centrality intervals in Pb--Pb collisions at $\snn$ = 5.02 TeV. Statistical and systematic uncertainties are shown by bars and shaded boxes, respectively. The bottom panels show the ${\rm K}^{*\pm}$ to ${\rm K}^{*0}$ ratio as a function of $\pt$. | 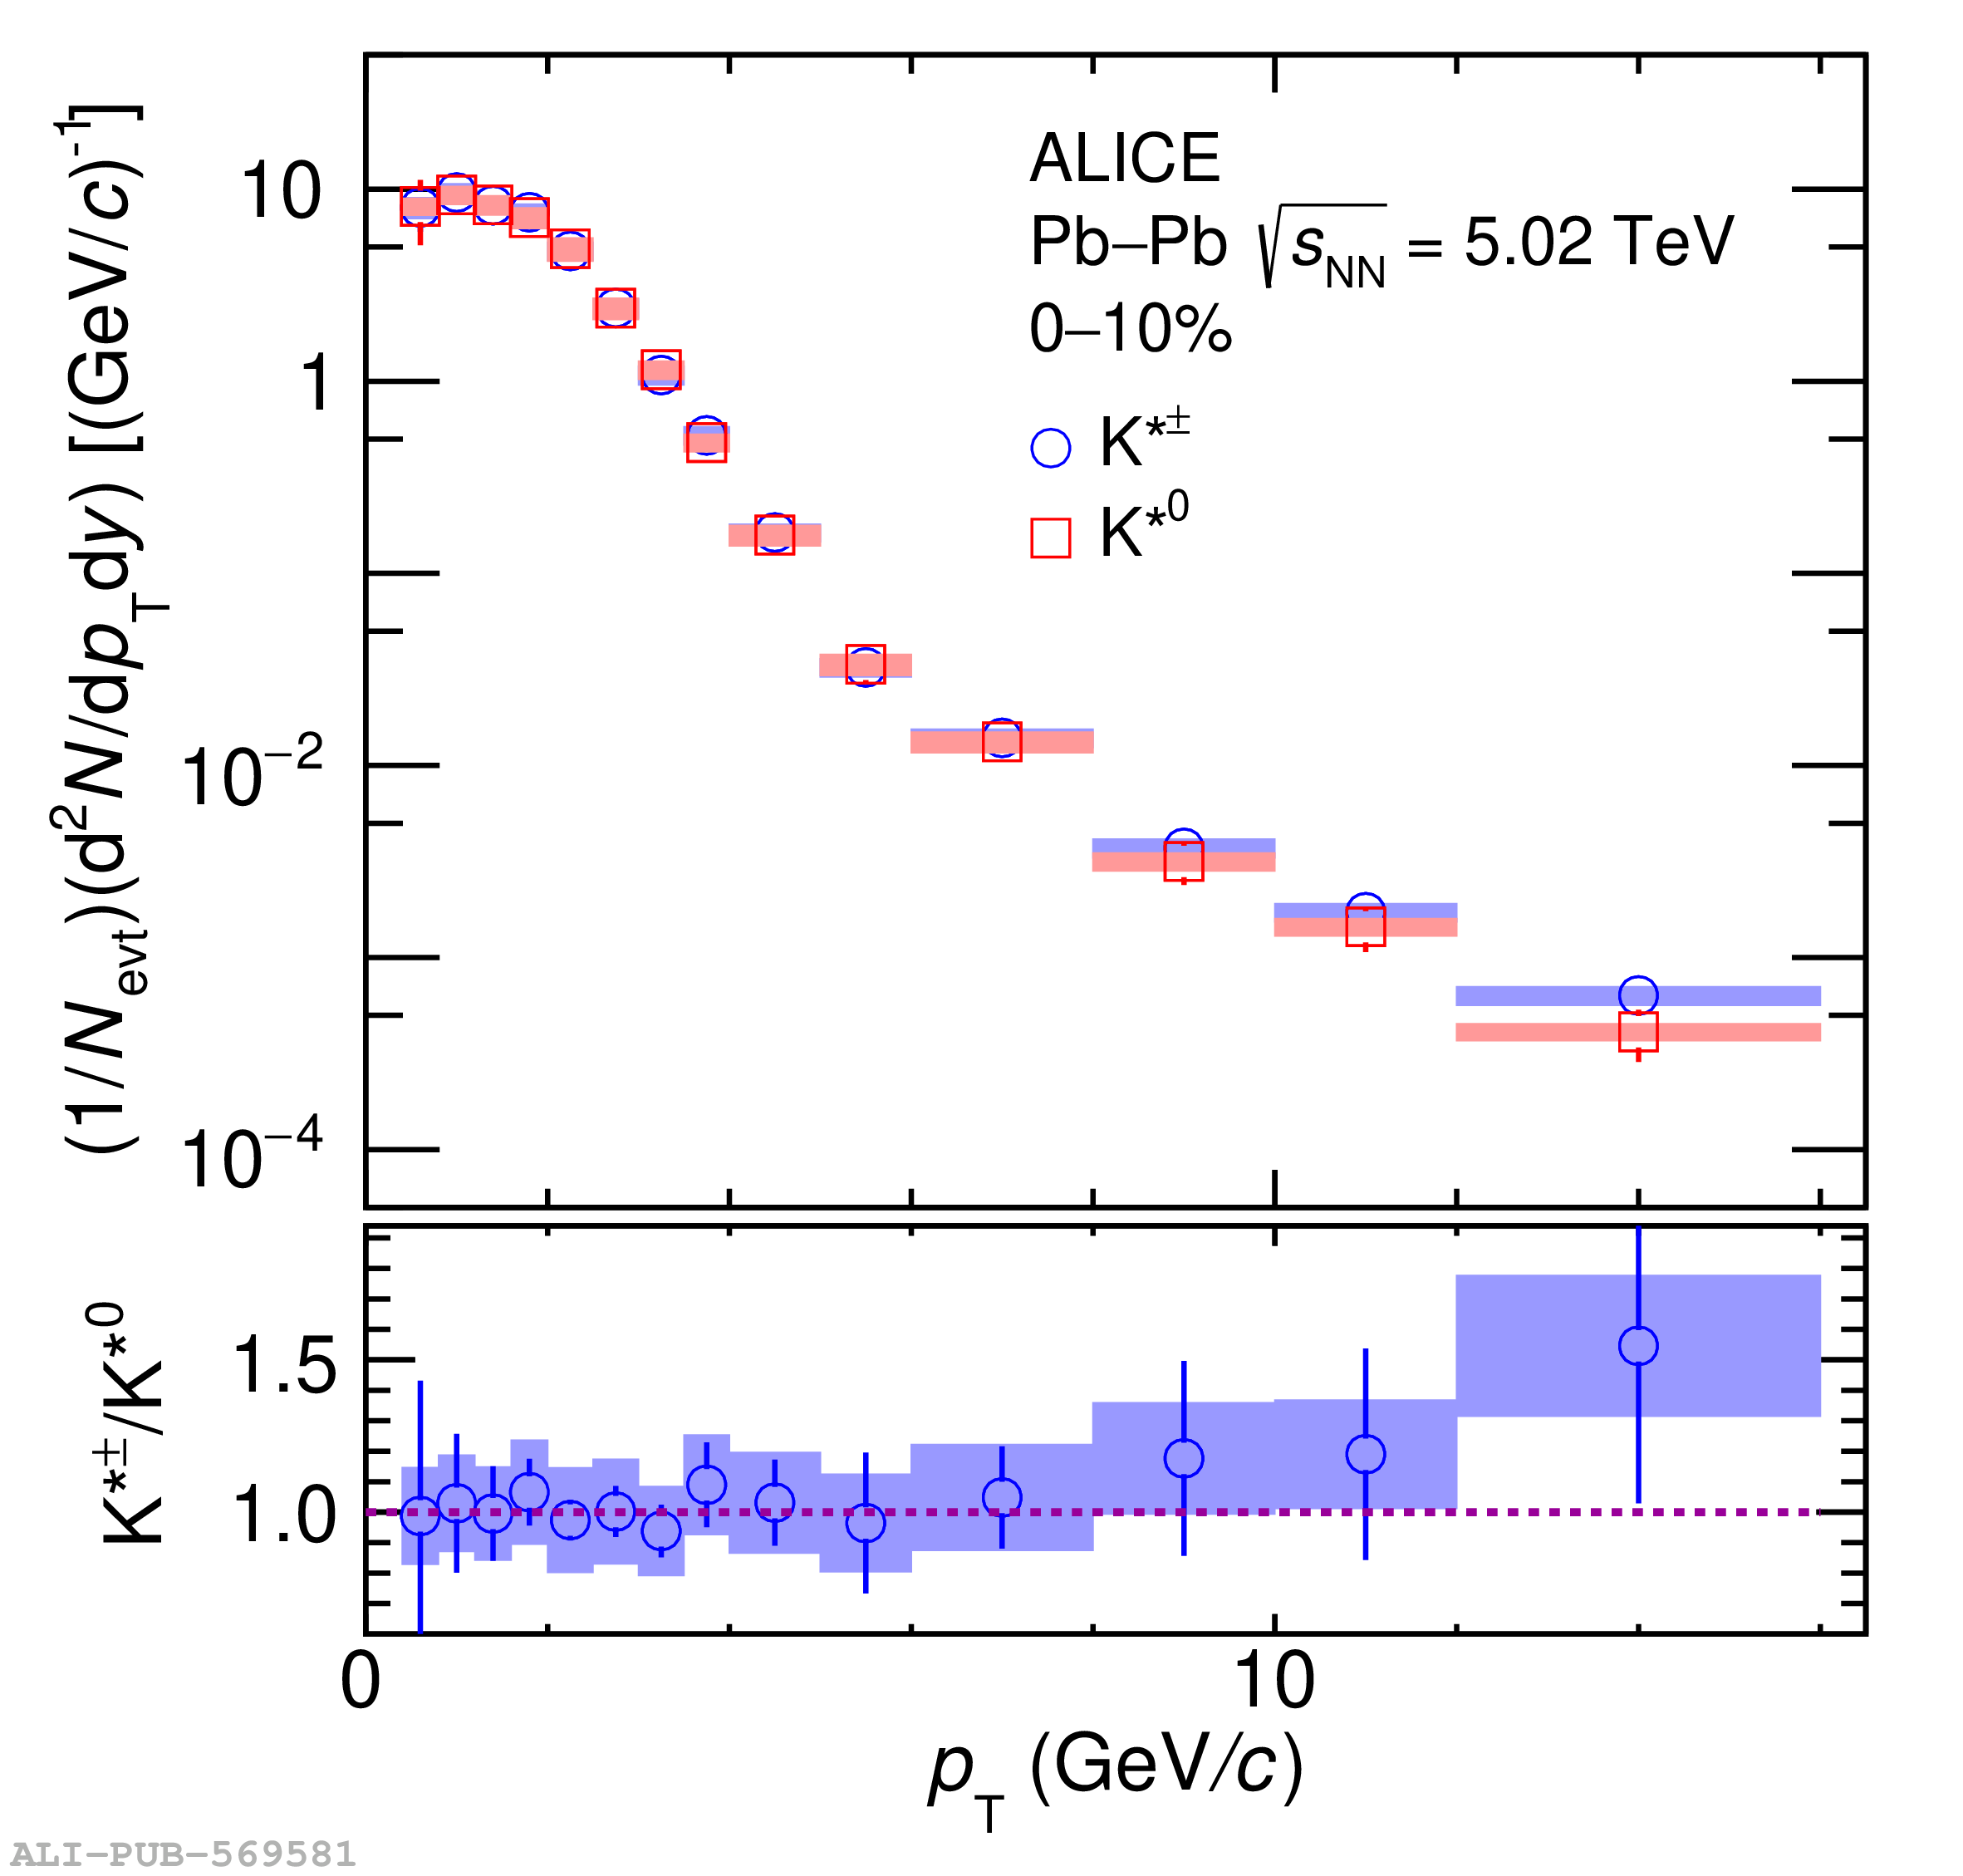 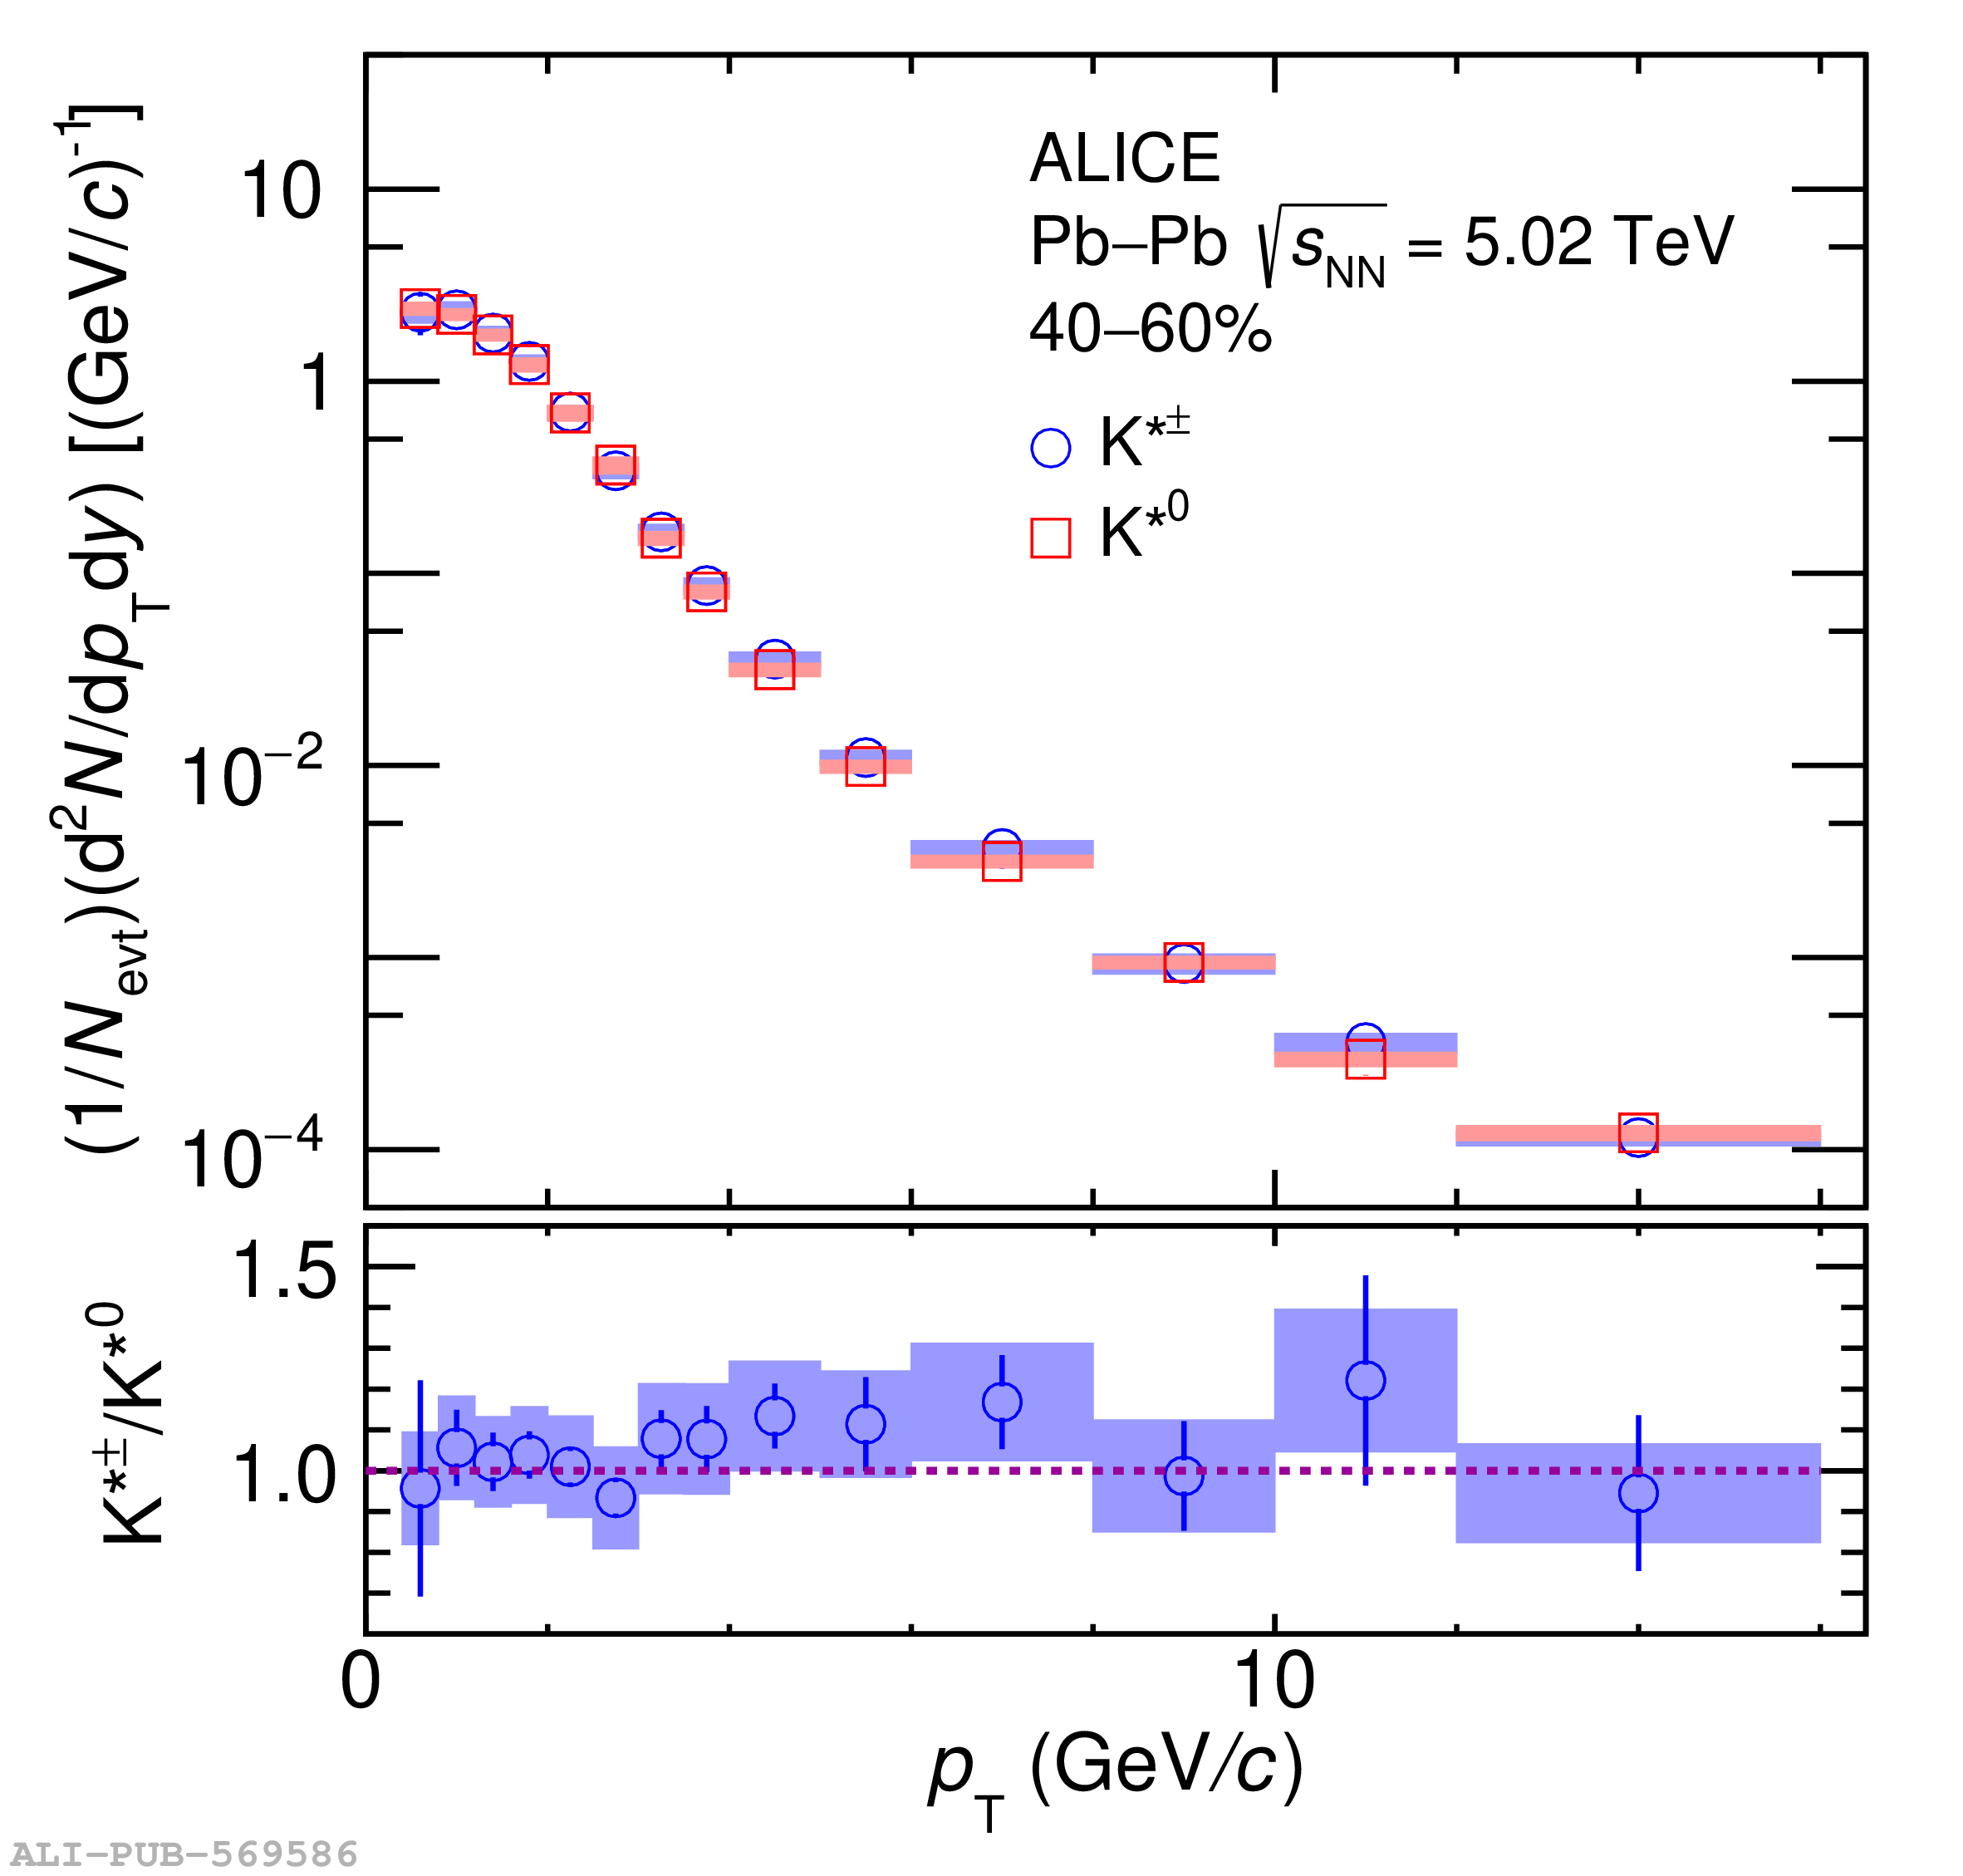 |