(Left panel): Invariant mass distribution of ${\rm K^0_S}\pi^\pm$ pairs in same (black marker) and mixed events (red marker). (Right panel): Invariant mass distribution of ${\rm K^0_S}\pi^\pm$ pairs after the subtraction of normalized mixed-event background distribution. The solid red curve is the fit function defined by Eq. 2, with the dotted blue line describing the residual background distribution given by Eq. 3. | 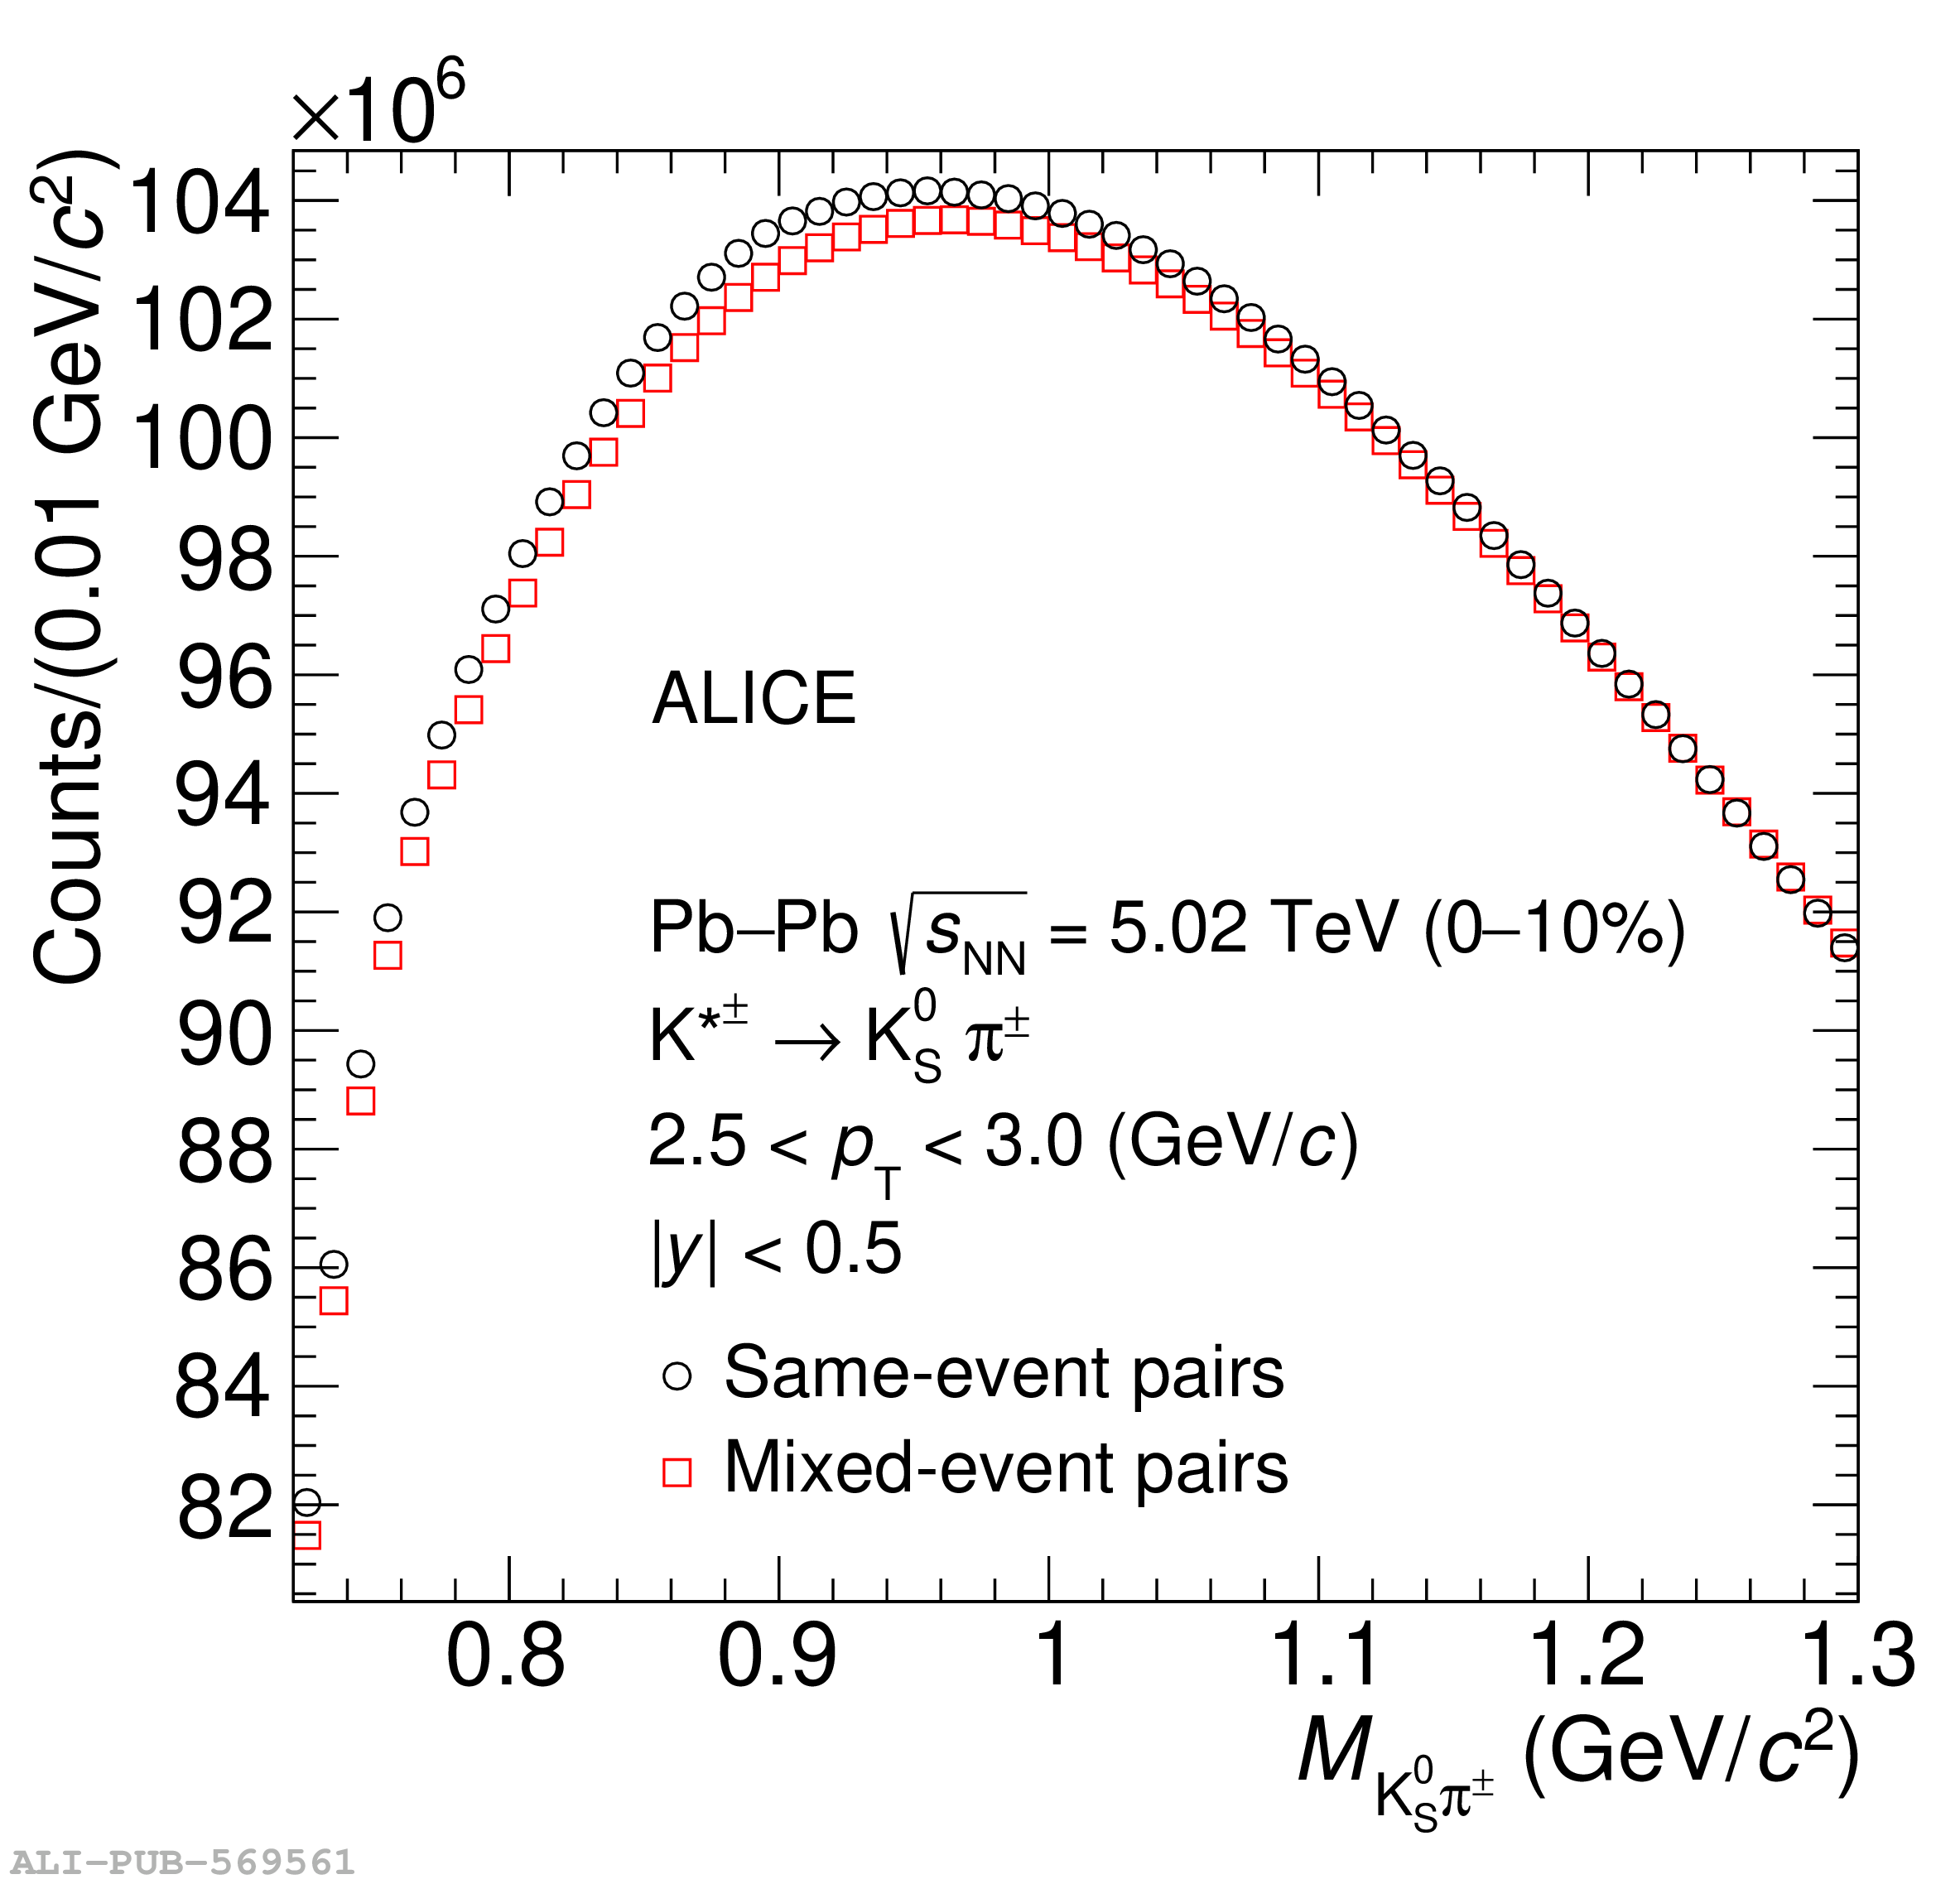 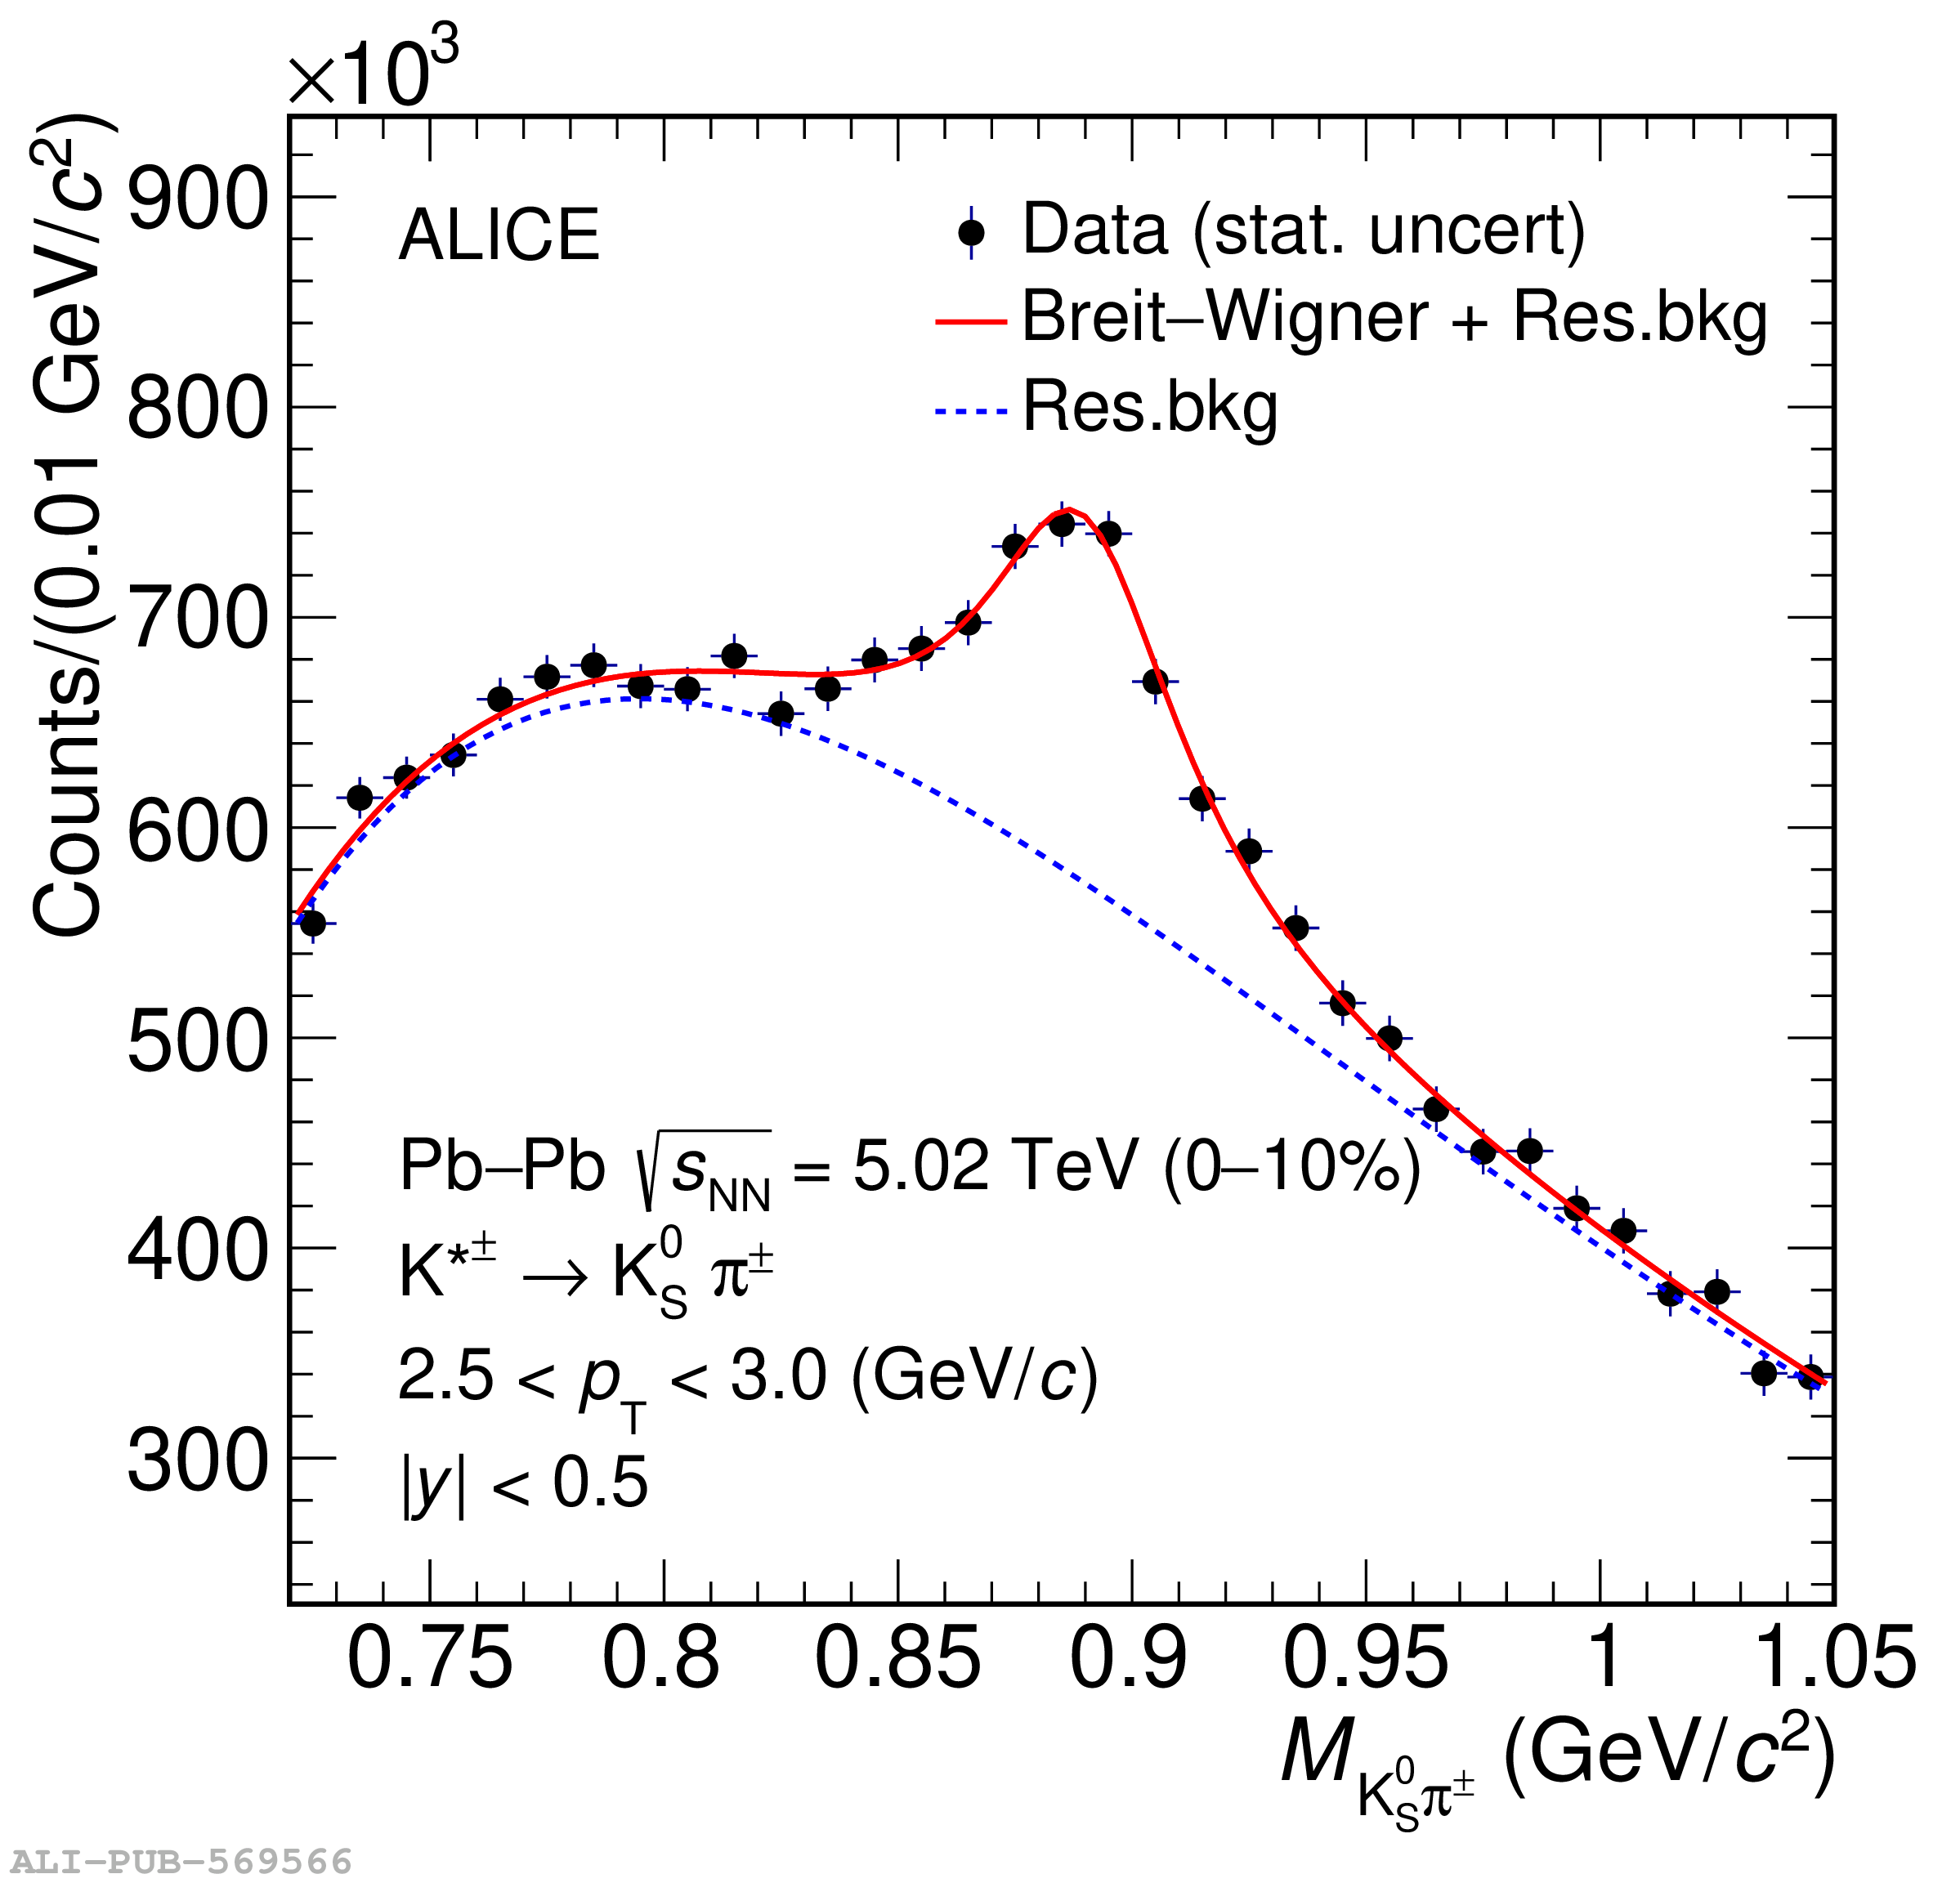 |