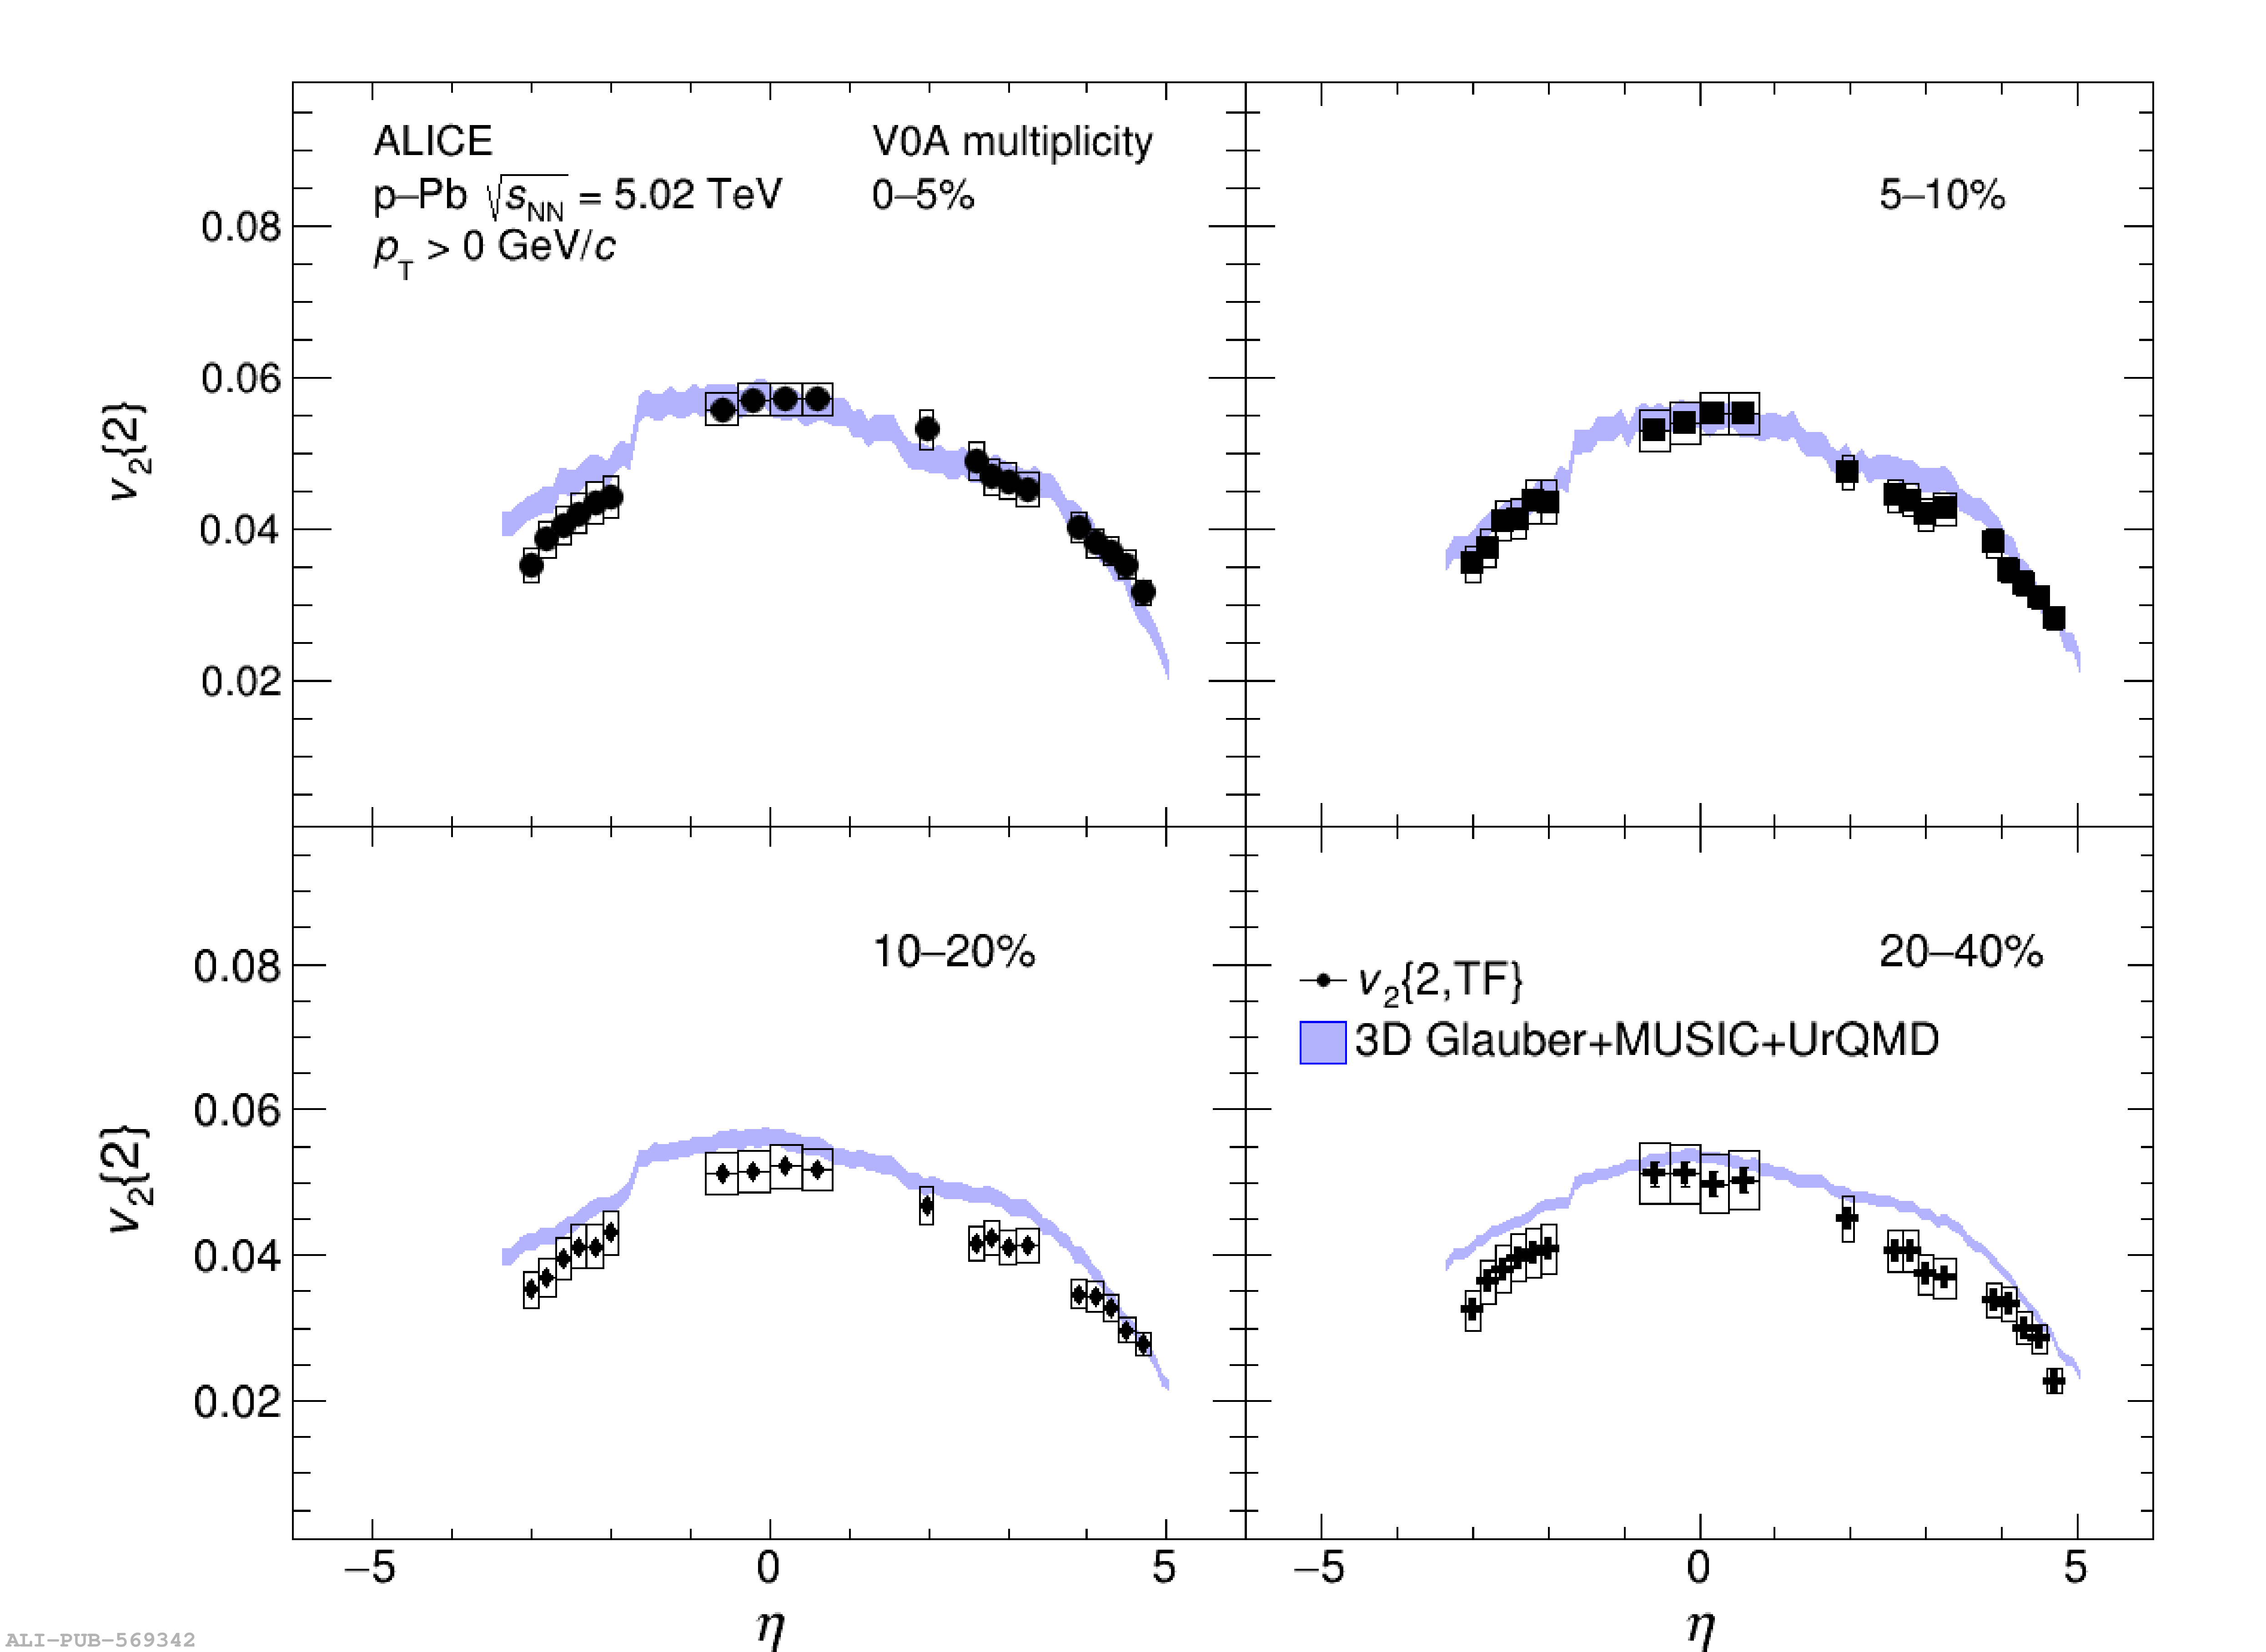
Pseudorapidity dependence of $\pt$ integrated $v_2$. Comparison of the measured data (black circles) with a calculation by the hydrodynamical model (blue band) for the 0$-$5% (top left), 5$-$10% (top right), 10$-$20% (bottom left), and 20$-$40% (bottom right) centrality classes.