Particle identification (PID) is a fundamental aspect of the ALICE detector system, central to its heavy-ion and proton-proton physics programs. Among the different PID strategies, ALICE uses the Time-Of-Flight (TOF) detector to identify particles at intermediate momenta ($0.5 <~ p_{\rm T} <~ 4$ GeV/$c$). The ALICE TOF detector performed successfully during the first ten years of LHC operations. During the Long Shutdown 2, many ALICE sub-detectors, including TOF, were upgraded to fully leverage the targeted 50 kHz interaction rate of Pb-Pb collisions, which required the implementation of a continuous readout scheme. The TOF detector electronics were upgraded and refurbished, while processing algorithms for data quality control, reconstruction, calibration, and analysis were rewritten. This paper presents the upgraded TOF detector operation and calibration procedures and its performance in terms of timing resolution, a key factor for particle separation in ALICE analyses. Using 2022 pp collision data at $\sqrt{s} = 13.6$ TeV from Run 3, the time resolution of the detector was estimated with two independent methods, both yielding consistent results, better than 80 ps. Despite the excellent performance already achieved, further improvements are expected after additional detector commissioning and refined calibration procedures, thus enhancing the ALICE PID capabilities for Run 3 and beyond.
Accepted by: EPJP
e-Print: arXiv:2511.10311 | PDF | inSPIRE
CERN-EP-2025-255
Figure group
Figure 2
(left) HPTDC programming schema adopted during Run 1 and 2 (top left) and during Run 3 (bottom left) As described in detail in , in Run 3, all triggers used previously are replaced by a periodic trigger (asynchronous with respect to actual collisions) at fixed bunch crossing number ($f=33.4$ kHz), mimicking a continuous readout and covering a complete LHC orbit within three triggers All hits (short vertical blue lines) are read out and can be associated with physical events at a later stage (right) Possible selection of parameters (asynchronous trigger frequency $f_\mathrm{T}$ and matching window width $m_\mathrm{w}$) to realize a continuous readout The blue curve shows the region of allowed values The red boundaries illustrate system limitations from the HPTDC matching algorithm and HPTDC readout time constraints The green circle marks the chosen point of operation, with an asynchronous trigger rate of $\sim 33 {\rm kHz}$ and a matching window of $28.8 \mu s$. | 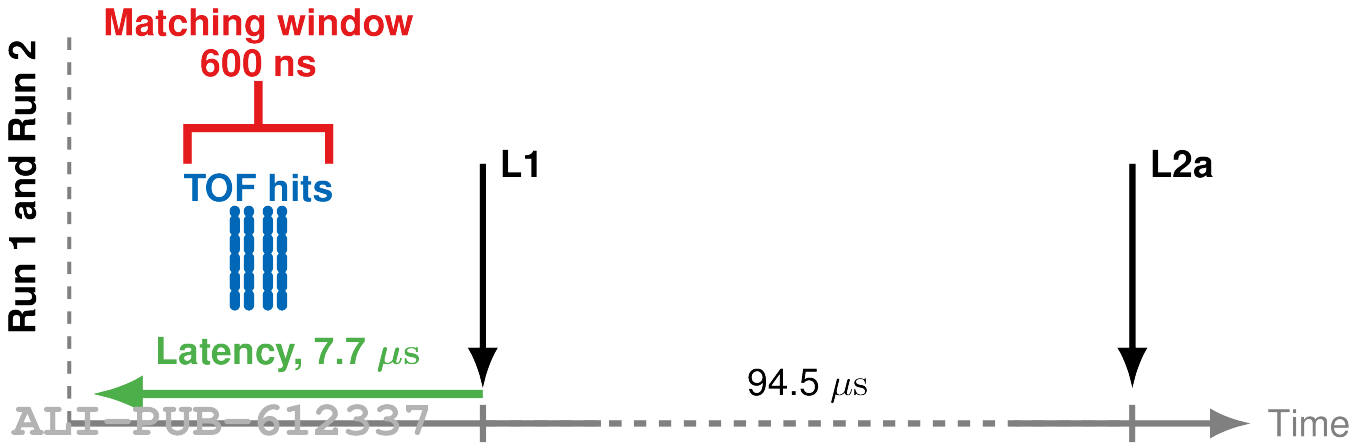  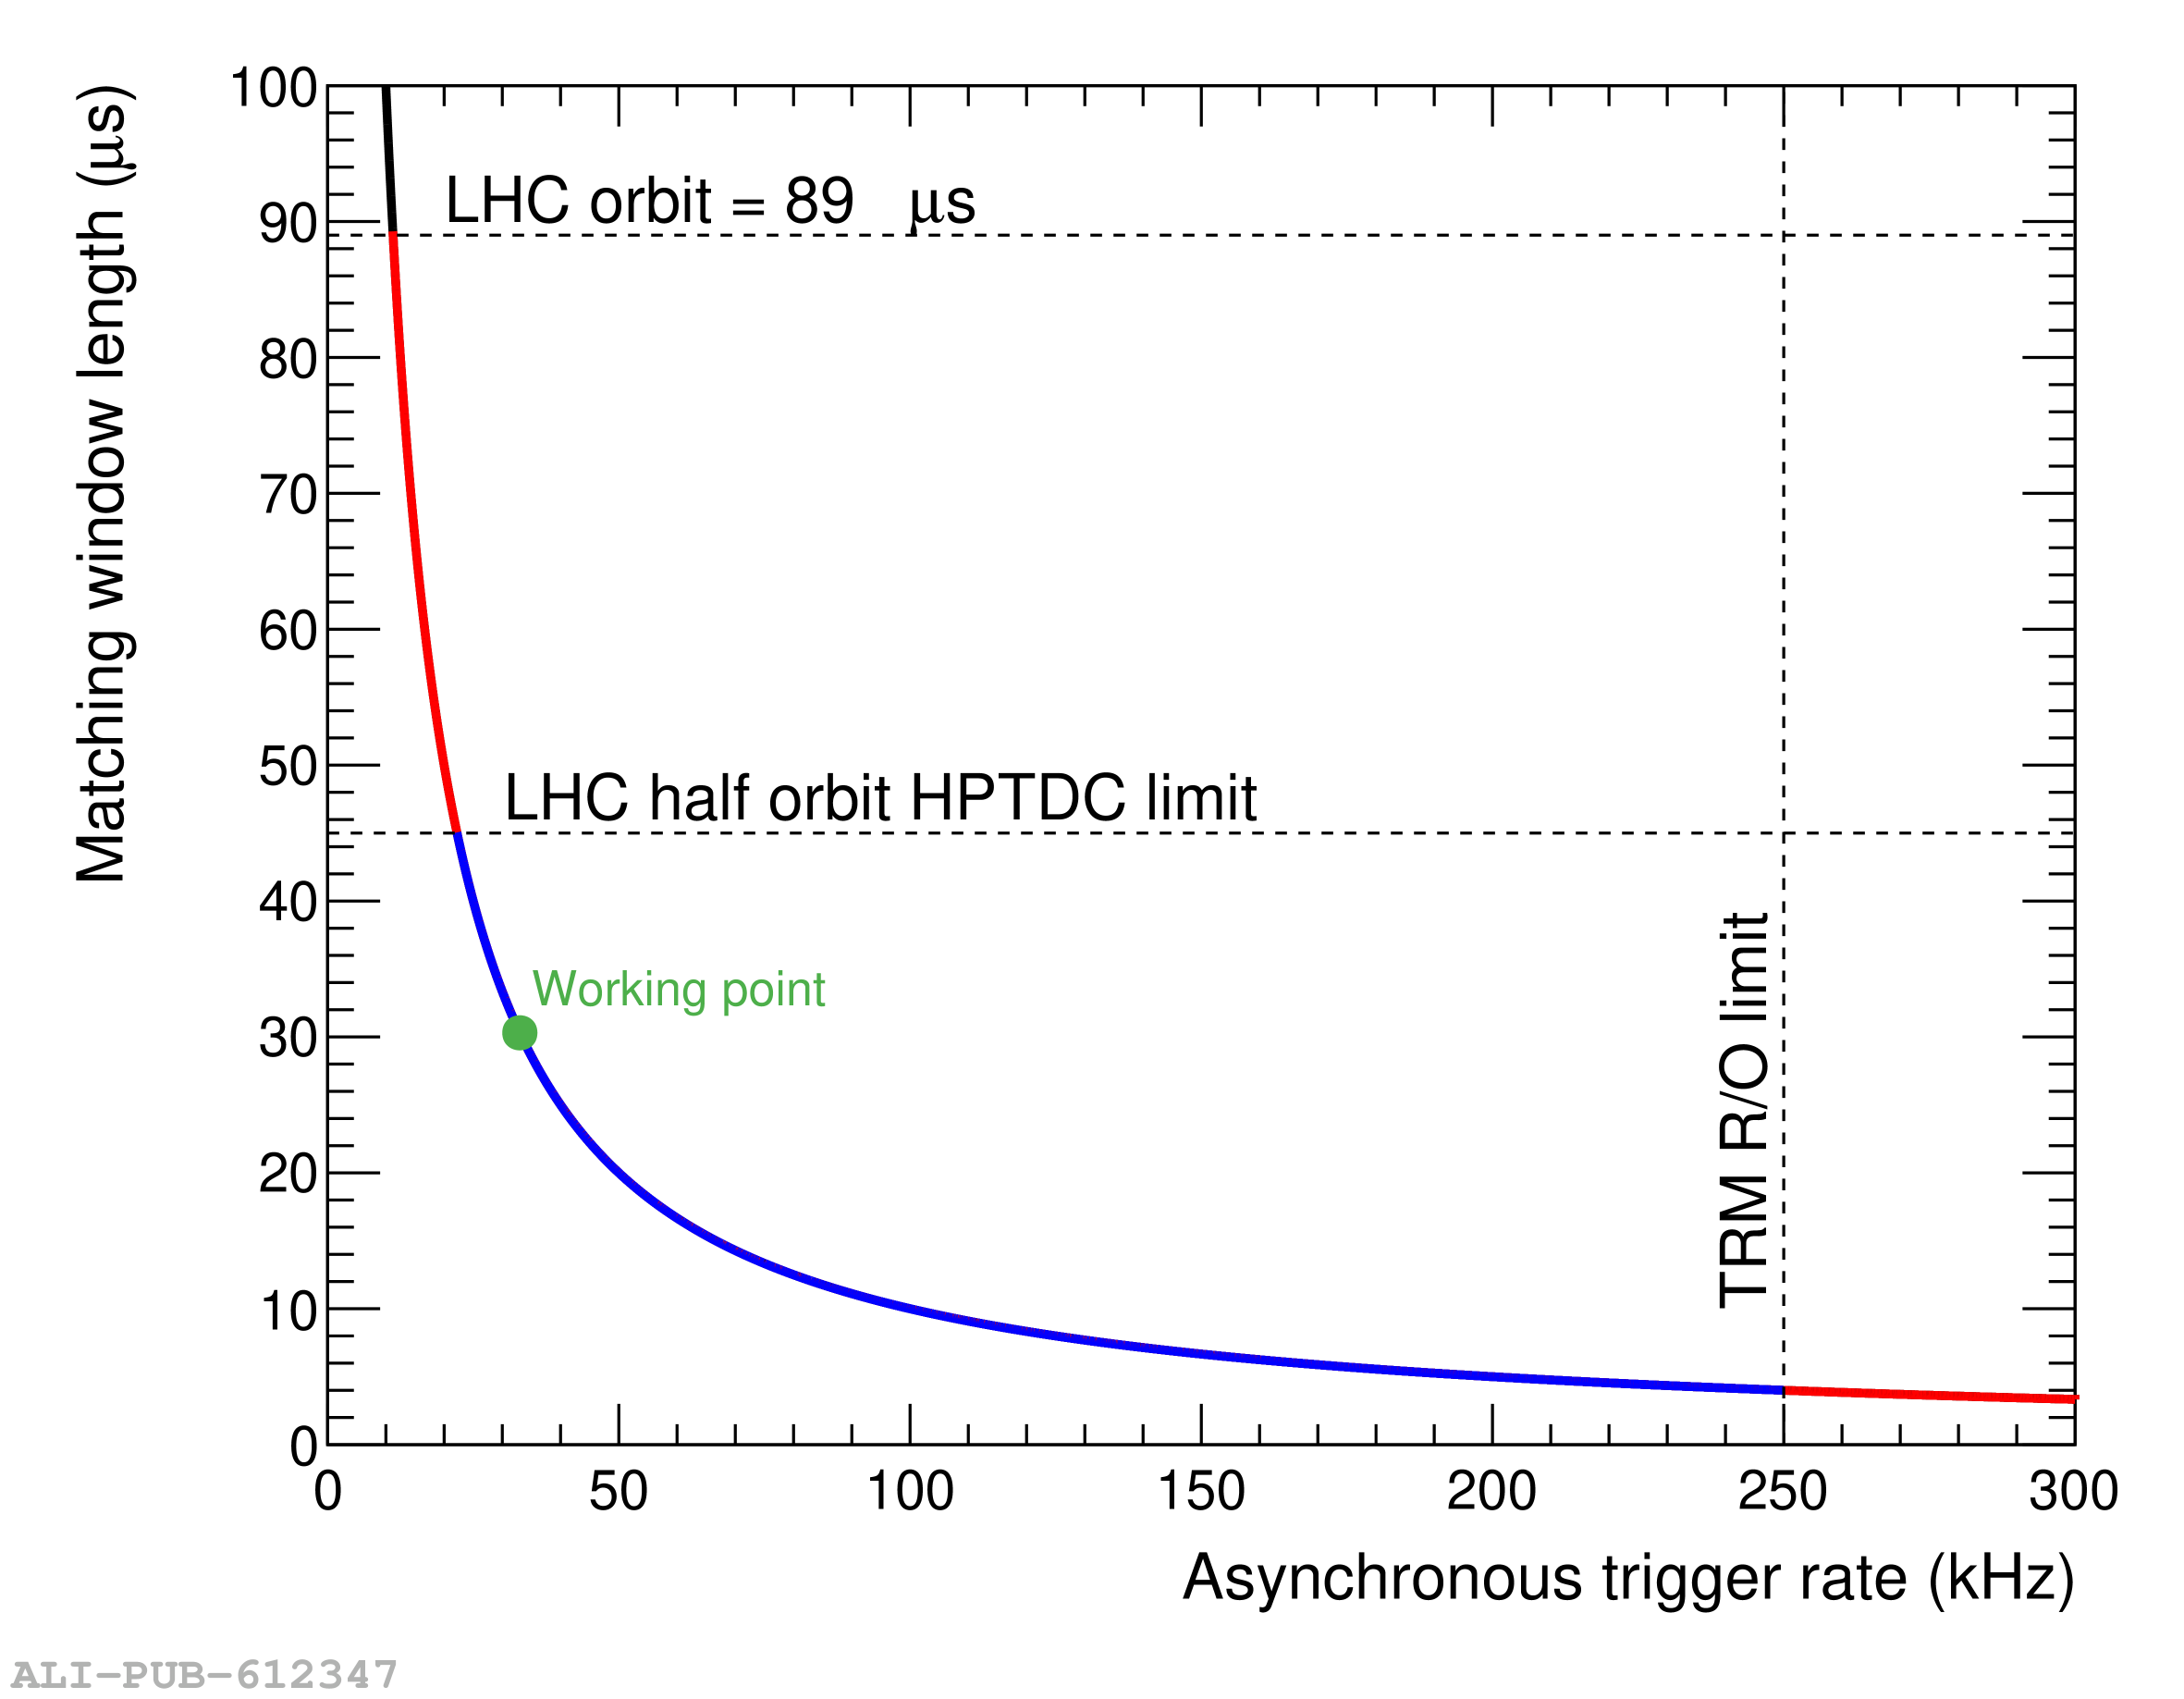 |
Figure 4
Distribution of time-slewing corrections over all channels, an example for one single channel is provided as reference A reference at zero was taken for all channels at ToT = 12.5 ns The reported time-slewing calibration was obtained from the data taken with pp collisions at $\sqrt{s} = 13.6$ TeV. A sufficient statistics is required to ensure that the statistical uncertainty on the extracted correction remains below 10 ps The shape of the correction is driven by the rise-time dependence of the discriminator threshold. | 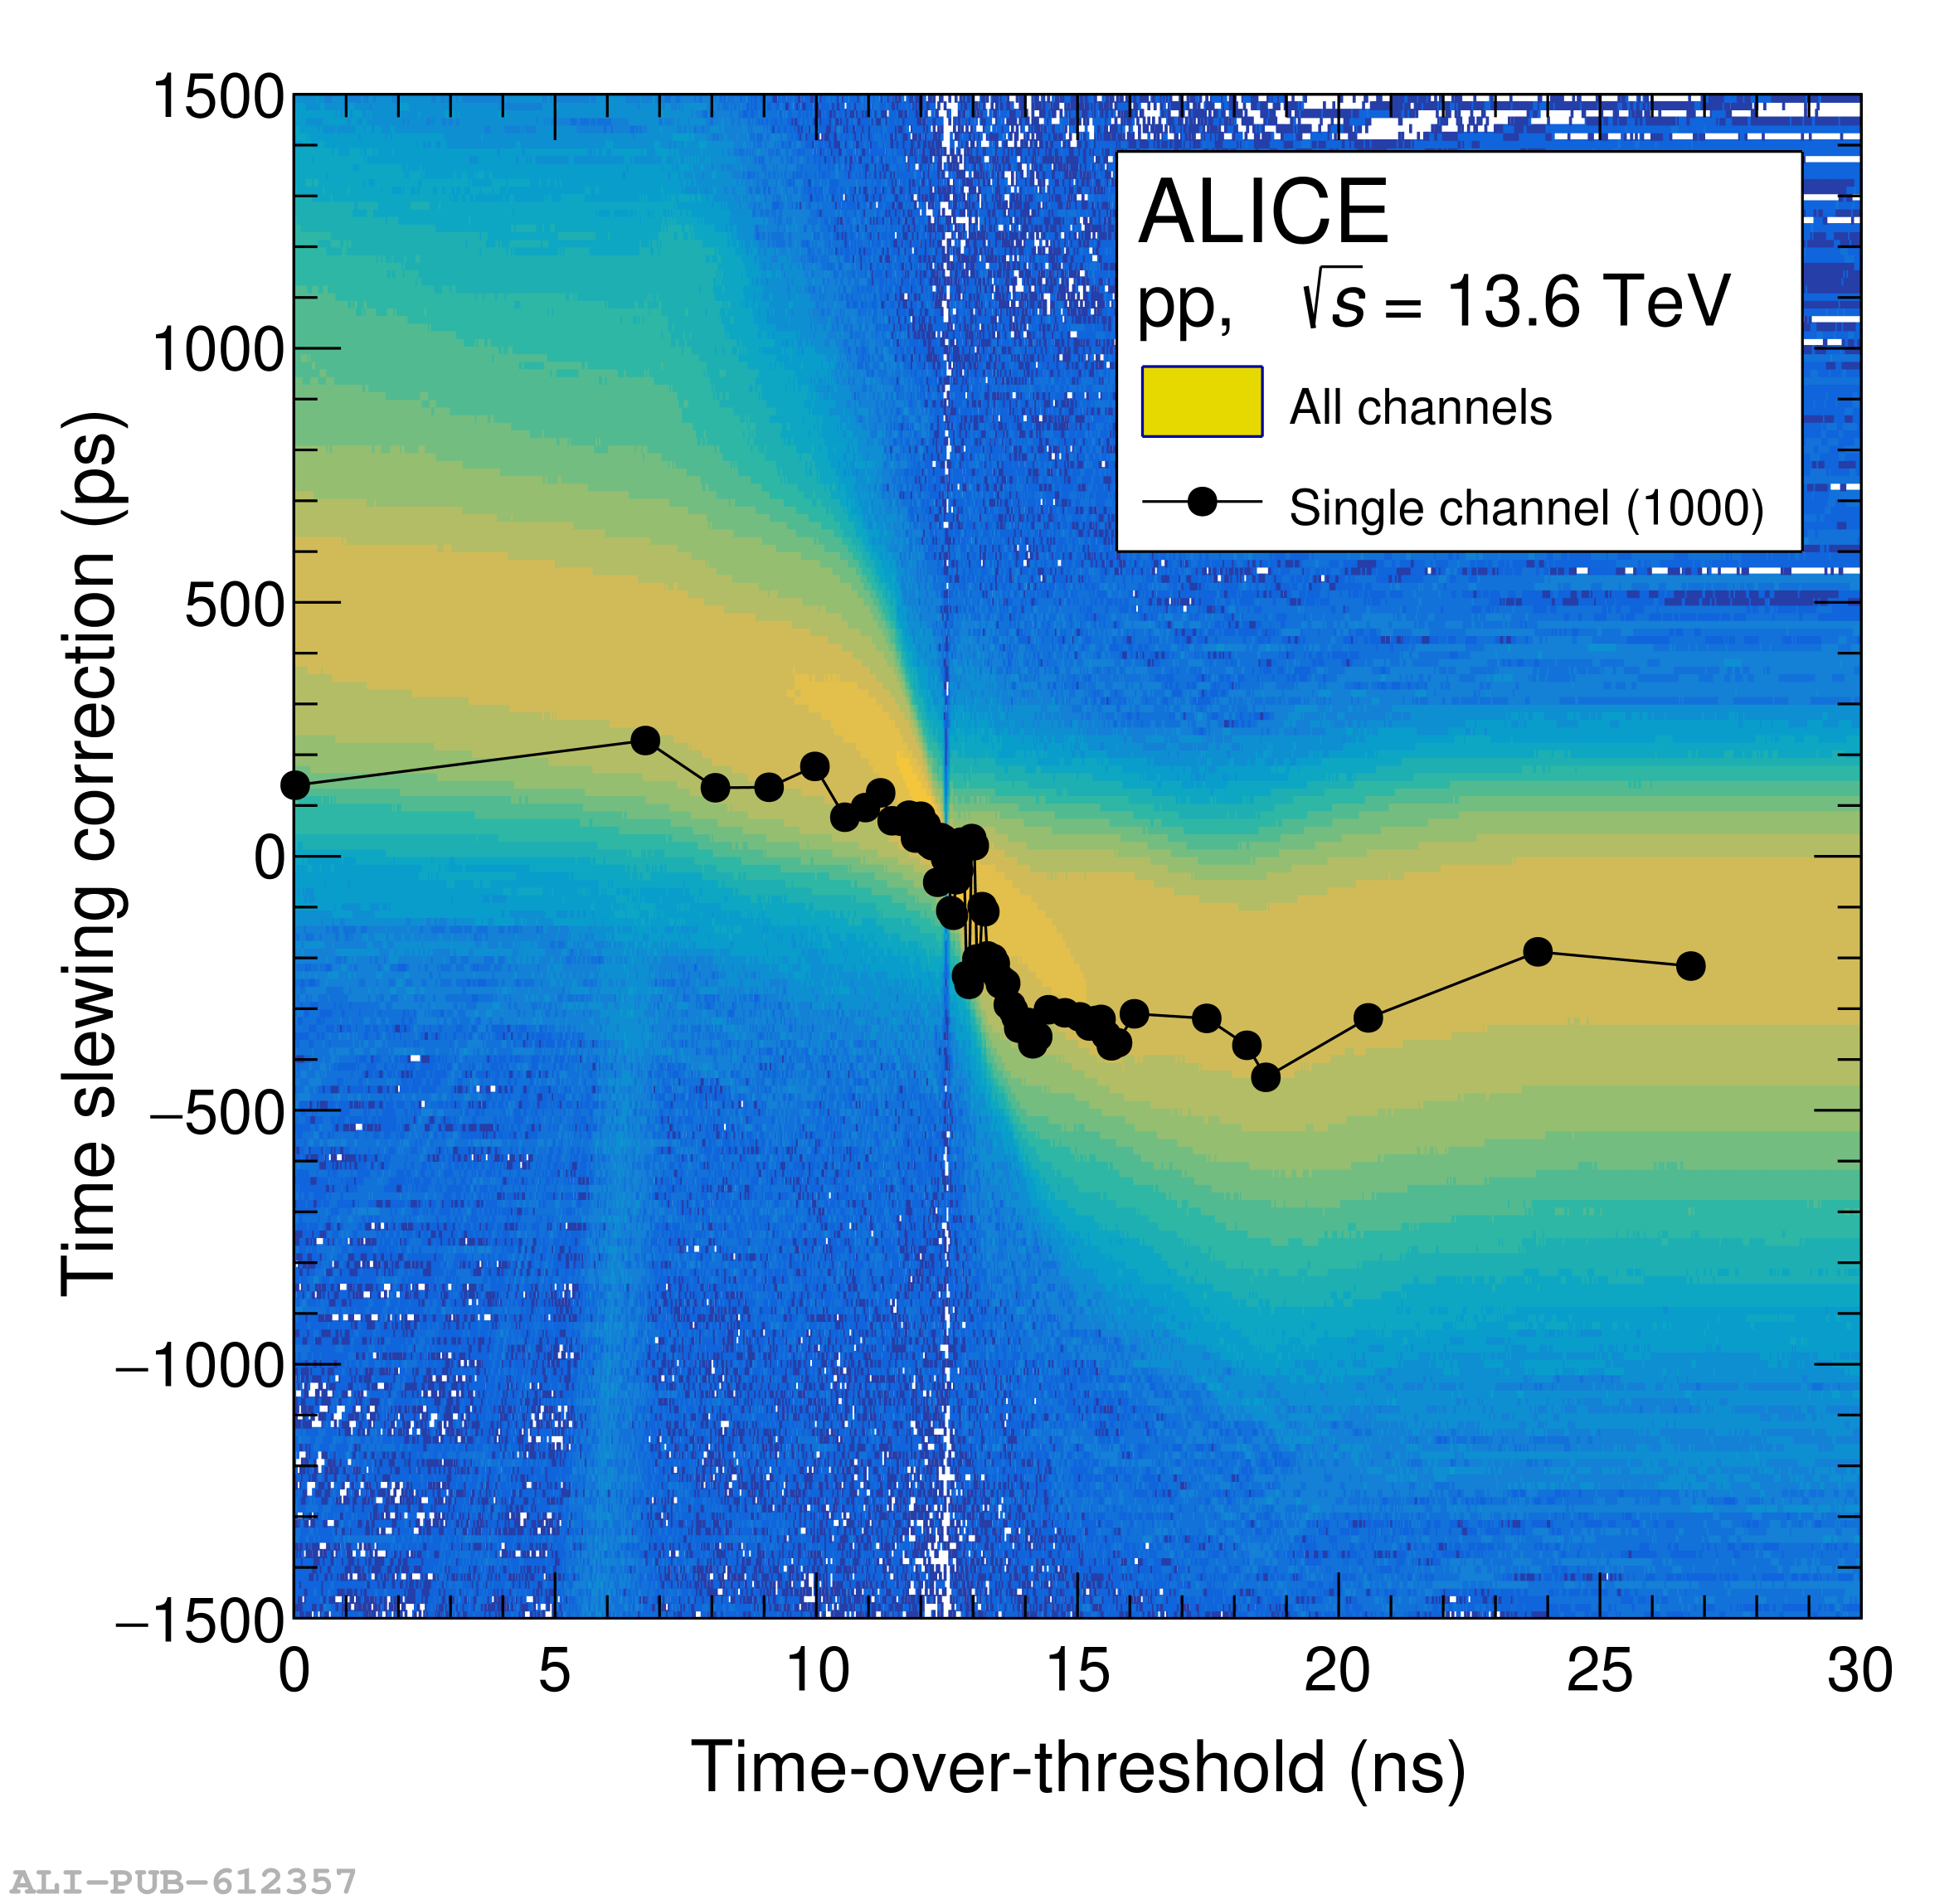 |
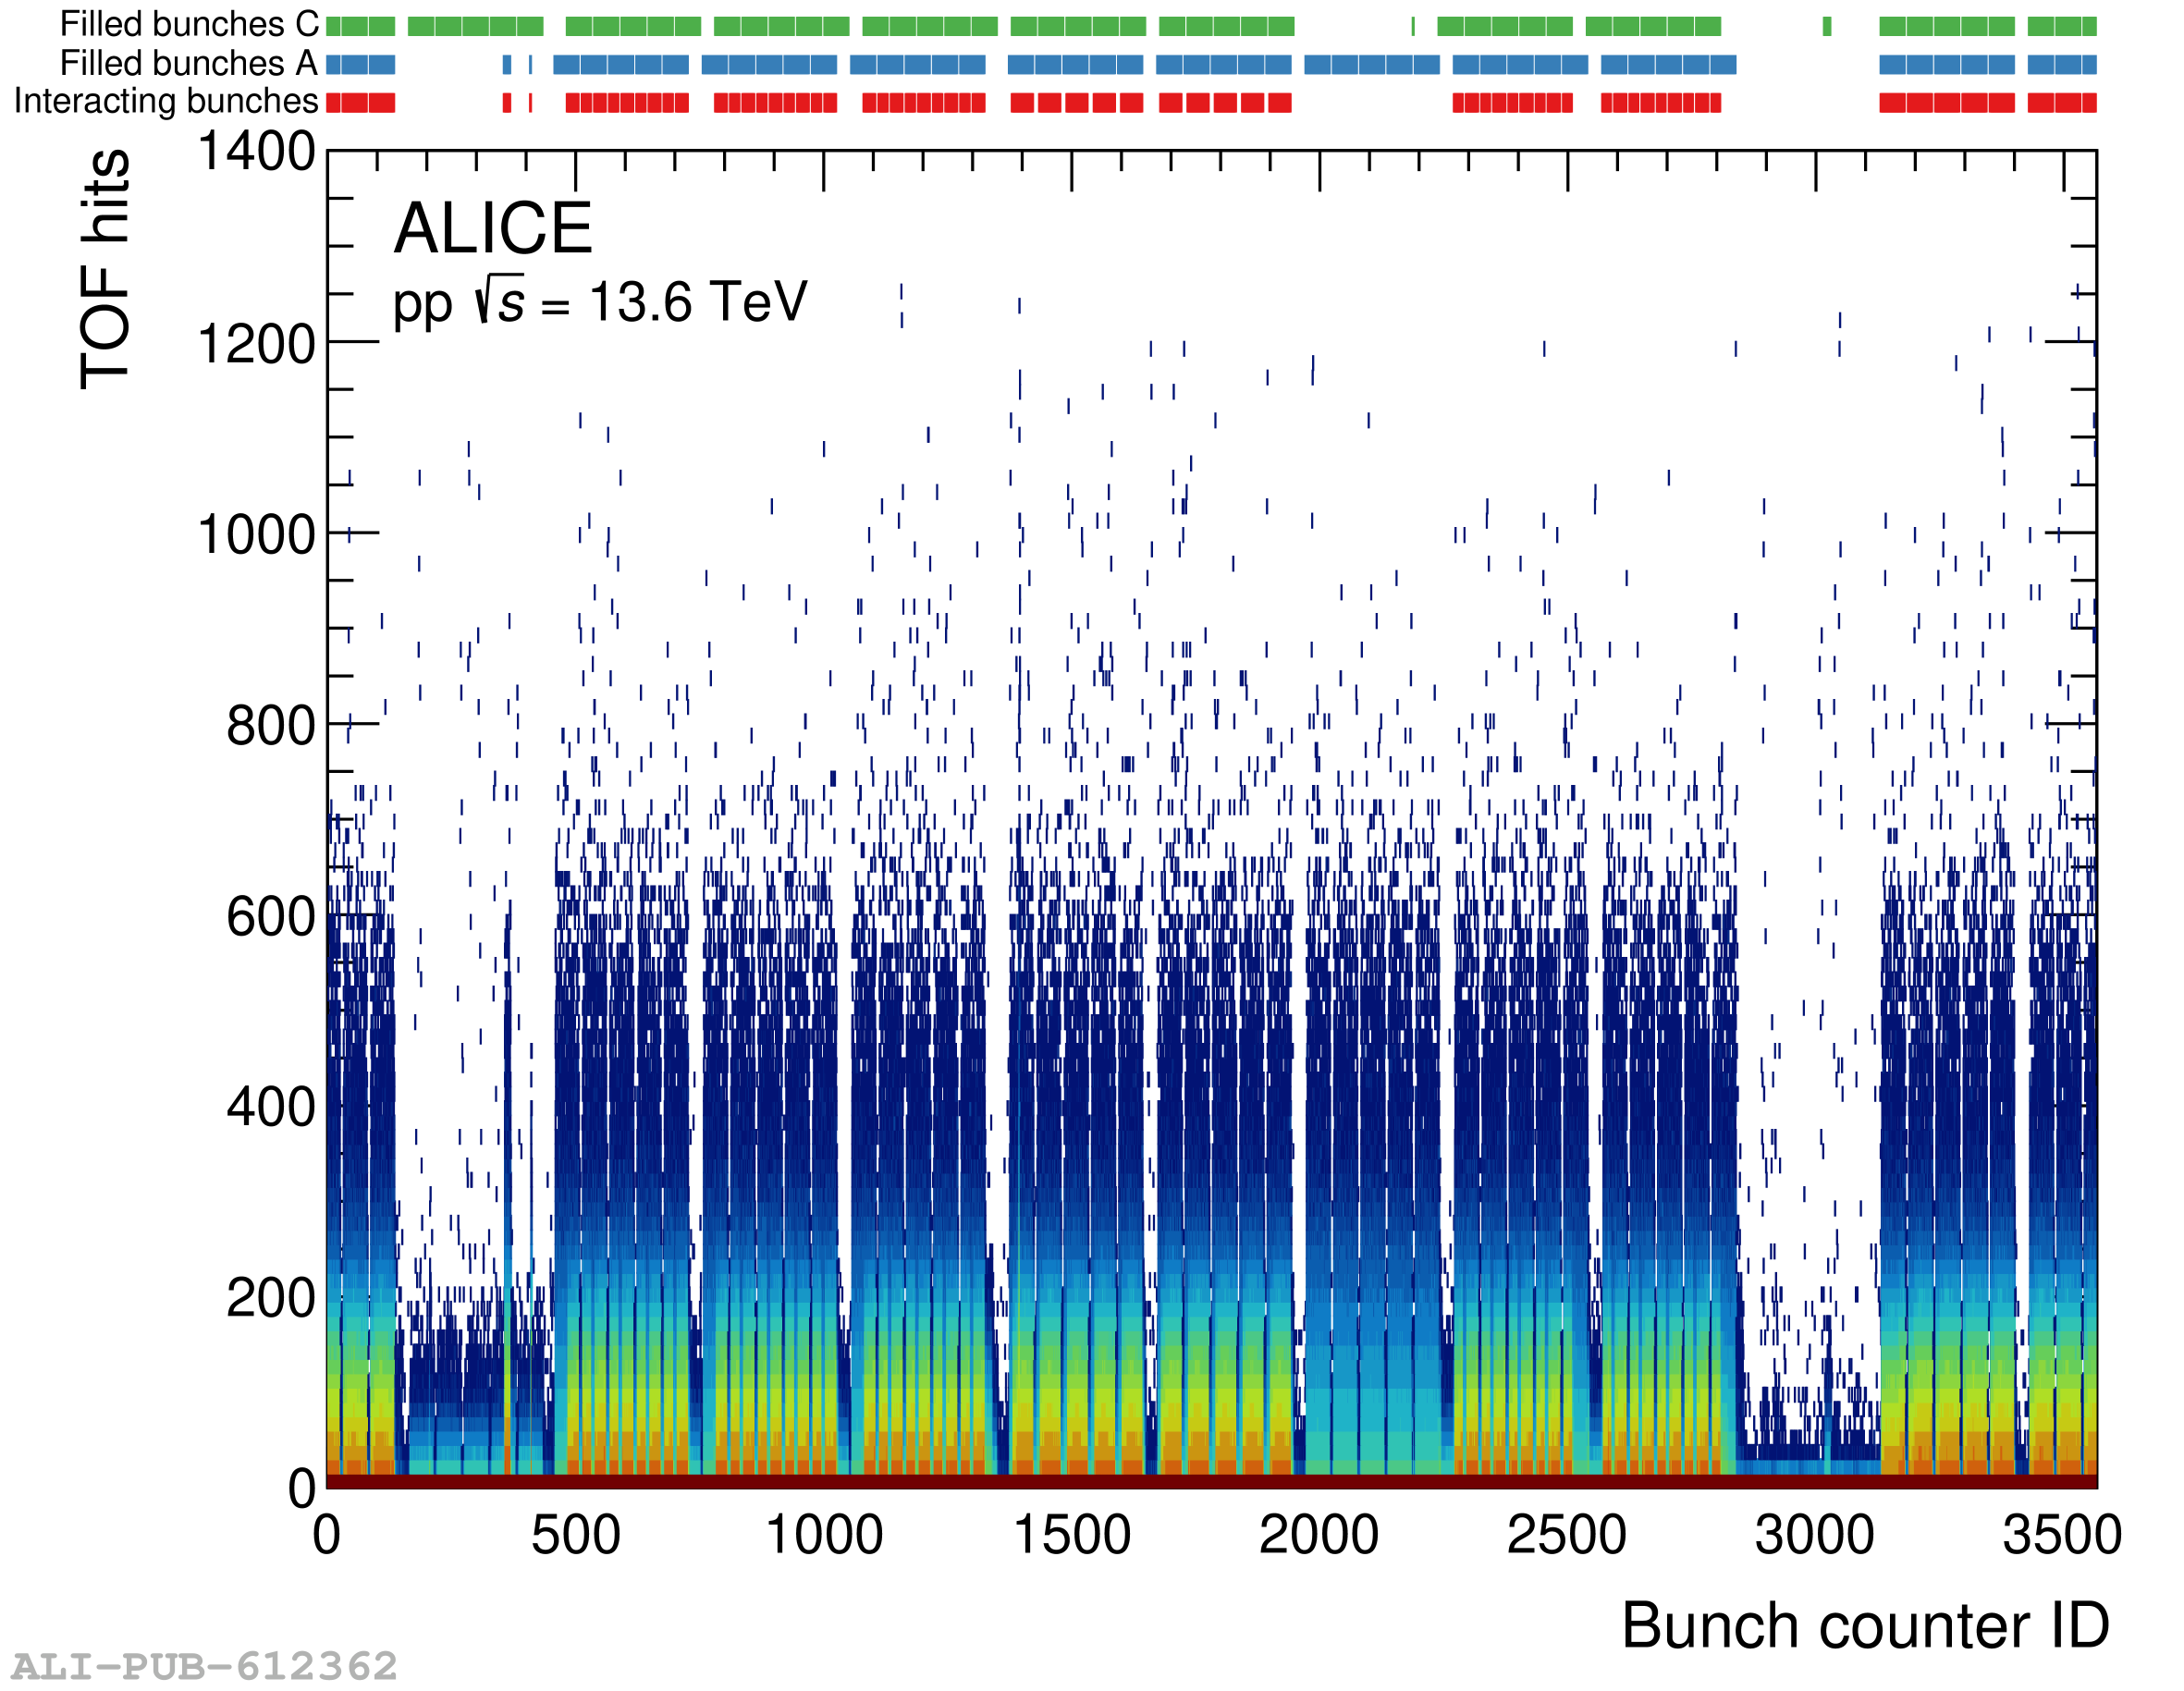
Figure 6
Time difference measured with TOF with respect to the expected value for the charged-pion mass hypothesis as a function of momentum, blue colors represent lower counts The two vertical shaded regions indicate momentum ranges used to obtain the final time resolution for the two methods presented in the text. |  |
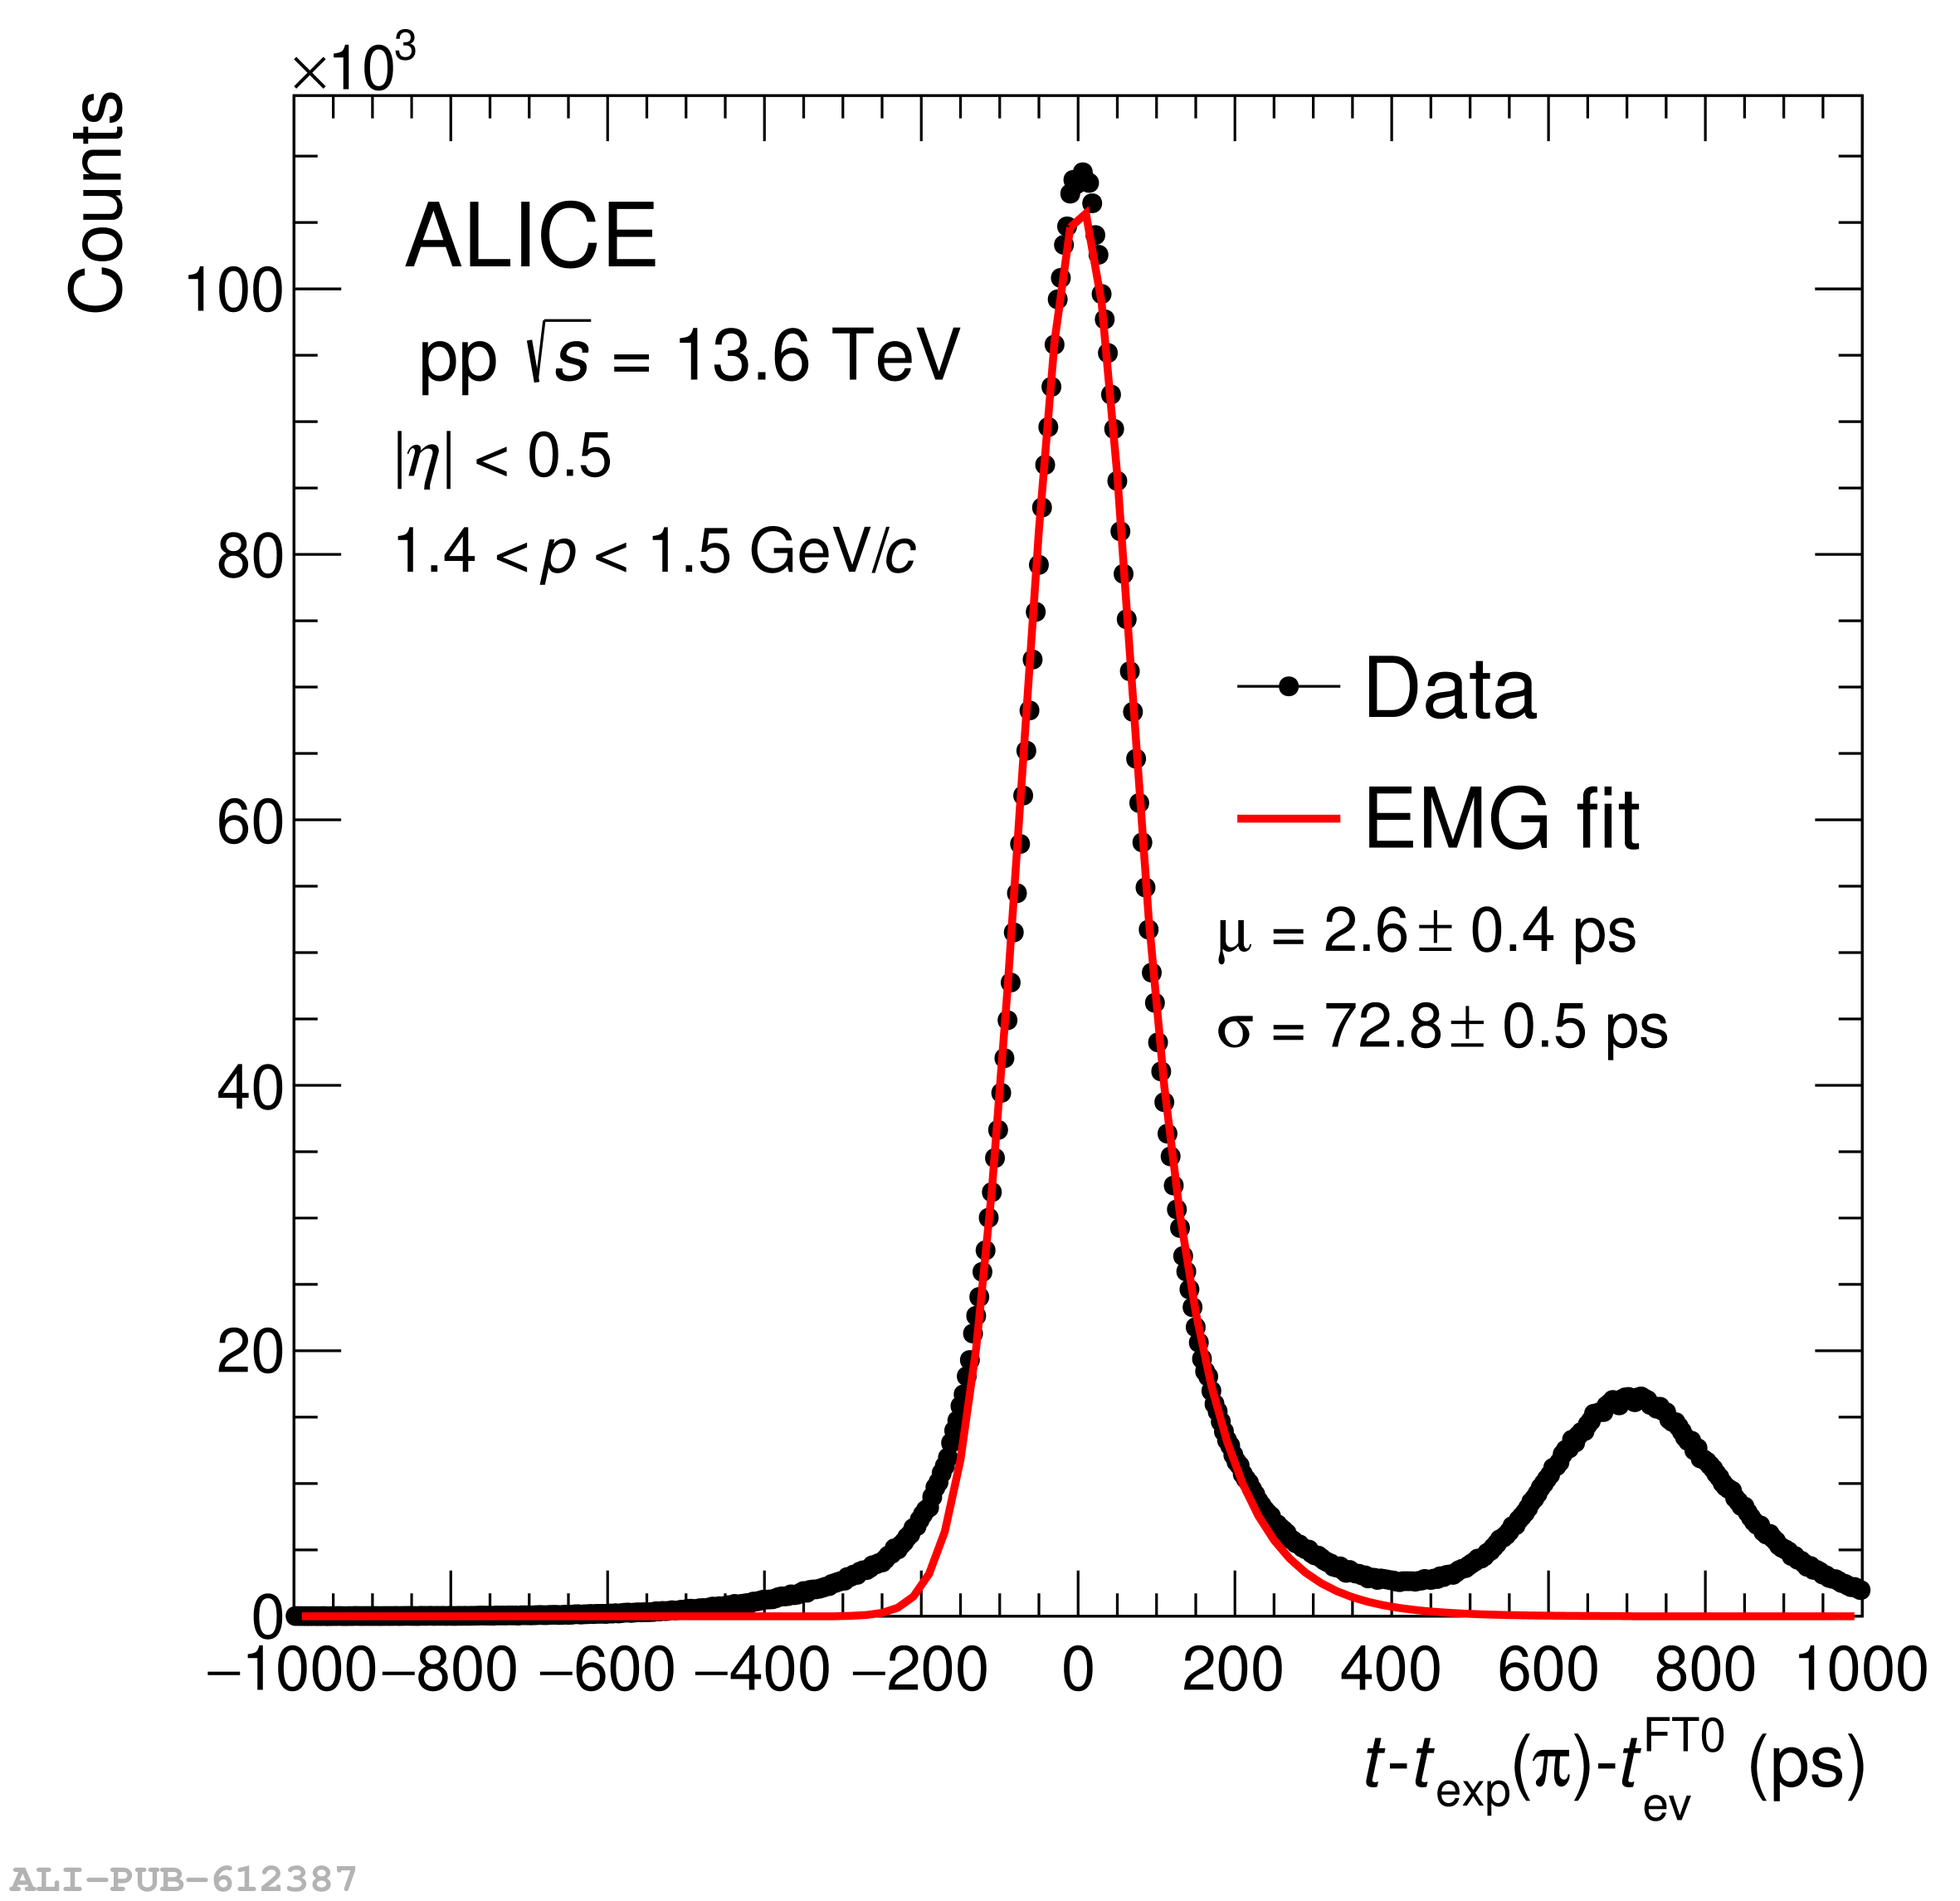
Figure 9
Distribution of \doubledelta obtained by considering the track under study in the momentum range $ 1.4 p \gevc{1.5}$ In this momentum range, the peaks corresponding to pions and kaons can be clearly distinguished The red curve represents the Gaussian fit used to extract the \doubledelta time resolution. The fit is done over the full range, and the results obtained for different ranges are taken into account in the error. | 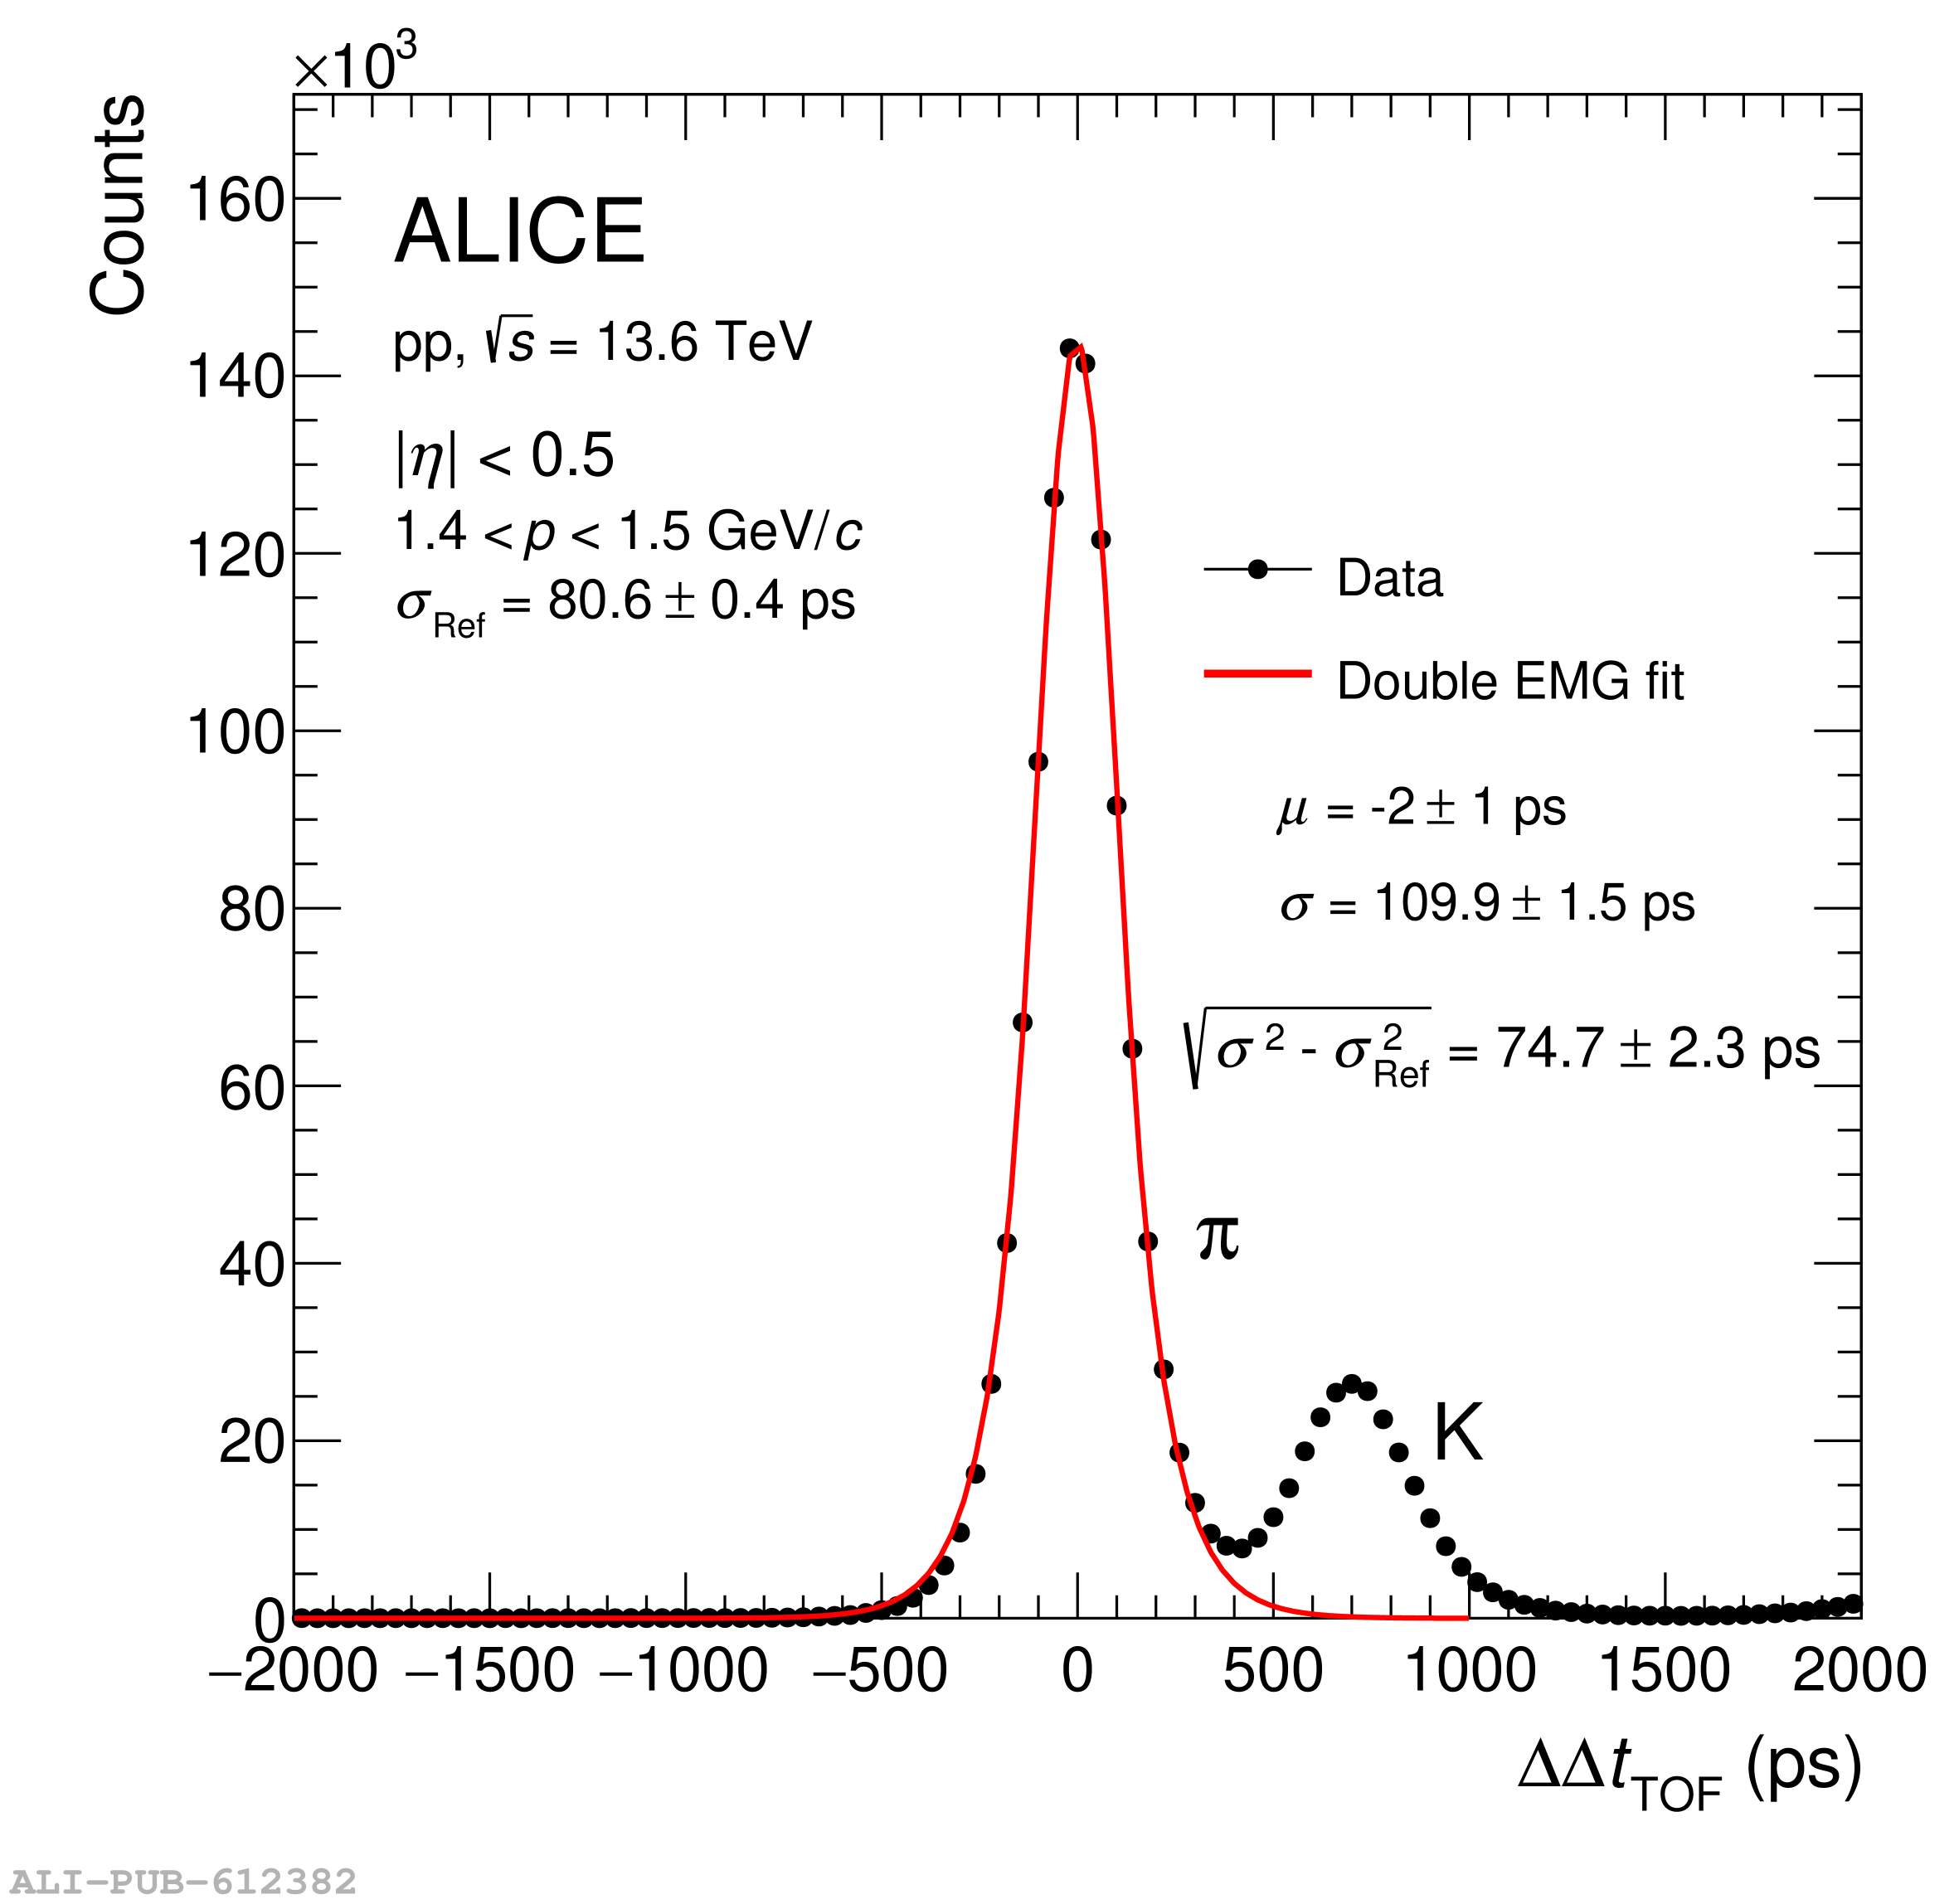 |