$\jpsi$ $\pt$-differential production yields in Pb-Pb collisions at $\snn=5.02$ TeV at midrapidity in the 0$-$10% (left panel) and 30$-$50% (right panel) centrality intervals. The statistical and systematic uncertainties are indicated, respectively, by the vertical error bars and the open boxes. The horizontal bars indicate the $\pt$ intervals. Data are compared to model calculations from Refs. [32, 33, 70]. The ratios between data and models are shown in the lower panels. The filled boxes around unity depict the quadratic sum of statistical and systematic uncertainties from the measurement, while the bands indicate model uncertainties. |  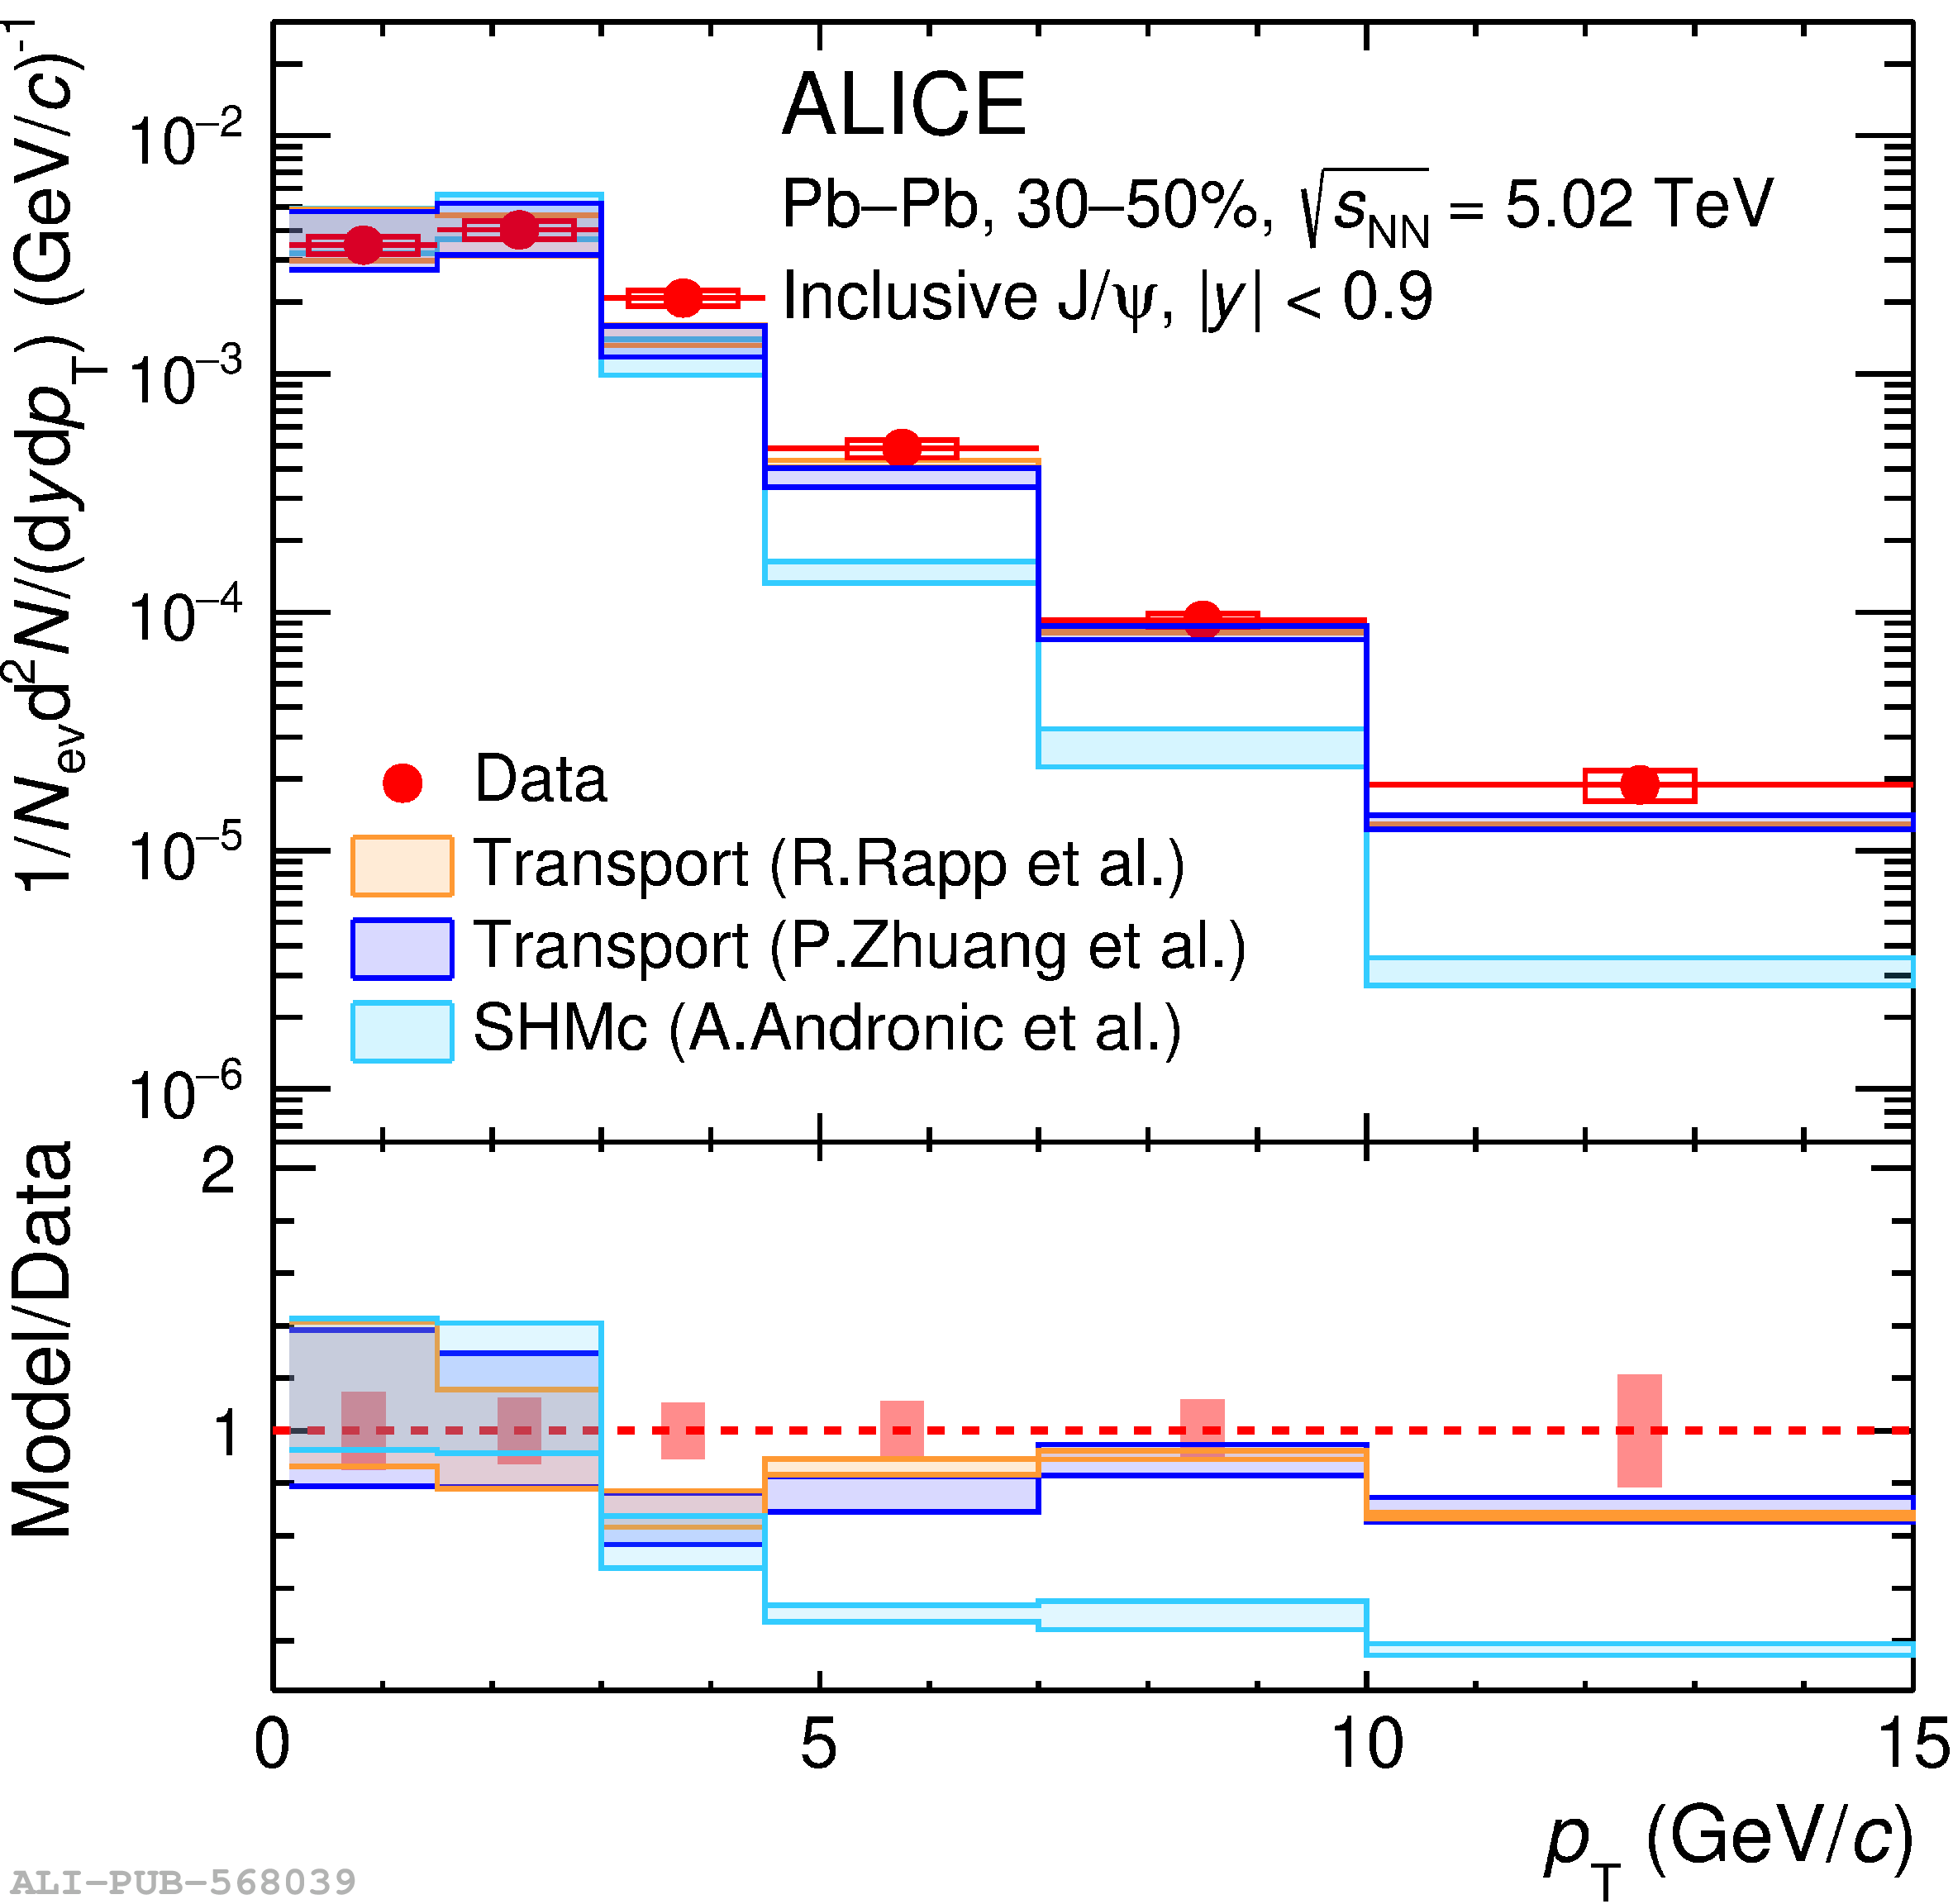 |