$\jpsi$ $\langle \pt \rangle$ extraction in Pb-Pb collisions at $\snn = 5.02$ TeV at midrapidity for the 0$-$5% (left panel) and the 70$-$90% (right panel) centrality interval. The data points correspond to opposite-sign ${\rm e^+e^-}$ pairs from the same event, the blue line to the ${\rm e^+e^-}$ pairs from mixed events, and the red line is the combined fit that includes the mixed events and residual background which is described by the polynomial function. | 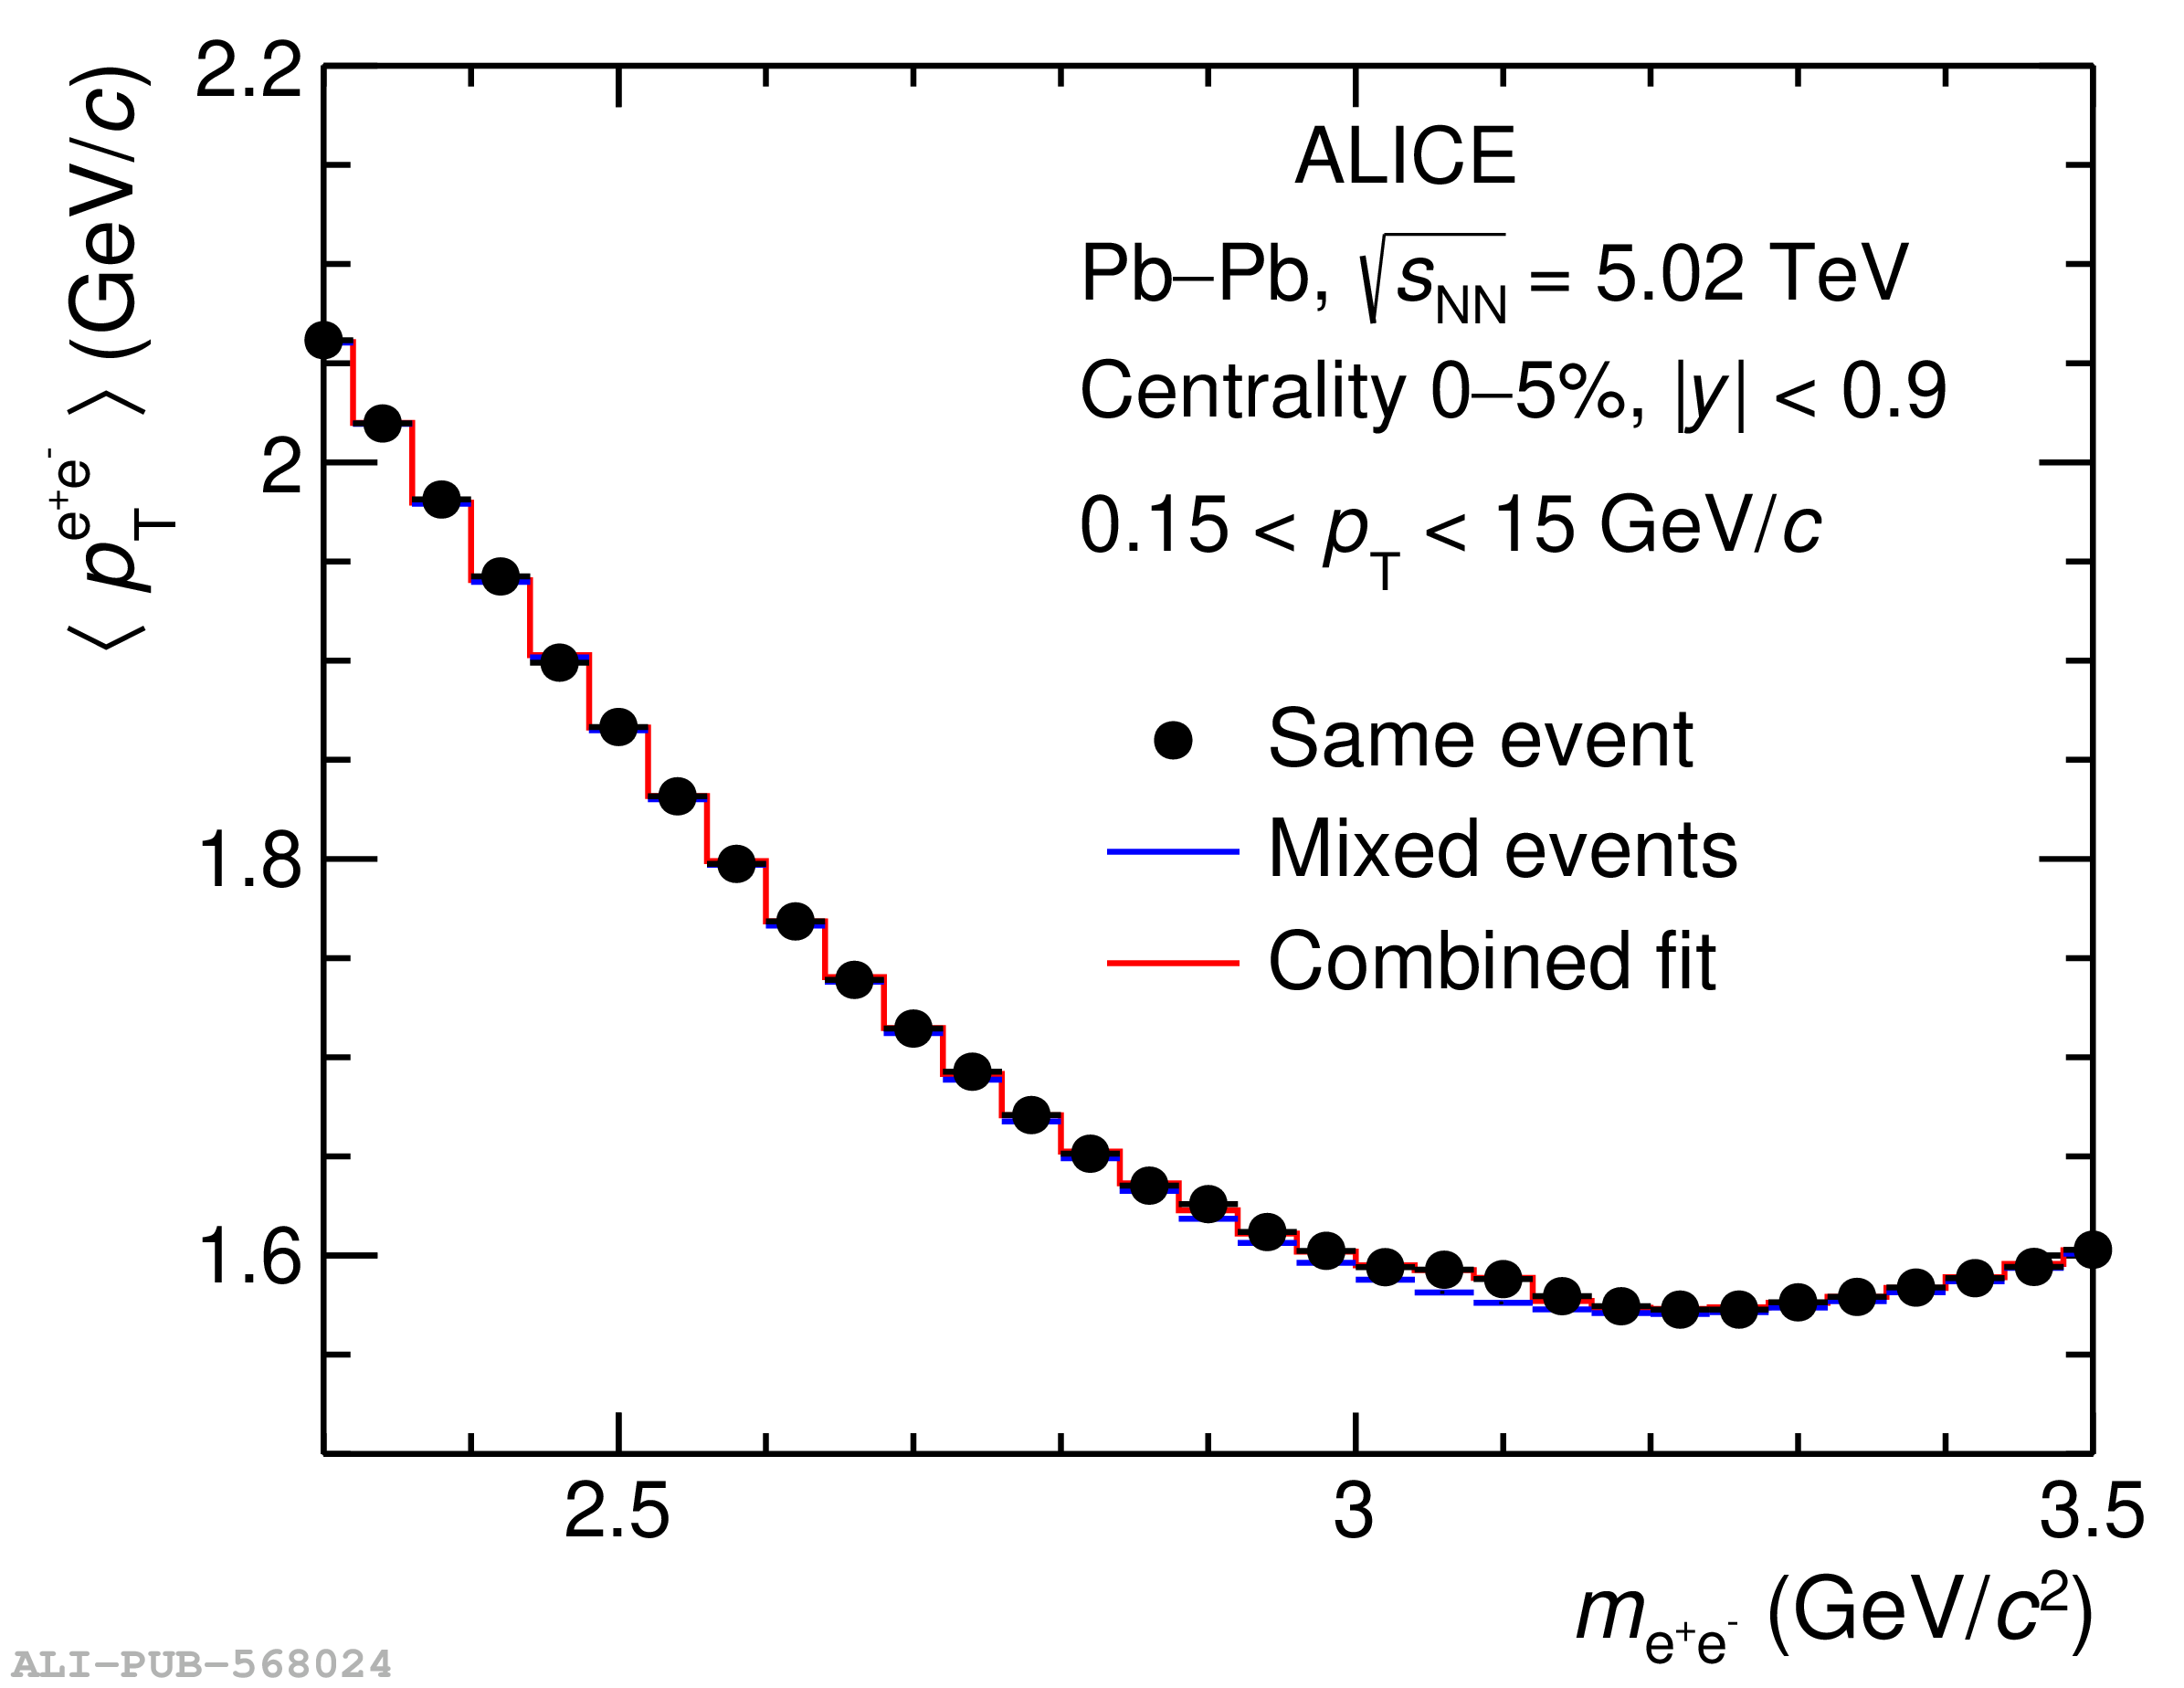  |