The left panel shows the measured ${\rm K^{*0}}$/K yield ratio along with model calculation. The right panel shows the lower limit of hadronic phase lifetime as a function of $\langle {\rm d}N_{\rm ch}/{\rm d}\eta \rangle^{1/3}_{|\eta|< 0.5}$ in different collision systems. Bars and shaded boxes represent the statistical and systematic uncertainties, respectively. | 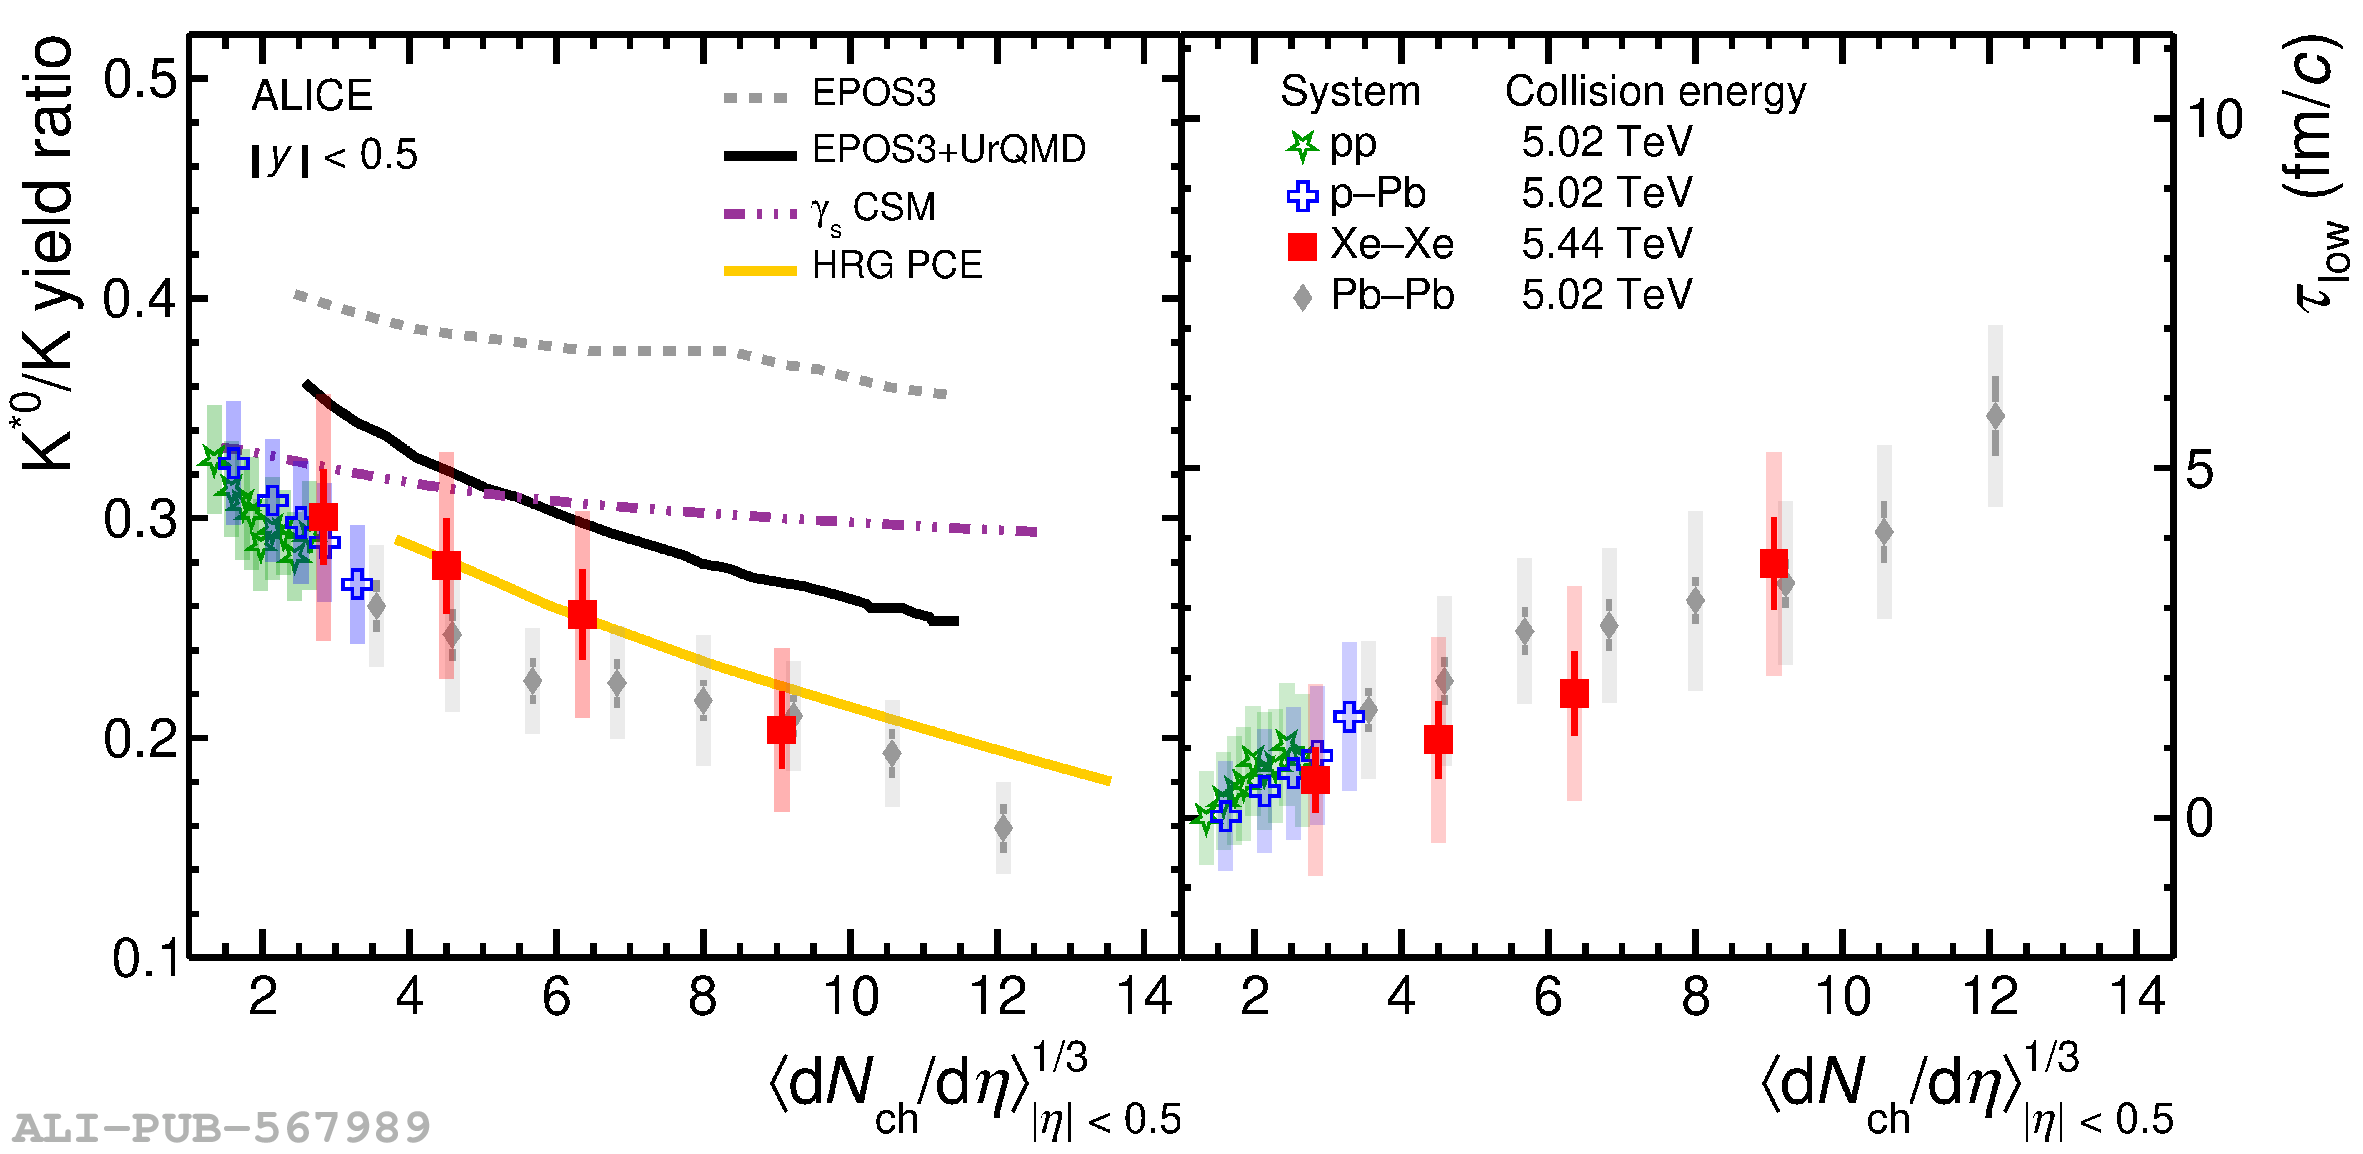 |