The left panel shows the $\pt$ distributions of ${\rm K^{*0}}$ meson in four different centrality classes of Xe-Xe collisions at $\snn$ = 5.44 TeV. The right panel shows the comparison between the ${\rm K^{*0}}$ $\pt$ spectrum in 0$-$30$\%$ Xe-Xe collisions at $\snn$ = 5.44 TeV and in 20$-$30$\%$ Pb-Pb collisions at $\snn$ = 5.02 TeV, both having similar multiplicities. The statistical and systematic uncertainties are shown by bars and boxes, respectively. | 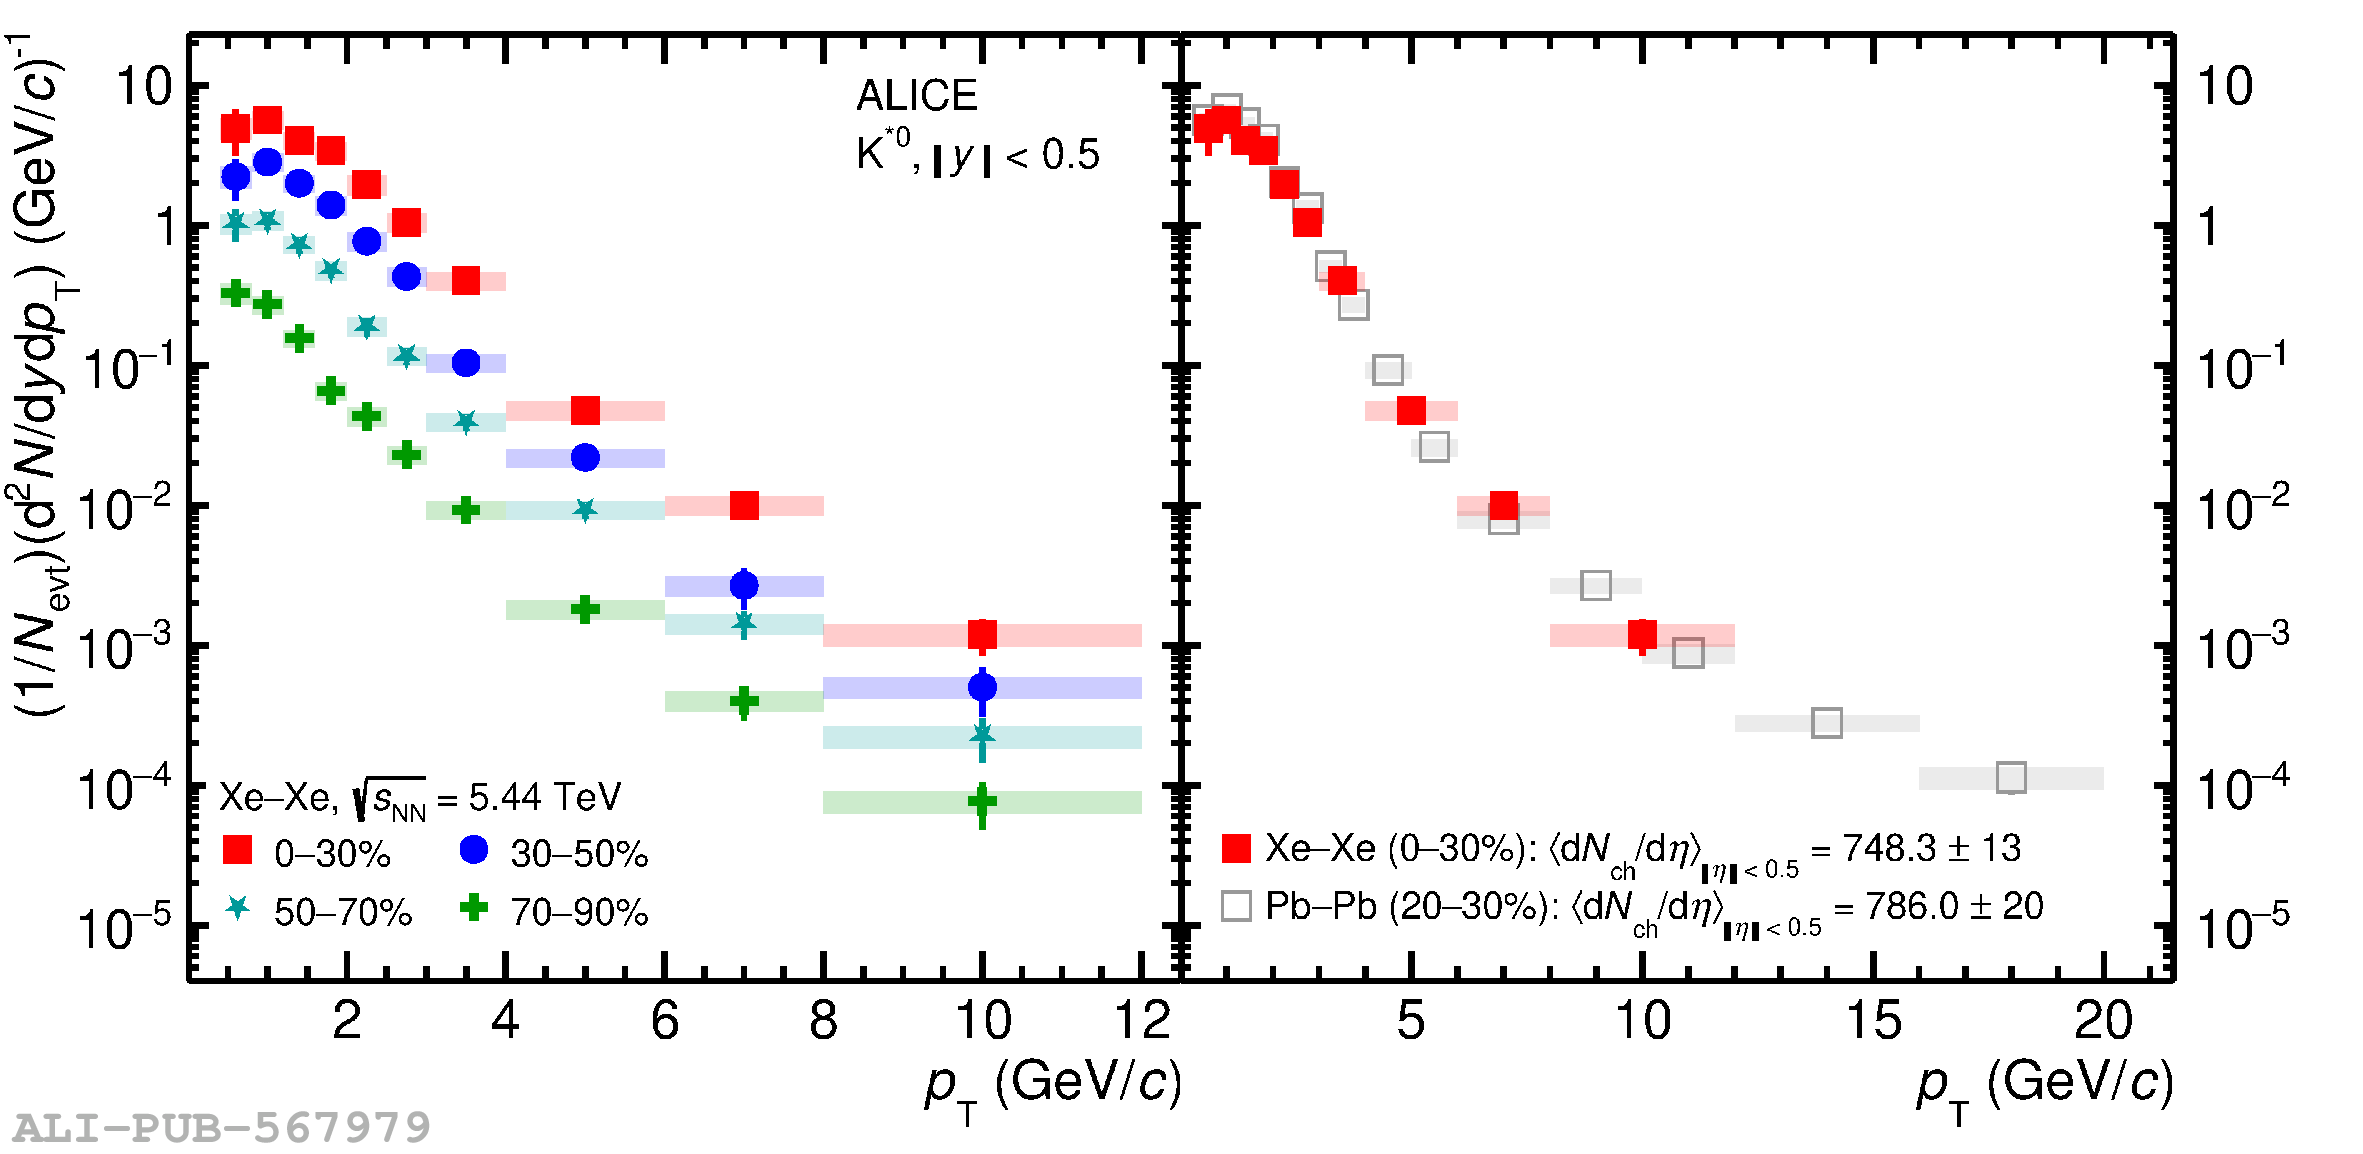 |