Left panel: example of the raw-yield distribution as a function of the minimum non-prompt $\Dzero$-meson BDT score threshold to determine the non-prompt $\Dzero$-meson fraction in $3 < \pt < 4$ $\GeV/c$. Right panel: $v_2^{\rm sig}$ as a function of $f_{\rm nonprompt}$ in $3 < \pt < 4$ $\GeV/c$. The blue band represents the 1$\sigma$ confidence interval obtained from the linear fit. | 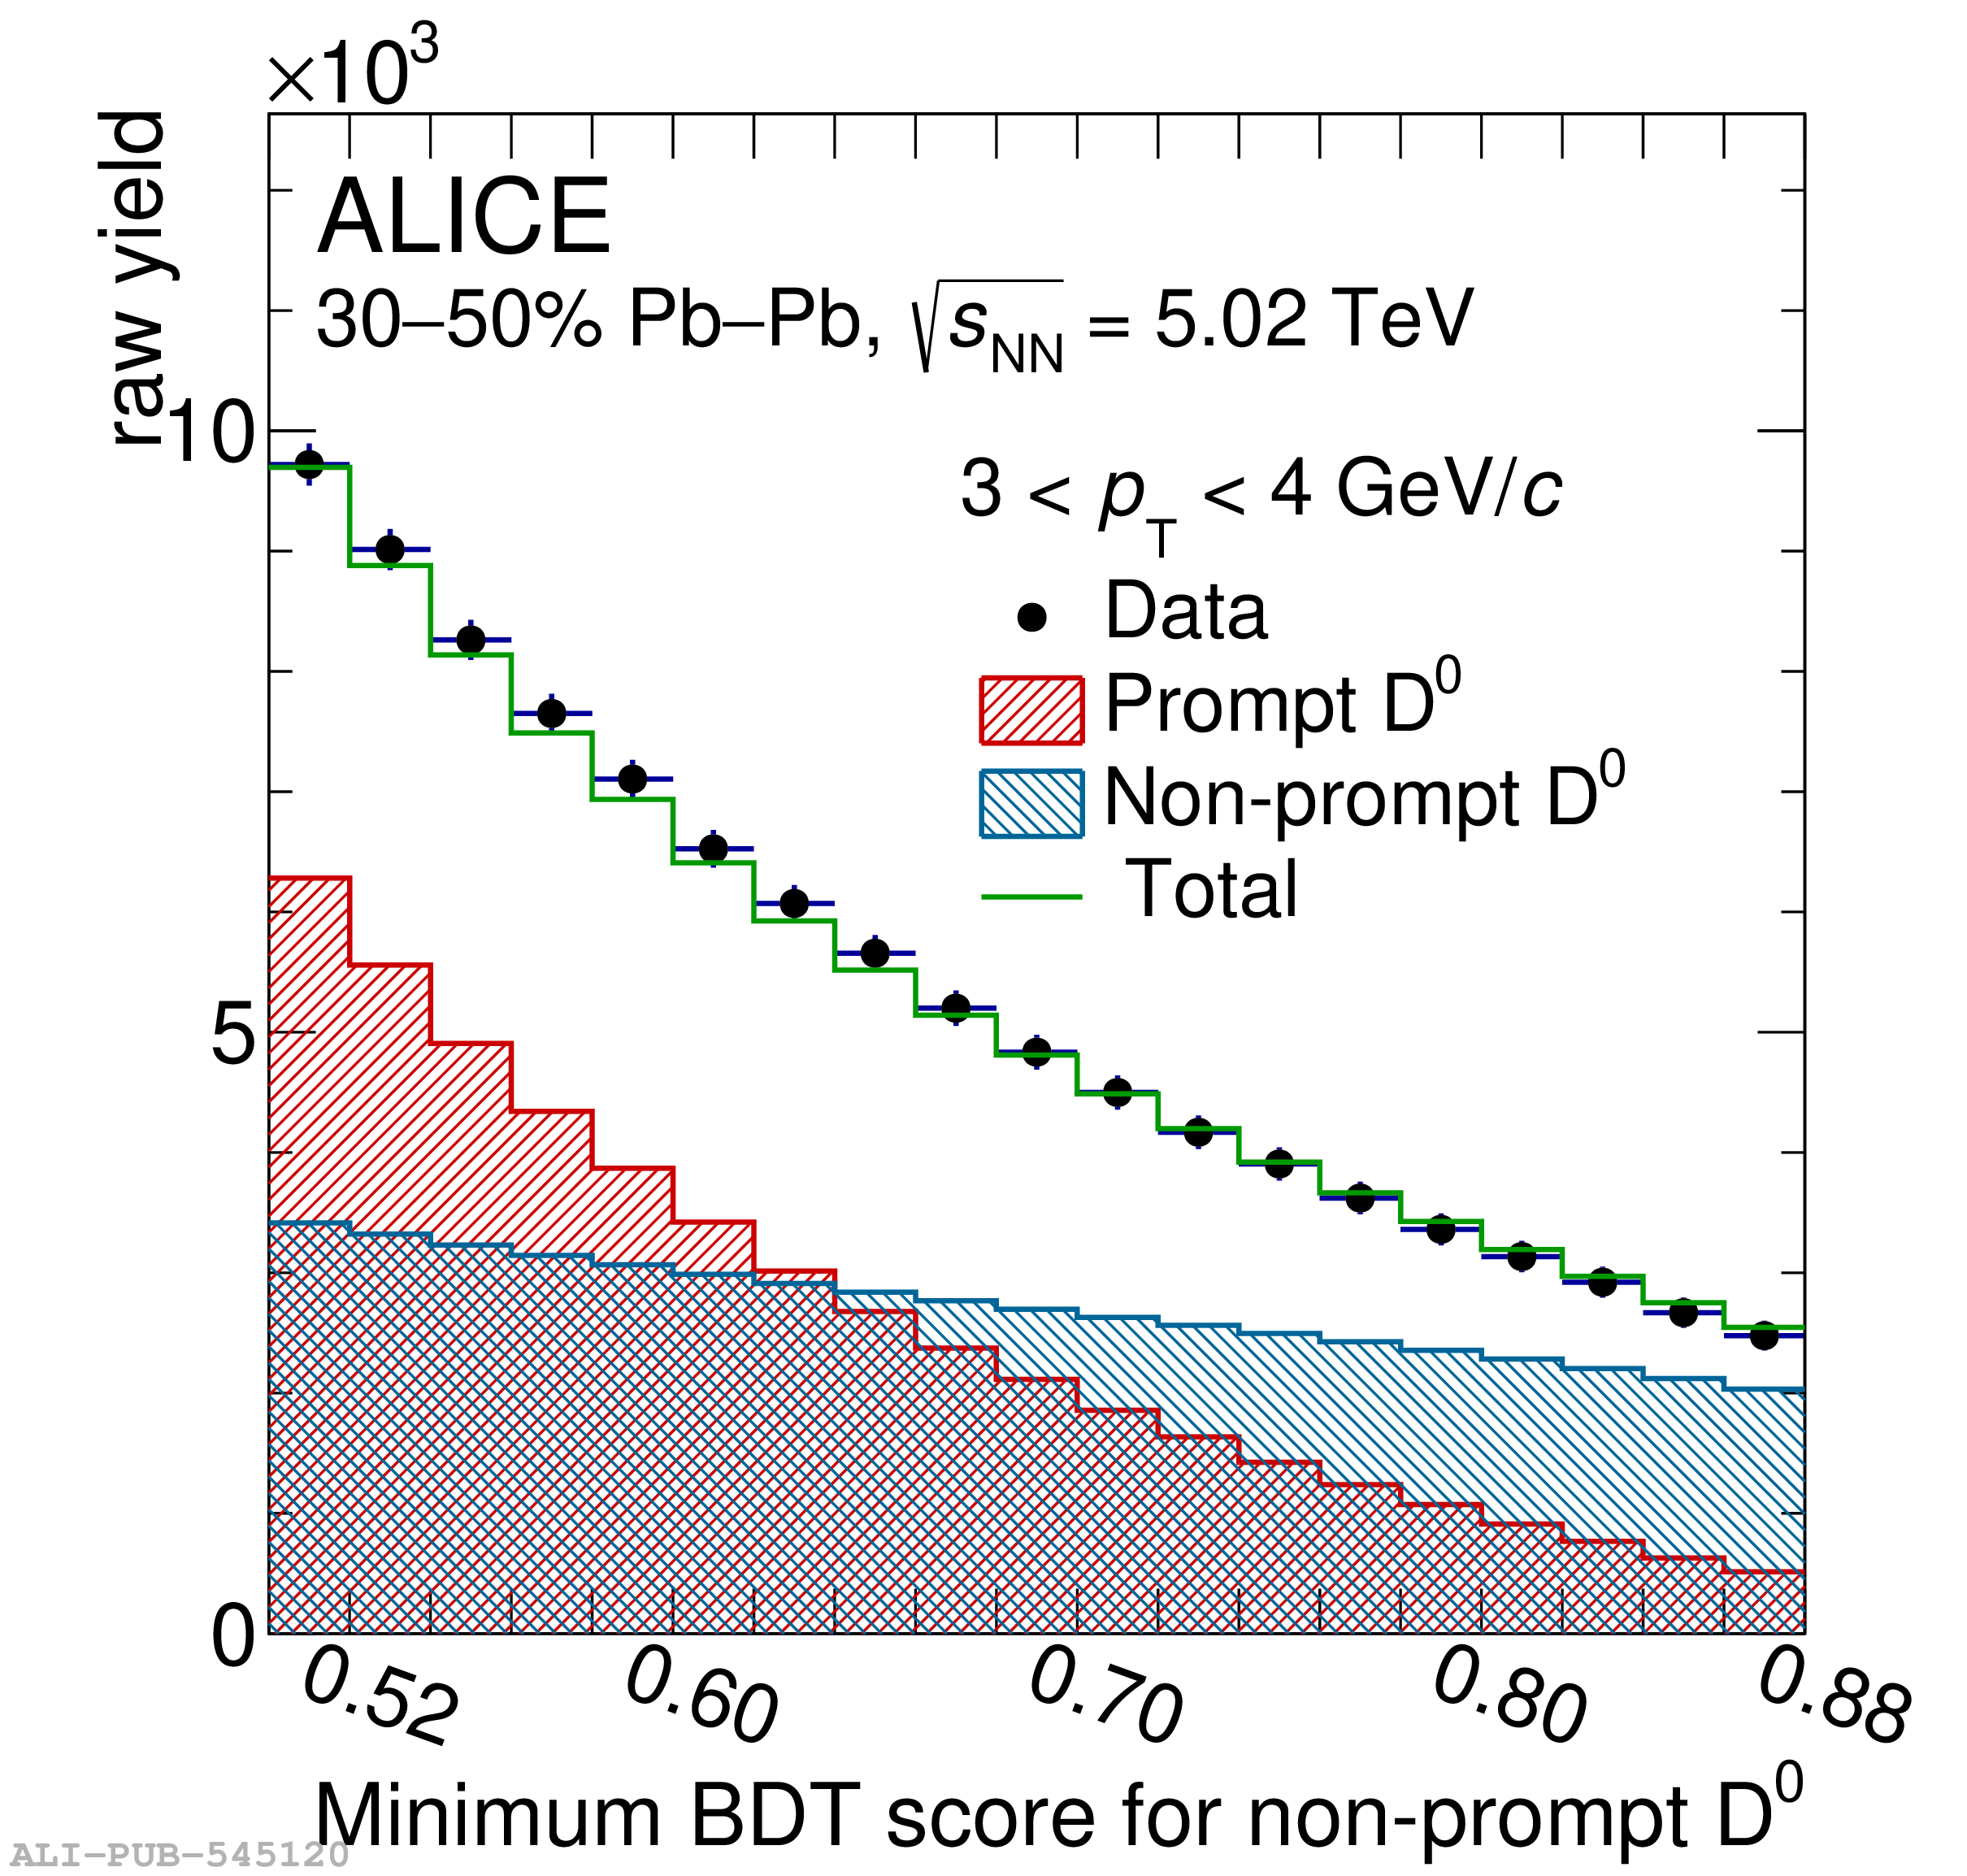 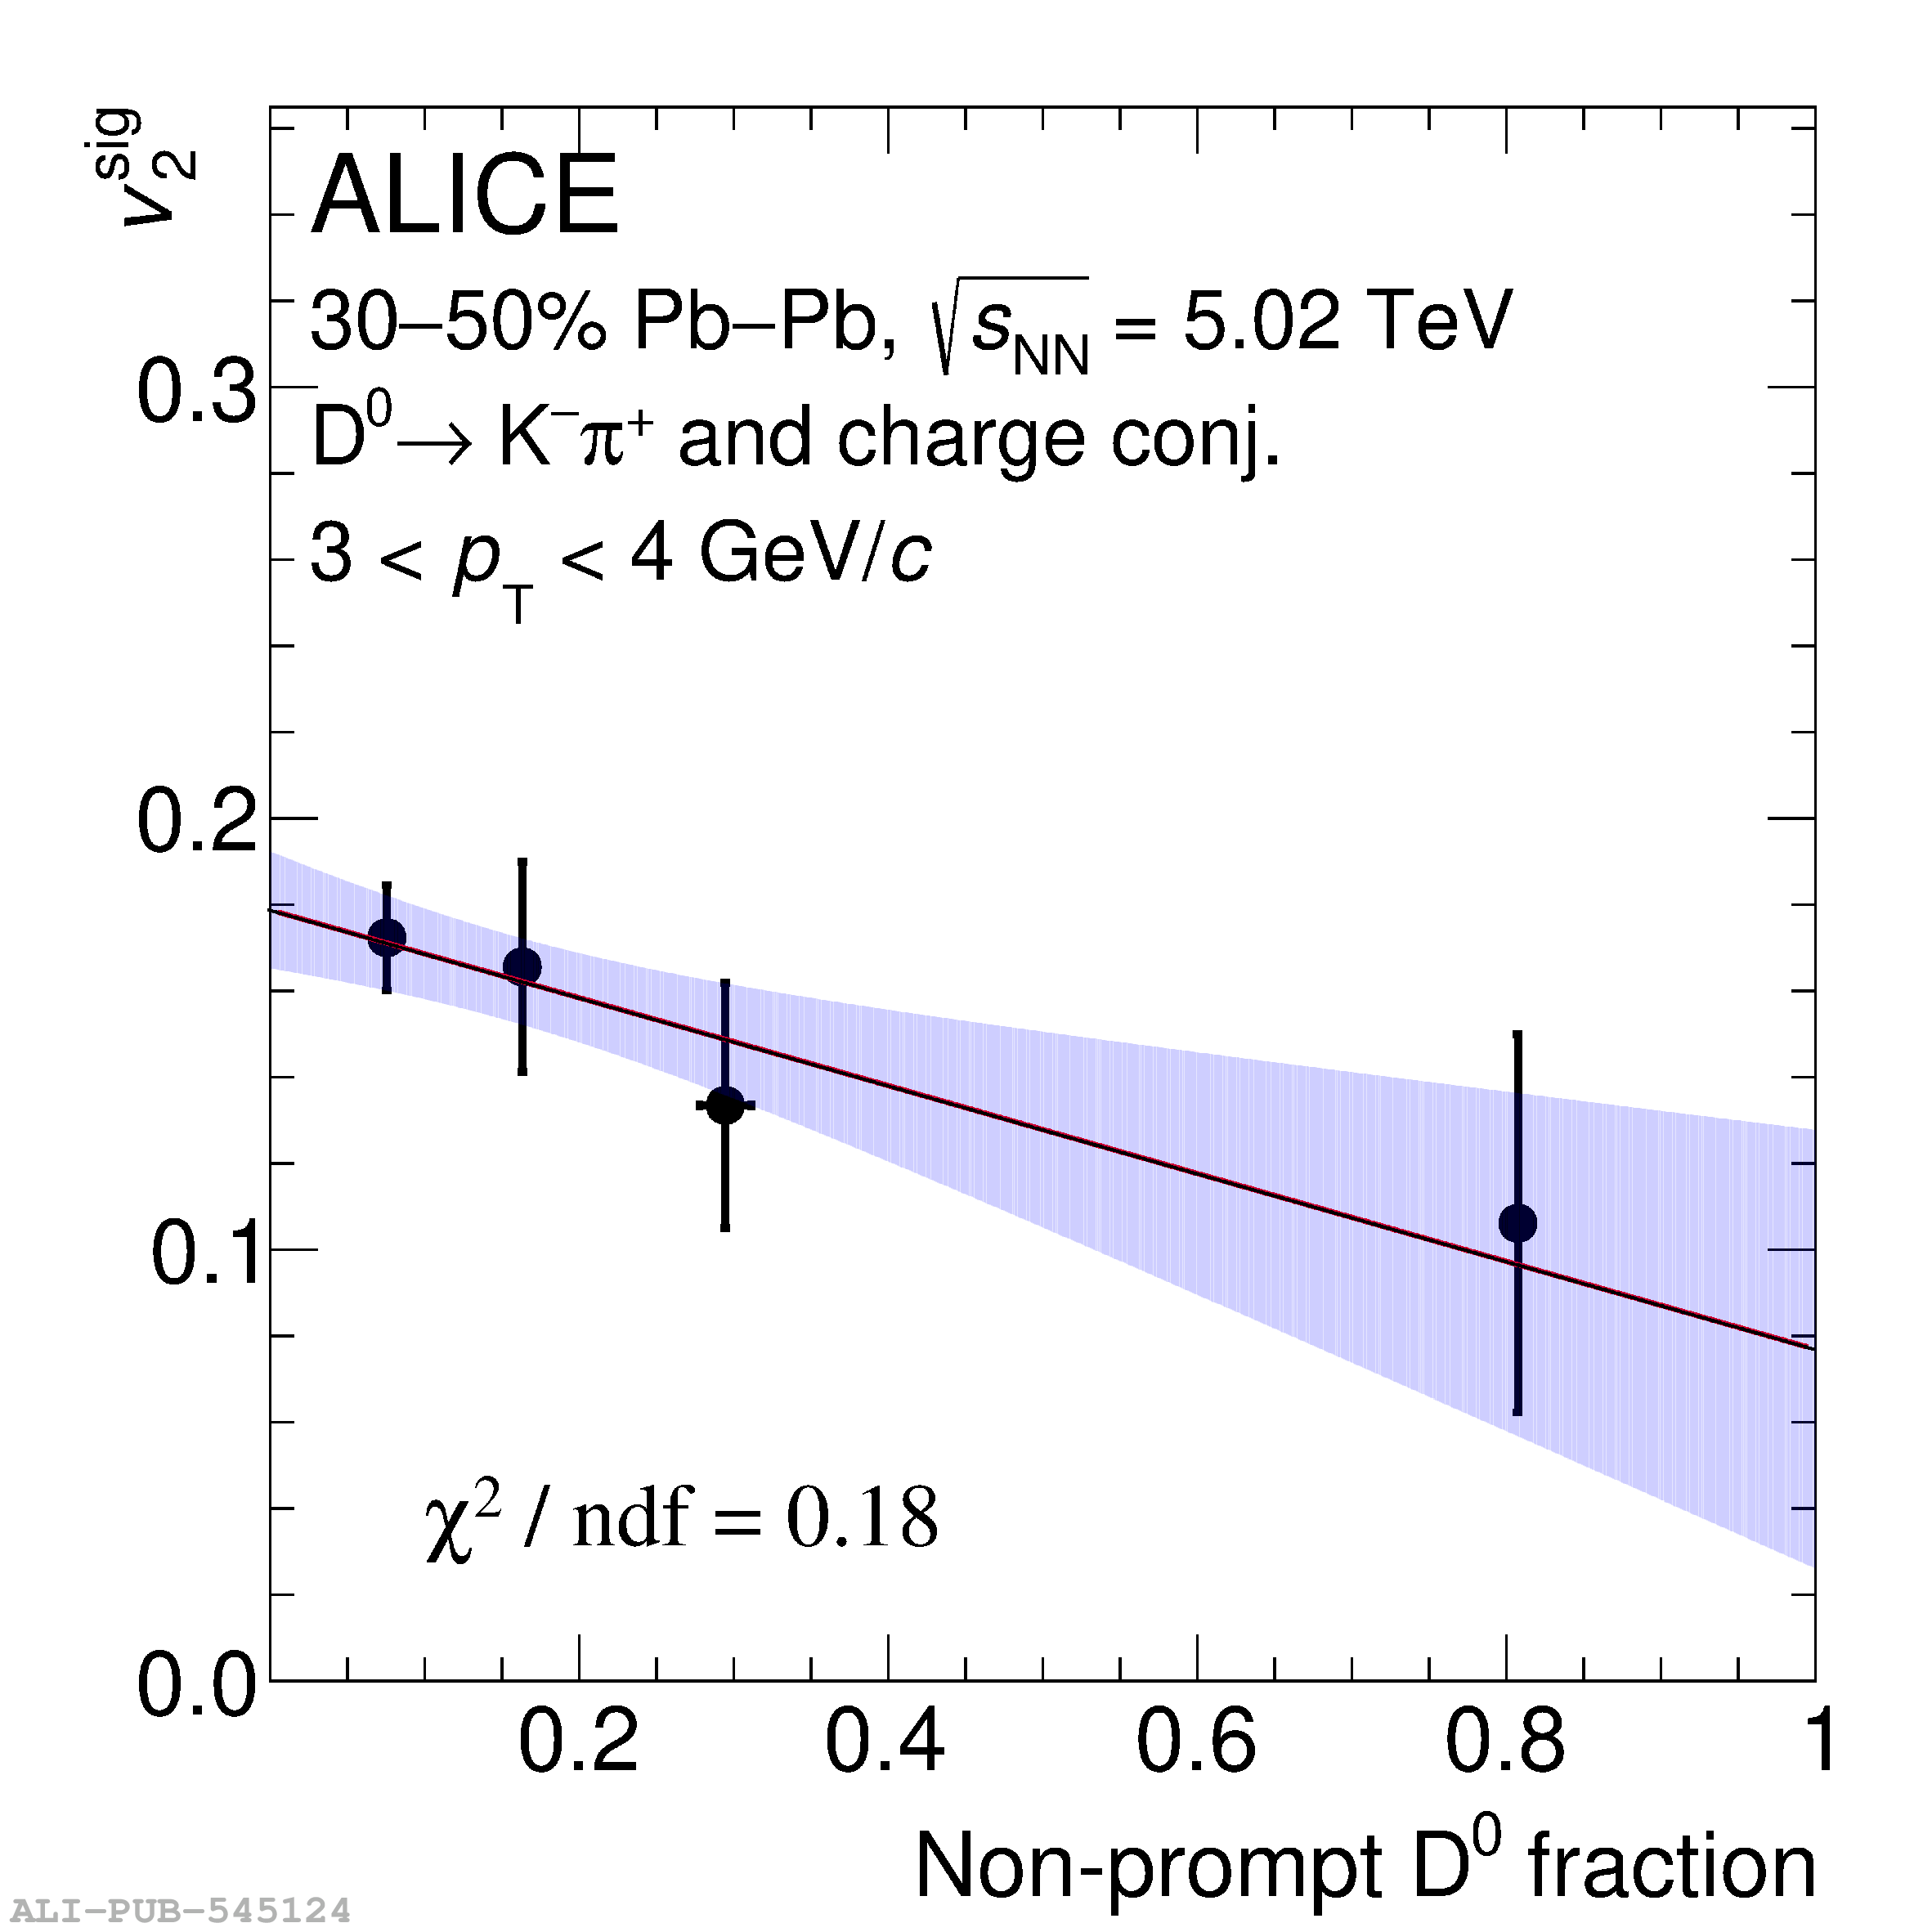 |